For 2016 details - North West Property Market 2016
Story Highlights
- North West England had total property sales of £22 billions in 2015
- Across its counties the maximum sale was in Greater Manchester at £8.1 billions
- The total number of properties sold in 2015 was 117,853
- The average sales price in North West England was £184 K and the median was £140 K
- The average sales price at county level was maximum in Cheshire East at £253 K
- New Property contribution by value was 13.05% where as Not New was 89.97%
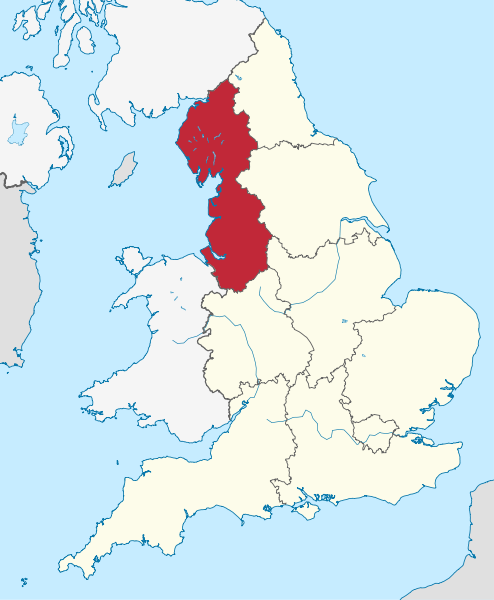
North West England is one of the 9 principal areas of England. It consists of Cheshire East, Cheshire West and Chester, Halton, Warrington, Cumbria, Great Manchester, Lancashire, Blackpool, Blackburn with Darwen, Merseyside.
Total Value of Sales By Property Types
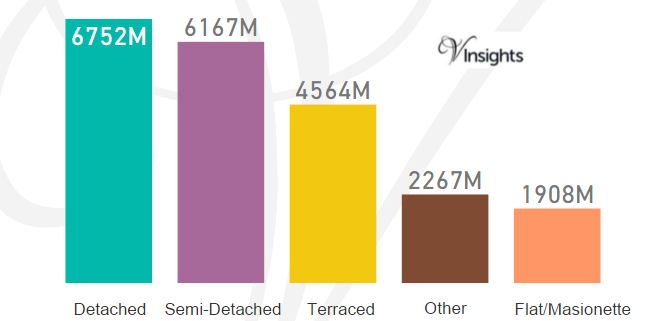
North West England had total property sales of £22 billions. It is 7.34% of England and Wales Property Market.
The split across the different property types are:
- Detached at £6.8 billions (31.17%)
- Semi-Detached at £6.17 billions (28.47%)
- Terraced at £4.56 billions (21.07%)
- Flat/Maisonette at £1.91 billions (8.81%)
- Other at 2.27 billions (10.47%)
Total Sales By County
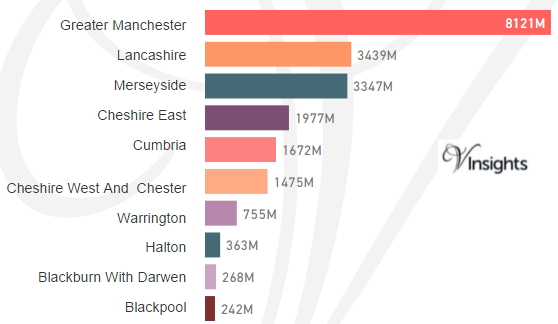
The total sales of £22 Billions in 2015 was split across its counties as above.
Total Number of Sales By Property Types
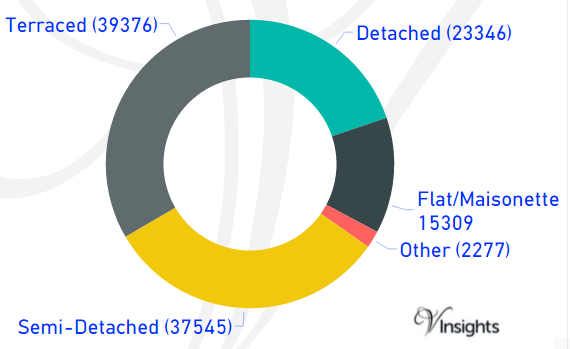
The total property sales of £22 billions in 2015 was spread over 117,853 properties.
- Terraced properties was at 39,376 (33.41%)
- Detached at 23,346 (19.81%),
- Semi-Detached at 37,545 ( 31.86%)
- Flat/Maisonette at 15,309 (12.99%)
- Others at 2,277 (1.93%)
Average & Median Sales Price
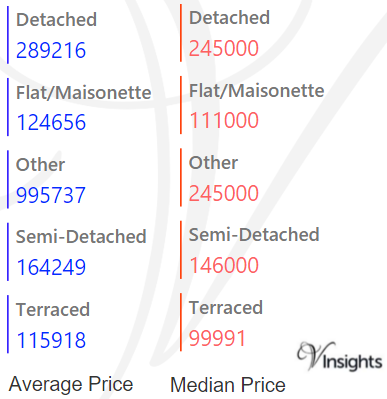
The average sales price in North West England was £184 K.
For the different property types it was
- Detached at £289 K
- Semi-Detached at £164 K
- Terraced at £116 K
- Flat/Maisonette at £125 K
- Other it is at £996 K
Similarly median sales price in North West was £140 K.
For different property types it was
- Detached at £245 K
- Semi-Detached at £146 K
- Terraced at £100 K
- Flat/Maisonette at £111 K
- Other it is at £245 K
Average & Median Sales Price By County
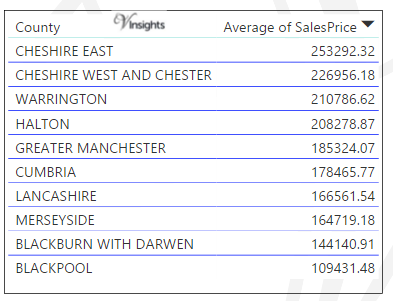
The average sales price in 2015 at county level in North West is as above.
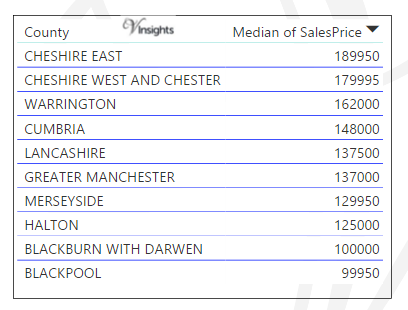
The median sales price in 2015 at county level in North West is as above.
New Vs Not New Property Statistics
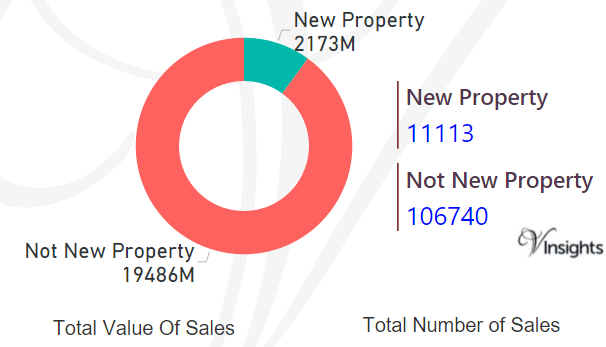
By Total Values Of Sales
- Sales value contributed by New Property was £19.5 billions (13.05%)
- Not New Property contributed £2.2 billions (89.97 %)
By Total Number Of Sales
- New properties sold were 11,113 (9.43%)
- Not new property sold were 106,740 (90.57%)
All England Posts
7785c5d3-5c9f-49b6-9616-aad828d029b0|0|.0|27604f05-86ad-47ef-9e05-950bb762570c
For 2016 details - North East Property Market 2016
Story Highlights
- North East England had total property sales of £7 billions.
- The total number of properties sold in 2015 was 40,669.
- The total sale at county level was maximum for Tyne And Wear at £3.07 Billions
- The average price in North East England was £167 K while median price was £127 K
- The average sales price at county level was maximum for Tyne And Wear at £184K
- The sales value contributed by New Property was 14.46%, for Not New 85.54 %
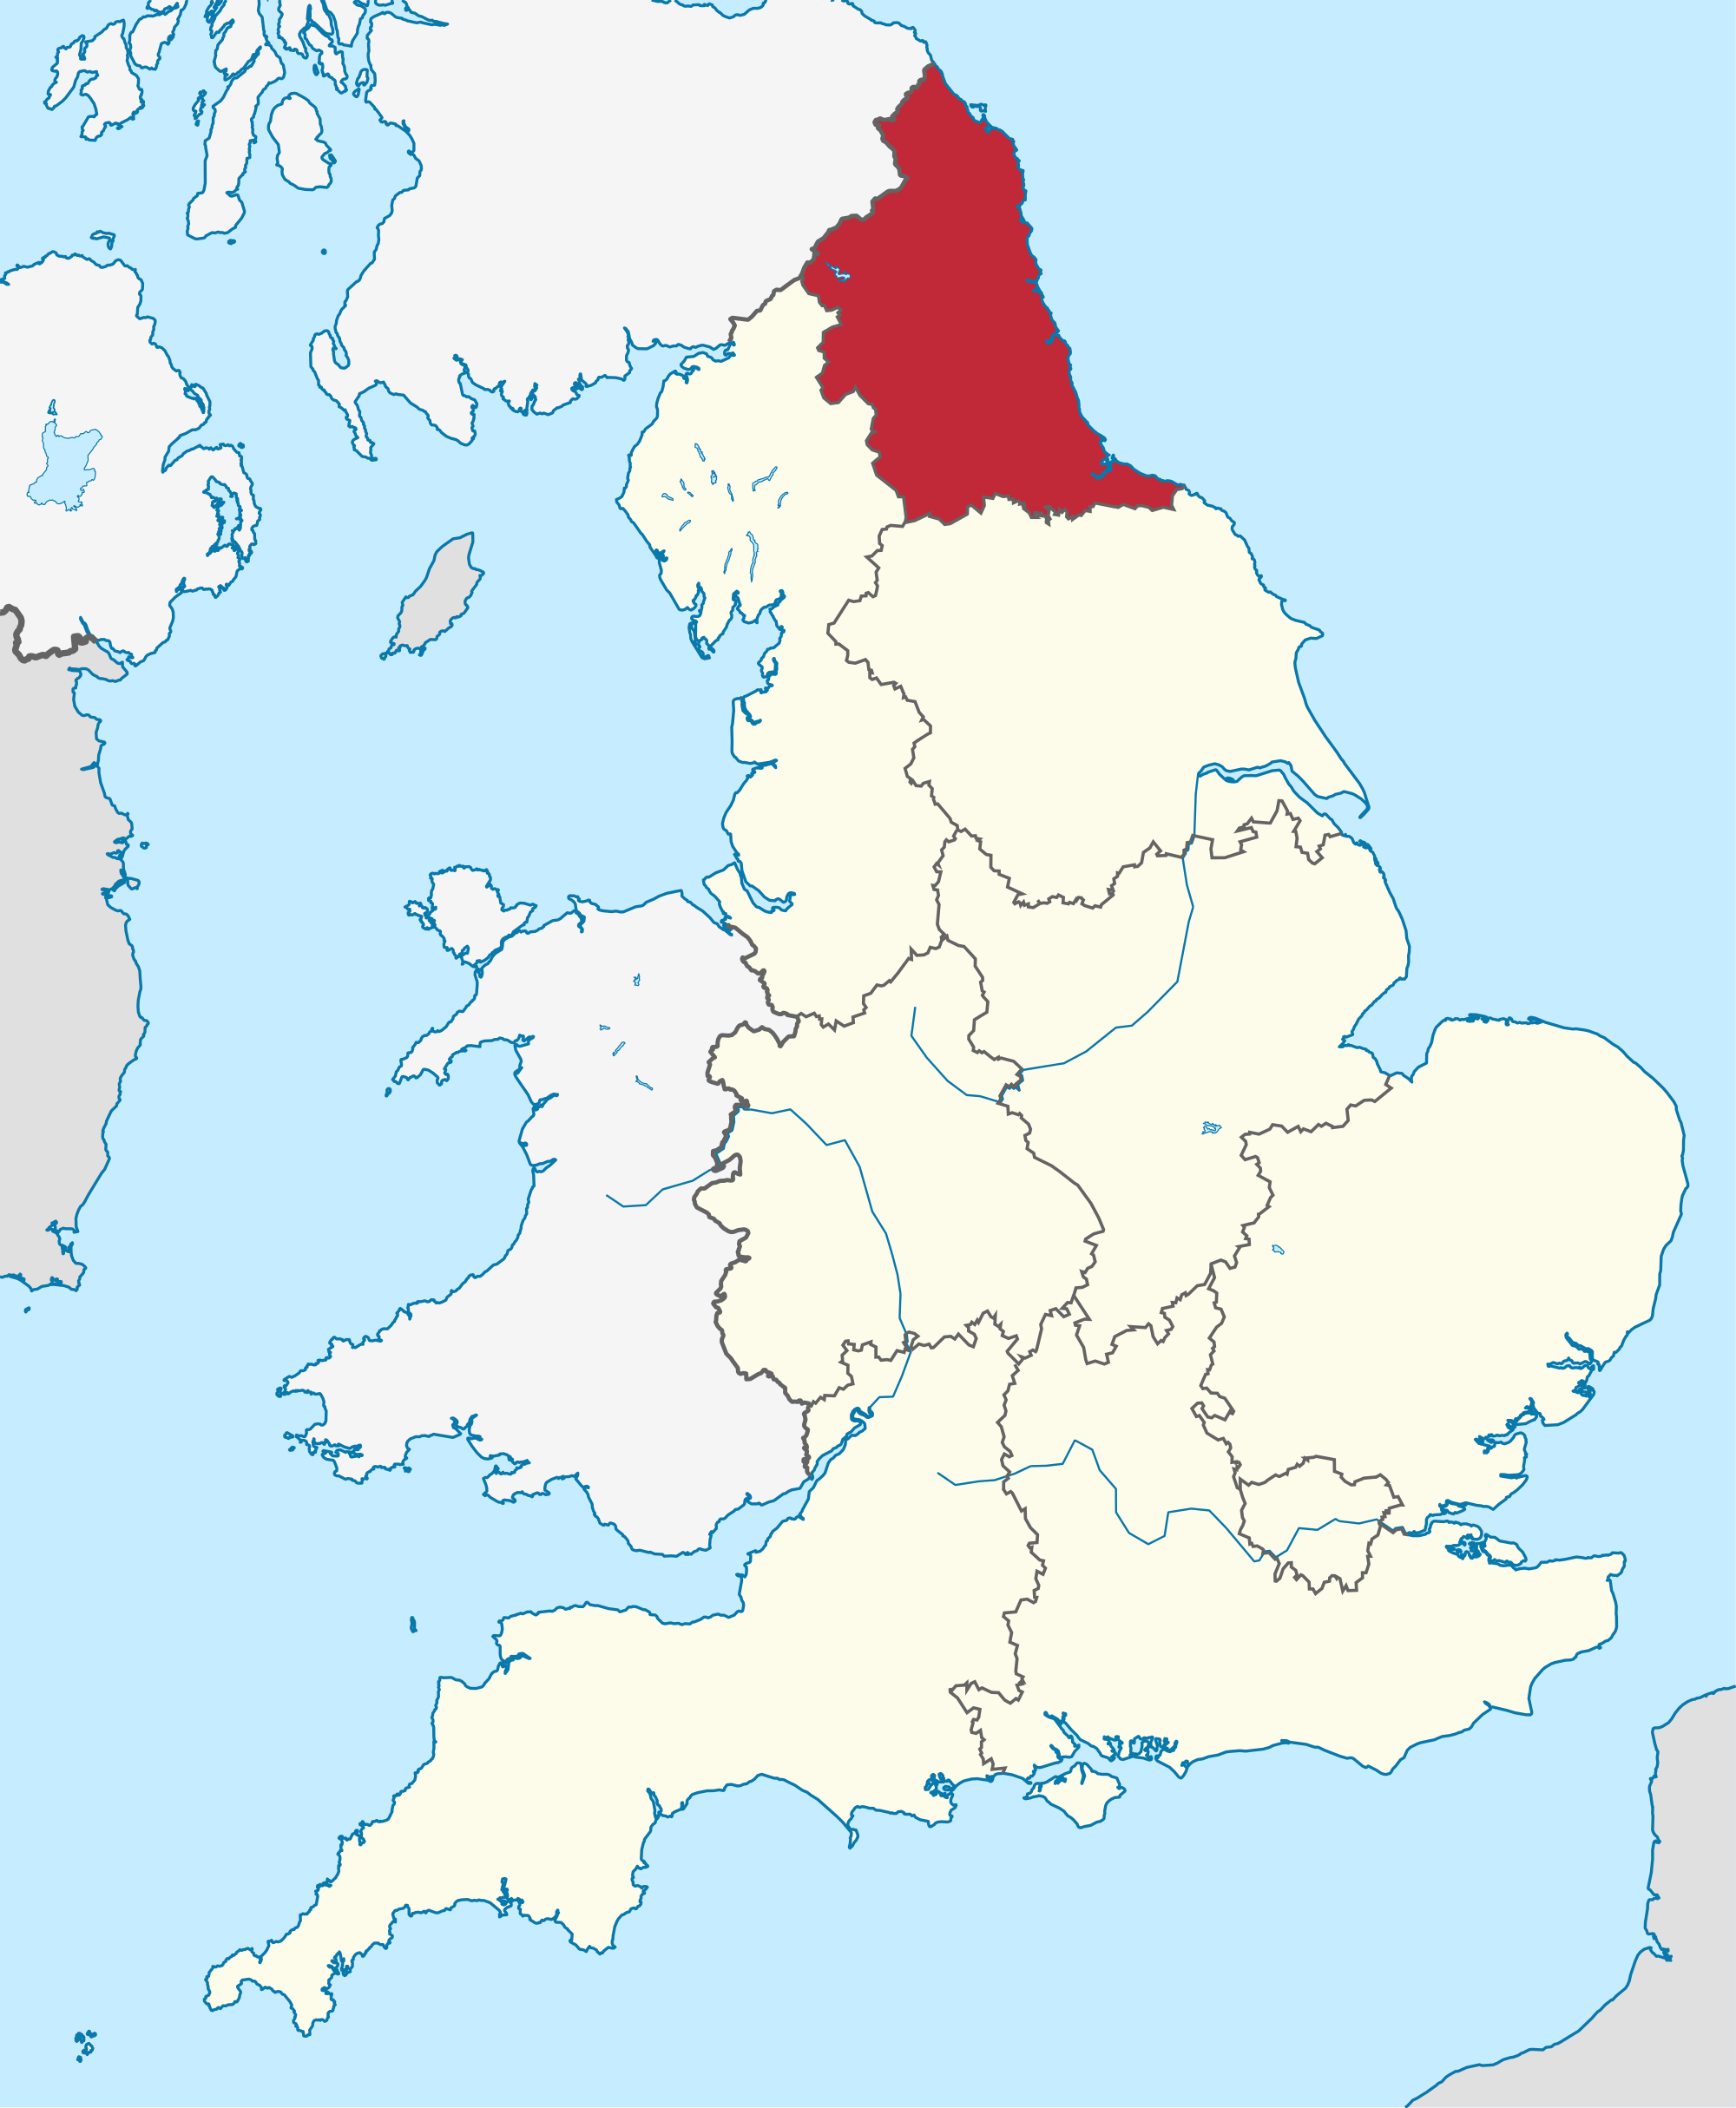
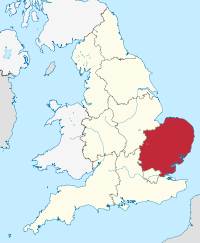
North East England is one of the 9 principal areas of England. It consist of the counties Northumberland, Tyne and Wear, County Durham, Darlington, Hartlepool, Stockton-on-Tees, Redcar and Cleveland, Middlesbrough.
Total Value of Sales By Property Types

North East England had total property sales of £7 billions. It contributed 2.3% of the England Wales Property Market 2015.
The split across the different property types was:
- Detached at £2.09 billions (30.8%)
- Semi-Detached at £1.83 billions (26.91%)
- Terraced at 1.511 billions (22.27%)
- Flat/Maisonette at £454 millions (6.7%)
- Other at 904 millions (13.33%)
Total Sales By County
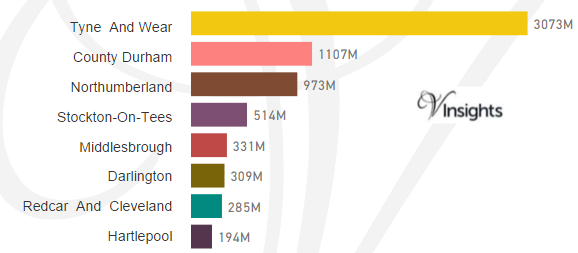
The total sales of £7 Billions in 2015 was split across its counties as above.
Total Number of Sales By Property Types
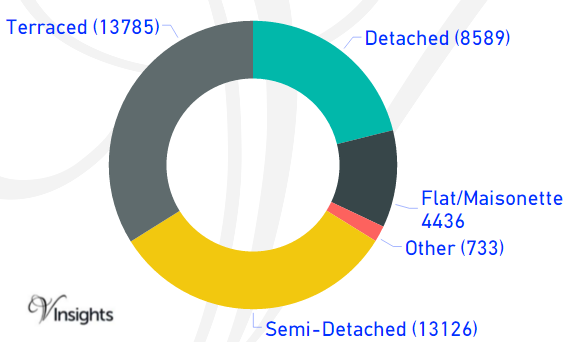
The total property sales of £7 Billions in 2015 was spread over 40,669 properties.
- Terraced properties at 13,785 (33.9%)
- Detached at 8,589 (21.12%),
- Semi-Detached at 13,126 ( 32.28%),
- Flat/Maisonette at 4,436 (10.91%)
- Others at 733 (1.8%).
Average & Median Sales Price
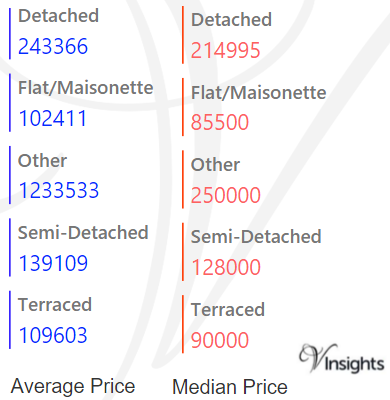
The average sales price in North East England was £167 K.
For the different property types it was
- Detached at £243 K
- Semi-Detached at £139 K
- Terraced at £110 K
- Flat/Maisonette at £102 K
- Other at £1.23 millions.
Similarly median sales price in North East was £127 K.
For the different property types it was
- Detached at £215 K
- Semi-Detached at £128 K
- Terraced at £90 K
- Flat/Maisonette at £85.5 K
- Other at £250 k
Average & Median Sales Price By County
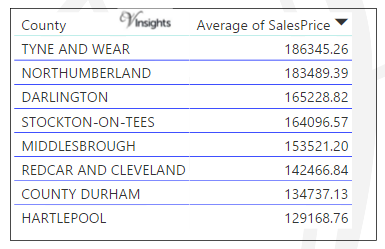
The average sales price in North East in 2015 at county level is as above.
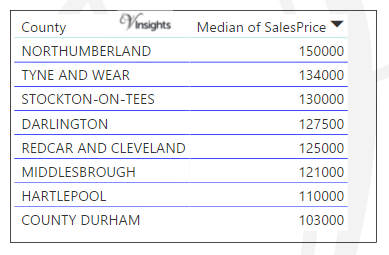
The median sales price in North East in 2015 is as above.
New Vs Not New Property Statistics
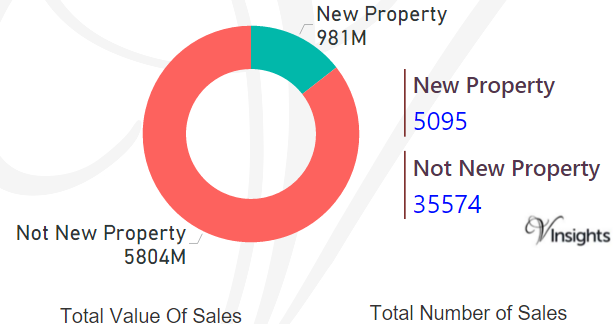
By Value of Sales
- The sales value contributed by New Property was £981 millions (14.46%)
- where as Not New Property contributed £5.80 billions (85.54 %).
By Number of Sales
- New properties sold were 5,095 (12.53%)
- where as not new property sold were 35,574 (87.47%).
All England Posts
8cab46b1-fd51-41cb-bf47-1525625891ec|1|5.0|27604f05-86ad-47ef-9e05-950bb762570c
For 2016 details - East of England Property Market 2016
Story Highlights
- East of England had total property sales of £34 billions in 2015.
- The total number of properties sold in 2015 was 116,856 properties
- The total value of sales was maximum for Hertfordshire at £8.85 Billions
- The average sales price in East of England was £295 K whereas median was £235 K
- The maximum average sales at county level was for Hertfordshire at £411 K
- New Property contributed 10.11% where as Not New Property contributed 89.89 % by value
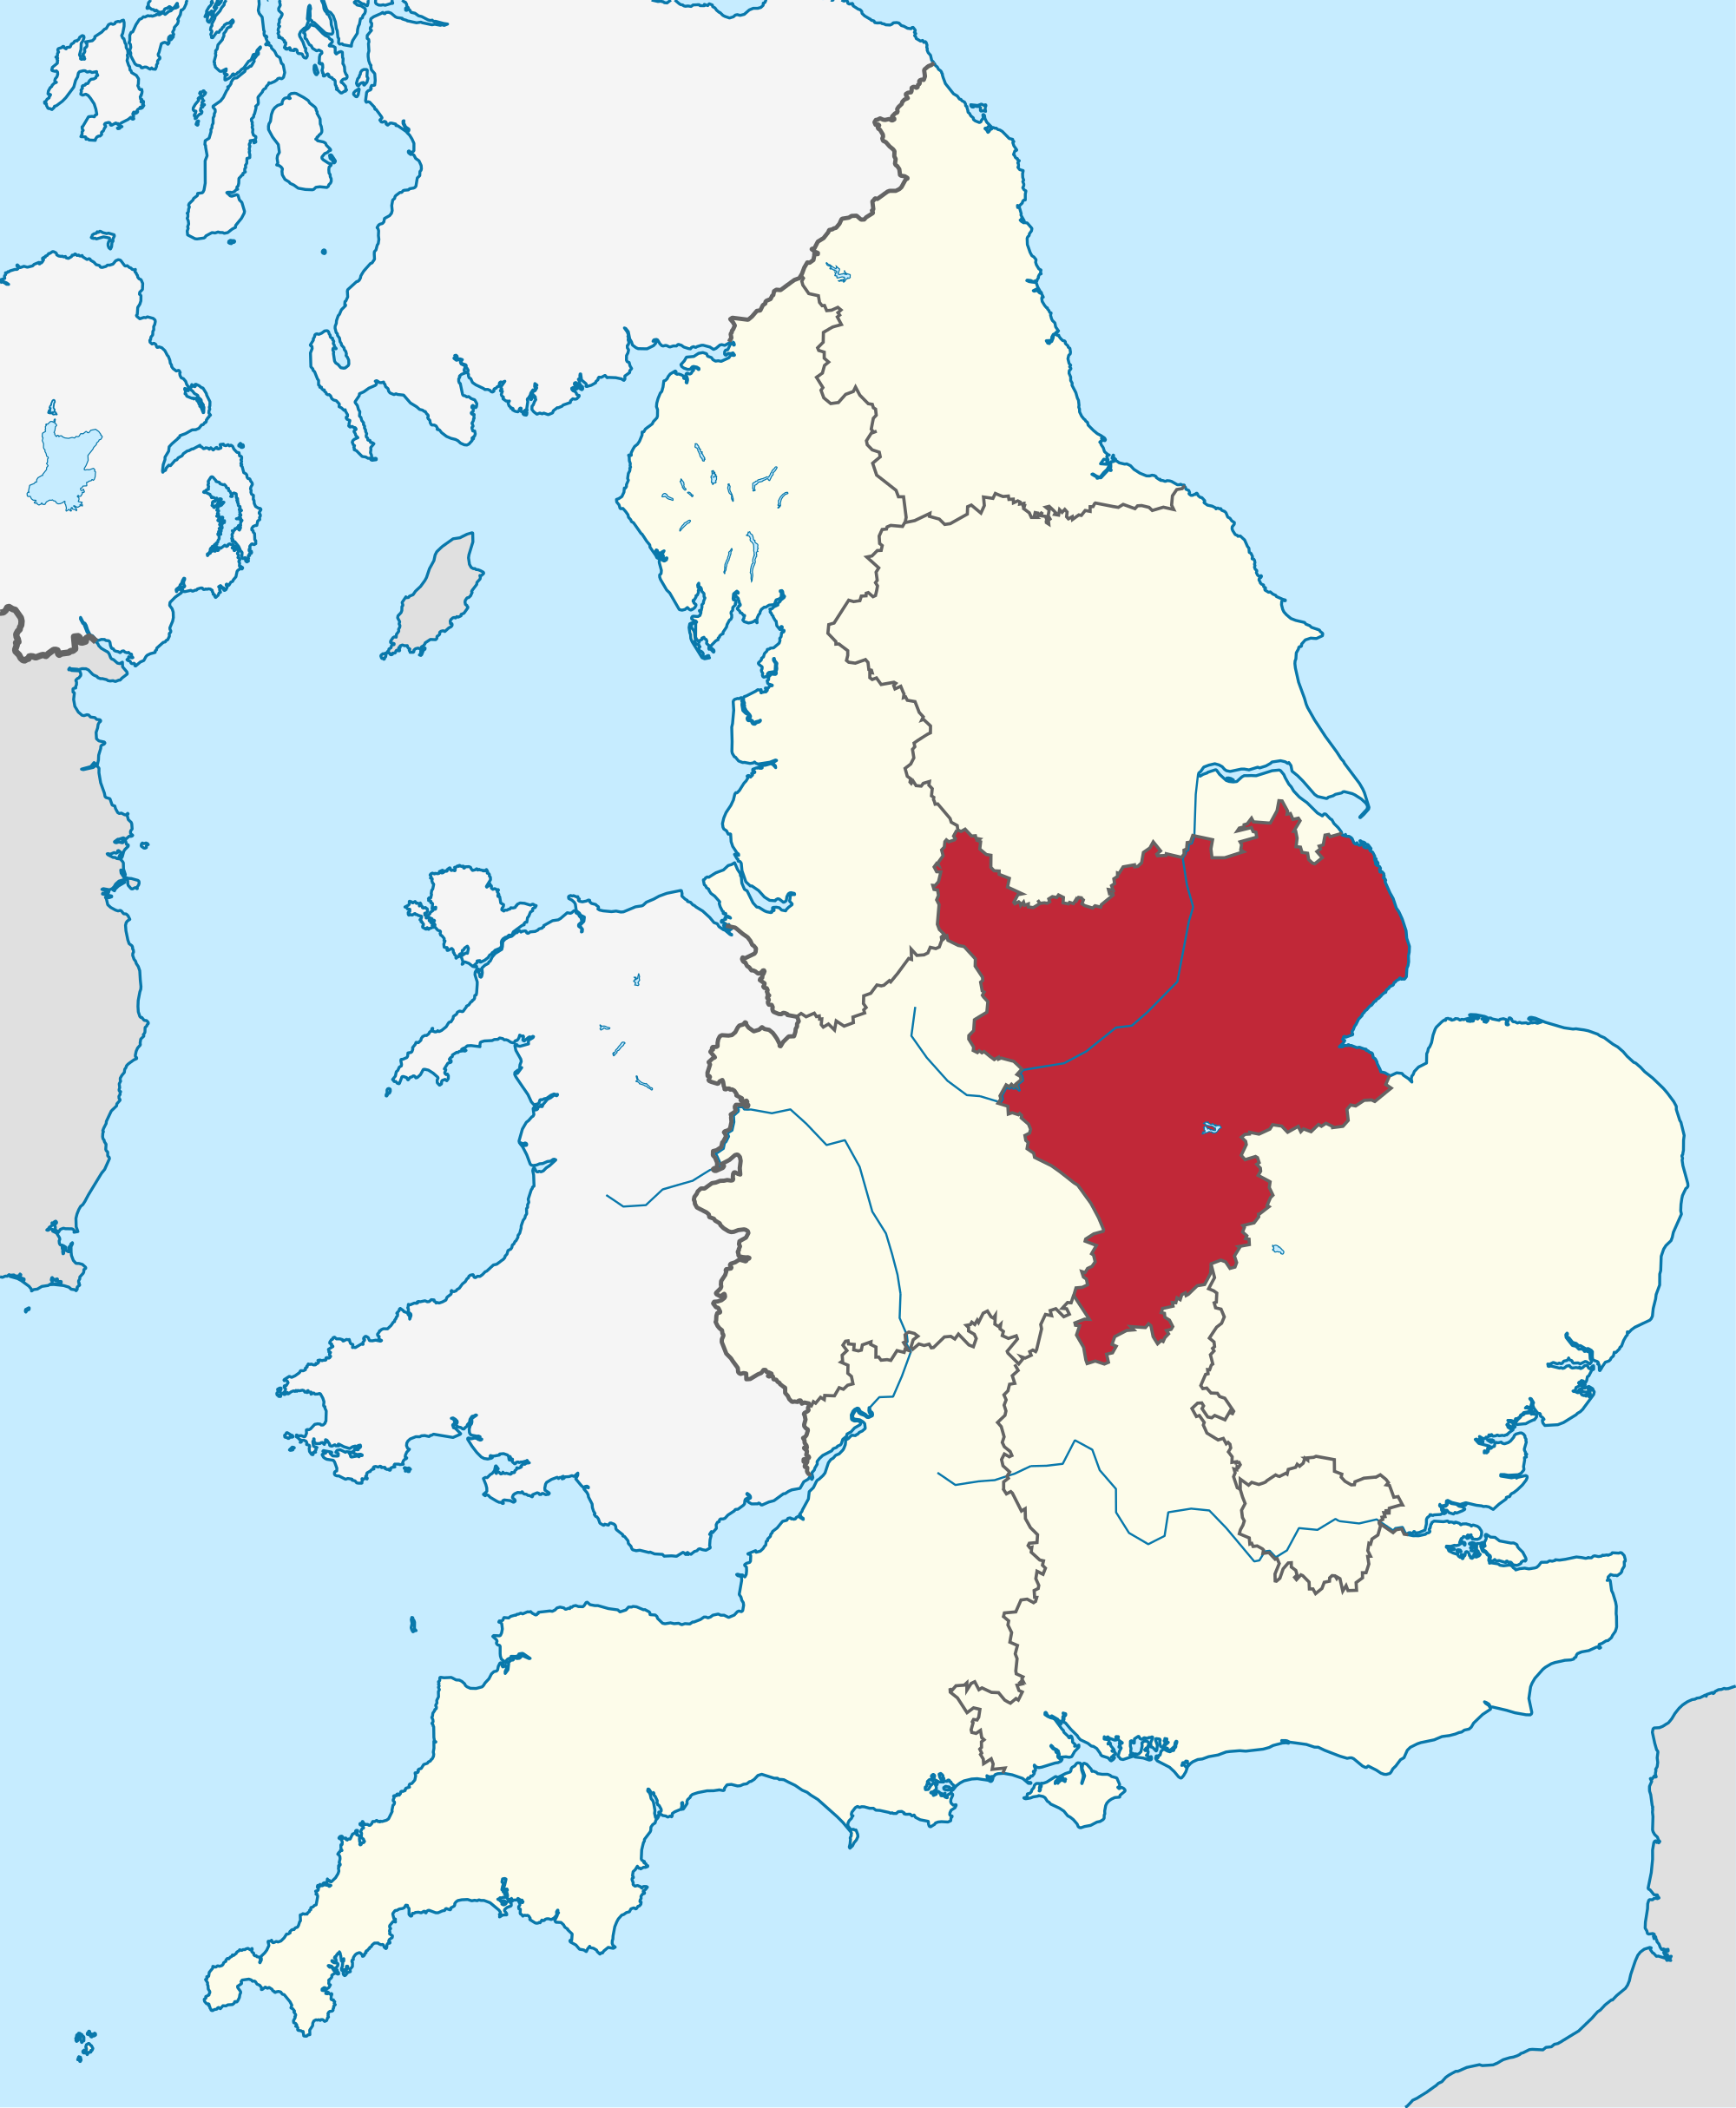
East of England is one of the 9 principal areas of England.
It consists of the counties: Thurrock, Southend-on-Sea, Essex , Hertfordshire, Luton, Bedford, Central Bedfordshire, Cambridgeshire, City Of Peterborough, Norfolk and Suffolk. Essex has the highest population in the region.
Total Value of Sales By Property Types
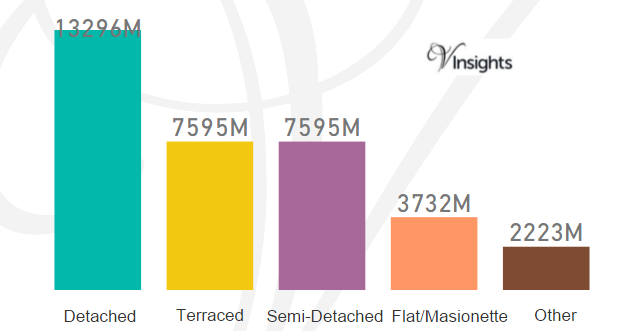
East of England had total property sales of £34 billions.
It contributed 11.67% of the England Wales Property Market 2015.
The split across the different property types are
- Detached at £13.296 billions (38.61%)
- Terraced at £7.6 billions (22.05%)
- Semi-Detached at £7.6 billions (22.05 %)
- Flat/Masionette at £3.73 billions (10.84%)
- Other at £2.22 billions (6.45%).
Total Sales By County
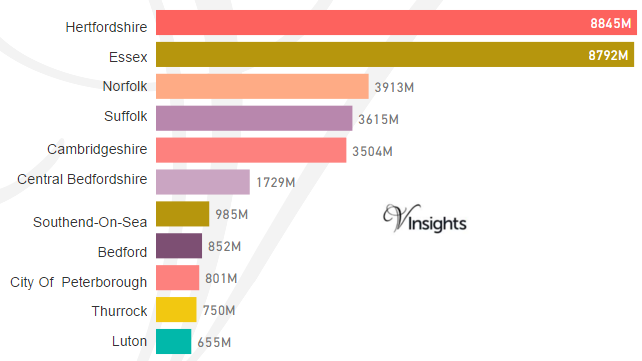
The total sales of £34 Billions in 2015 was split across its counties as above.
Total Number of Sales By Property Types
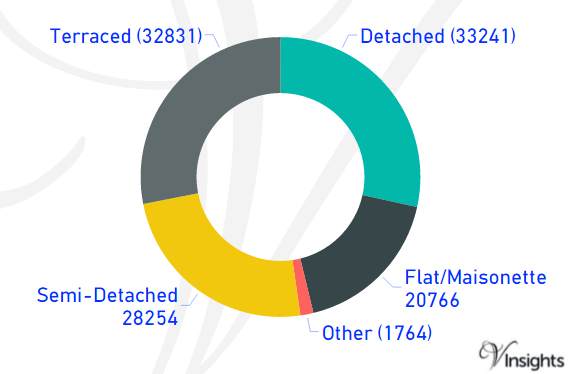
The total property sales of £34 Billions in 2015 was spread over 116,856 properties.
- Terraced properties was 32,831 (28.1%)
- Detached 33,241 (28.45%)
- Semi-Detached 28,254 ( 24.18%),
- Flat/Maisonette 20,766 (17.77%)
- Others 1,764 (1.51%)
Average & Median Sales Price
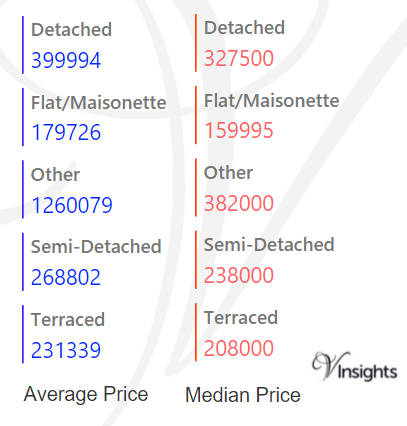
The average sales price in East of England was £295 K. For the different property types it was
- Detached at £400 K,
- Semi-Detached at £269 K,
- Terraced at £231 K,
- Flat/Maisonette at £180 K
- Other it is at £1.26 millions.
Median sales price in East of England was £235 K. For different property types it was
- Detached at £328 K,
- Semi-Detached at £238 K,
- Terraced at £208 K,
- Flat/Maisonette at £160 K
- Other it is at £382 K
Average & Median Sales Price By County
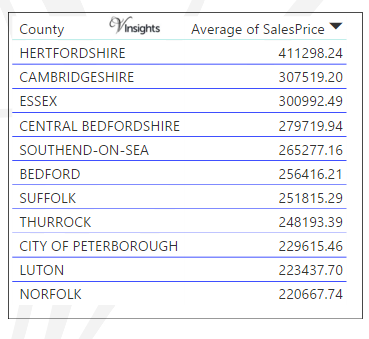
The average of sales price at county level in East Of England in 2015 is as above.
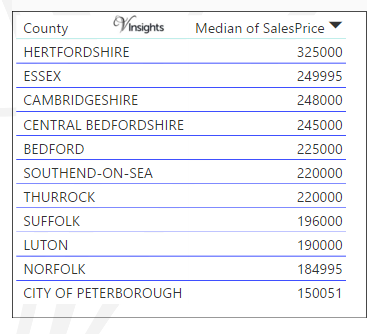
The median of sales price at county level in East Of England in 2015 is as above.
New Vs Not New Property Statistics
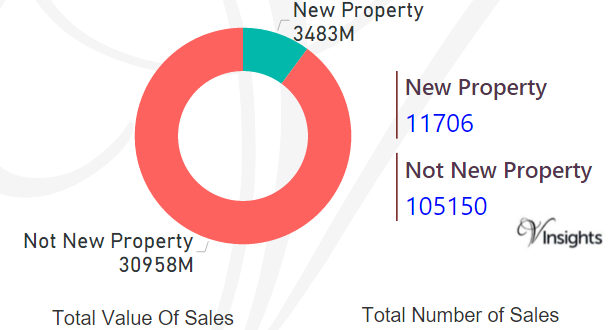
By Value Of Sales
- The sales value contributed by New Property was £3.483 billions (10.11%)
- where as Not New Property contributed £30.96 billions (89.89 %).
By Number Of Sales
- New properties sold were 11,706 (10.02%)
- where as not new property sold were 105,150 (89.98%).
All England Posts
b7d1713c-3222-44a3-8b72-ebf15a52f484|0|.0|27604f05-86ad-47ef-9e05-950bb762570c
For 2016 details - East Midlands Property Market 2016
Story Highlights
- East Midlands in 2015 had total property sales of £17 billions.
- The total number of property sold in East Midlands in 2015 was 85,071
- Across its counties total sales value was maximum at Leicestershire at £3.7 billions.
- The average property price was £197 K and the median was £157 K
- The average sales price at county level is maximum for Rutland at £285 K
- New properties contributed 13.05% by value and not new 86.95%
East Midlands is one of the 9 principal areas of England. It consists of Derbyshire, Nottinghamshire, Lincolnshire, Leicestershire, Rutland, Northamptionshire
Total Value of Sales By Property Types
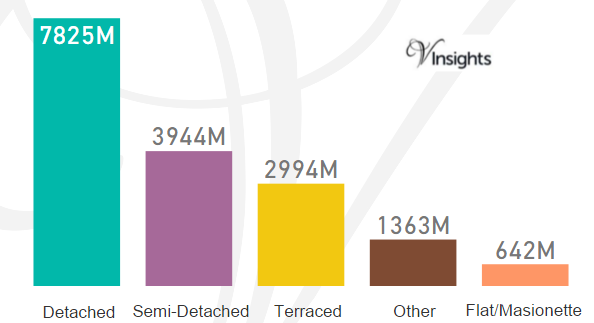
East Midlands in 2015 had total property sales of £17 billions. It is 5.68% of England and Wales Property Market 2015.
The split across the different property types are:
- Detached at £7.83 billions (46.67%)
- Semi-Detached at £3.944 billions (17.86%)
- Terraced at £2.994 billions (17.86 %)
- Other at £1.363 billions (8.13%)
- Flat/Maisonette at £0.64 billions (3.83%)
Total Sales By County
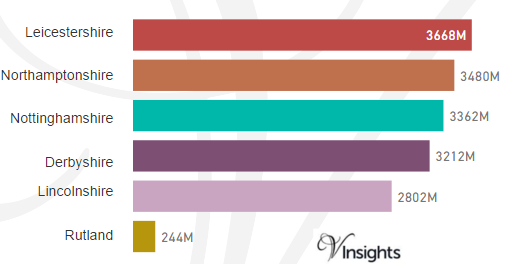
The total sales of £17 Billions in 2015 is split across its counties as above.
Total Number of Sales By Property Types
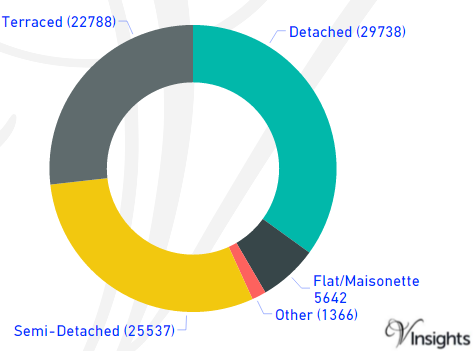
The total number of property sold in East Midlands in 2015 was 85,071.
The split is :
- Detached at 29,738 (34.96%),
- Semi-Detached at 25,537 (30.02%)
- Terraced at 22,788(26.79%)
- Flat/Maisonette at 5,642 (6.63%)
- Other at 1,366(1.61%)
Average & Median Sales Price
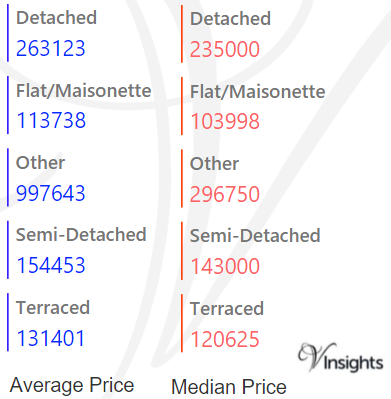
The average sales price in East Midlands was 197 K.
For the different property types it was
- Detached at £263 K
- Semi-Detached at £155 K
- Terraced at £131 K
- Flat/Maisonette at £114 K
- Other it is at £998 K
Similarly the median sales price in East Midlands was 157 K.
For the different property types it was
- Detached at £235 K
- Semi-Detached at £143 K
- Terraced at £121 K
- Flat/Maisonette at £104 K
- Other it is at £297 K
Average & Median Sales Price By County
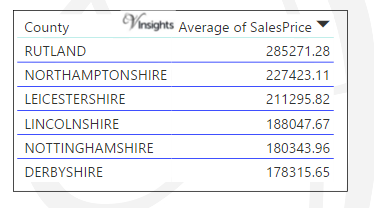
The average of sales price in East Midland at county level in 2015 is :
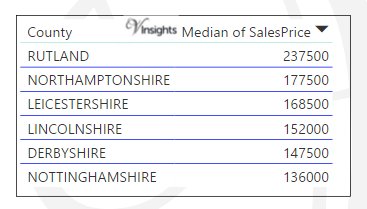
The median of sales price in East Midland at county level in 2015 is :
New Vs Not New Property Statistics
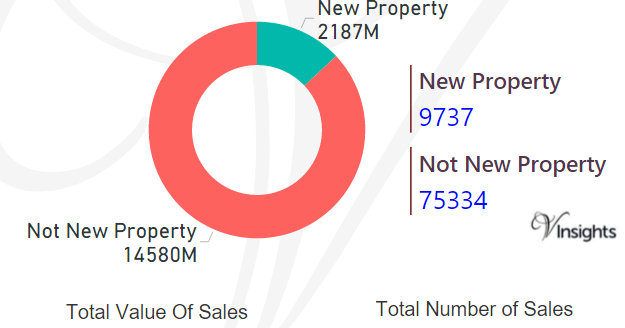
By Sales Value
- Sales value contributed by New Property was £2.187 billions (13.05%)
- where as Not New Property contributed £14.58 billions (86.95%)
By Number Of Sales
- New properties sold were 9,737 (11.54%)
- where as not new property sold were 75,334 (88.55%)
All England Posts
37c9566c-4152-4775-9ab9-975a034f935c|0|.0|27604f05-86ad-47ef-9e05-950bb762570c
For 2016 details - London Property Market 2016
Story Highlights
- London in 2015 had total property sales of £82 billions
- The total number of property sold in London in 2015 was 128,206
- The average sales price in London was £636 K where as median was £399 K
- The sales value contributed by New Property was £8.87 billions (10.87%) where as Not New Property contribute £72.668 billions (89.13 %)
- London Region Distribution in 2015 can be found here.
London or Greater London is the capital and most populous city of England and United Kingdom. It is a region in England and organized into 33 administrative units: the 32 London Boroughs and the City of London.
The 33 boroughs are broadly divided into 5 regions : Central London, East London , North London , South London , West London .
- Central London comprises of Camden, City of London, Westminster, Islington, Kensington & Chelsea, Lambeth and Southwark.
- East London comprises of Barking and Dagenham, Lewisham, Newham, Redbridge, Tower Hamlets, Waltham Forest, Bexley, Greenwich , Hackney, Havering.
- North London comprises of Barnet, Enfield and Haringey.
- South London comprises of Bromley, Croydon, Kingston upon Thames, Merton, Sutton ,Wandsworth.
- West London comprises of Brent, Ealing, Hammersmith & Fulham, Harrow, Hillingdon, Hounslow, Richmond upon Thames.
Total Sales By London Region
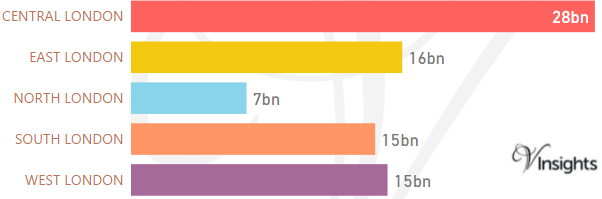
The total property sales in London was approx. £82 billions. It was 27.62% of the England and Wales Property Market 2015.
Region wise Split of London property market 2015 was :
Total Value of Sales By Property Types
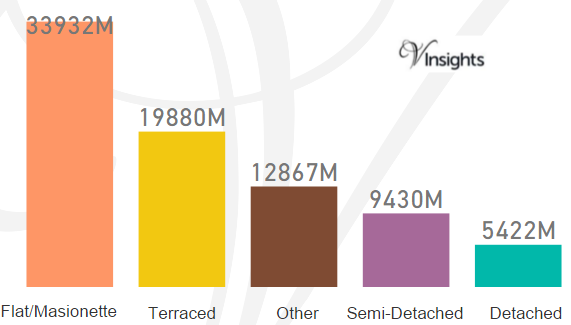
The split of £82 billions across the different property types are:
- Flat/Maisonette £33.9 billions (41.62%)
- Terraced £19.88 billions (24.38 %)
- Other £12.87 billions (15.78%)
- Semi-Detached £9.43 billions (11.57%)
- Detached 5.42 billions (6.65%).
Total Number Of Sales By Property Types
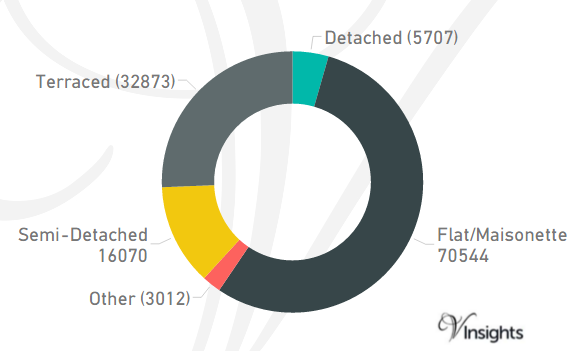
The total number of properties sold in London in 2015 was 128,206. It is split as:
- Flat/Maisonette 70,544 (55.02%)
- Terraced 32,873 (25.64%)
- Semi-Detached 16,070 (12.53%)
- Detached 5,707 (4.45%)
- Other 3012 (2.35%).
Average & Median Sales Price
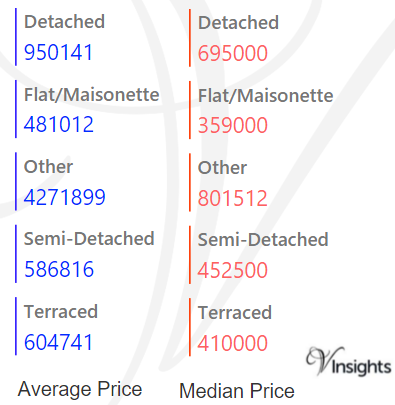
The average sales price in London was £636 K. For the different property types it was:
- Detached £950 K
- Semi-Detached £587 K
- Terraced £605 K
- Flat/Maisonette £481 K
- For Other it is £4.27 millions
Similarly the median sales price in London was £399 K. For the different property types it was:
- Detached £695 K
- Semi-Detached £426 K
- Terraced £410 K
- Flat/Maisonette £359 K
- For Other it is £802 K.
Average & Median Sales Price By London Regions
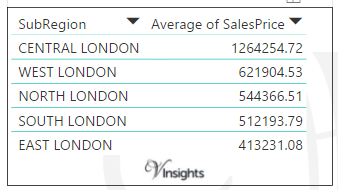
The Average Sales Price By London Regions was
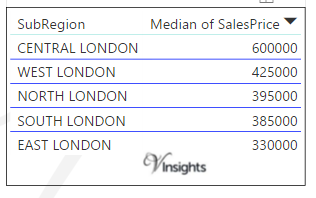
The Median Sales Price By London Regions was
New Vs Not New Property Statistics
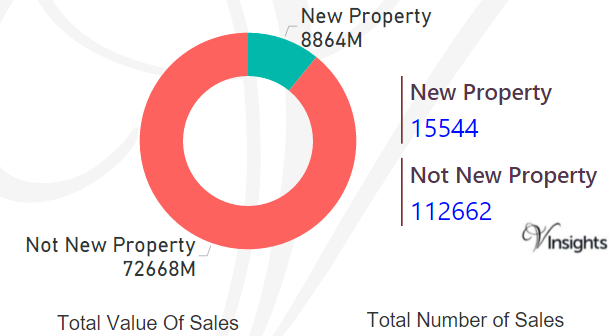
By Value Of Sales
- The sales value contributed by New Property was £8.87 billions (10.87%)
- Not New Property contributed £72.668 billions (89.13 %).
By Number Of Sales
- New properties sold were 15,544 (12.12%)
- where as not new property sold were 112,662 (87.88%).
All London Posts
6abcb189-64d3-4d3c-a56f-e82dce107918|3|5.0|27604f05-86ad-47ef-9e05-950bb762570c