Story Highlights
- Suffolk had total property sales of £3.6 Billions in 2015
- The total number of properties sold in 2015 in Essex was 14,357
- The total volume of sales at district level was maximum for Suffolk Costal at £782 millions
- The average sales price in Suffolk was £252 K whereas median was £196 K
- The average sales price at district level was maximum for St Edmundsbury at £299 K
- Similarly the median of sales price at district level was maximum for Suffolk Coastal at £242 K
- New Property sales in Suffolk contributed 8.29% and Not New Property contributed 91.71%
Suffolk is one of the counties of East England.The districts of Suffolk are Suffolk Coastal, St Edmundsbury, Ipswich, Mid Suffolk, Babergh, Waveney, Forest Heath.
Total Sales By Districts
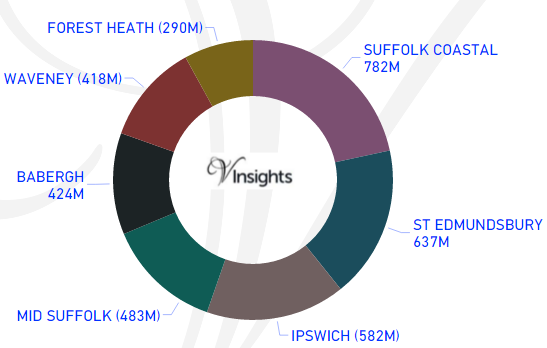
The total sales of £3.6 Billions in 2015 contributed 10.5% of East England Property Market 2015 .
The split across its districts is as follow:
- Suffolk Coastal was maximum at £782 millions (21.62%)
- St Edmundsbury at £637 millions (17.61%)
- Ipswich at £582 millions (16.11%)
- Mid Suffolk at £483 millions (13.36%)
- Babergh at £424 millions (11.73%)
- Waveney at £418 millions (11.56%)
- Forest Heath was minimum at £290 millions (8.01%)
Total Sales By Property Type
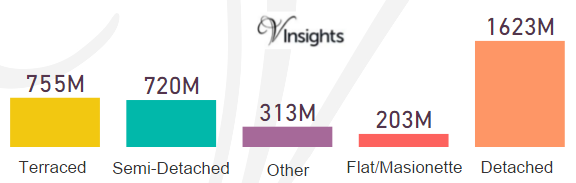
The split of £3.6 Billions across the different property types are :
- Detached at £1.623 Billions (44.9%)
- Terraced at £755 millions (20.89%)
- Semi-Detached at £720 millions (19.93%)
- Flat/Maisonette at £203 millions (5.61%)
- Other at £313 millions (8.67%)
Total No Of Properties Sold By Property Type
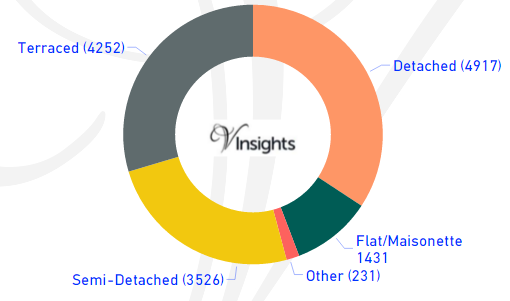
The total property sales of £3.6 Billions in 2015 was spread over 14,357 properties.
- Terraced properties at 4,252 (29.62%)
- Detached at 4,917 (34,25%)
- Semi-Detached at 3,526 (24.56%)
- Flat/Maisonette at 1,431 (9.97%)
- Others at 231 (1.61%).
Average & Median Sales Price
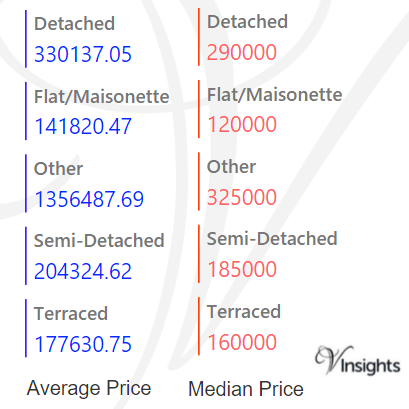
The average sales price in Suffolk was £252 K. For the different property types it was:
- Detached at £330 K
- Semi-Detached at £204 K
- Terraced at £178 K,
- Flat/Maisonette at £142 K
- Other it is at £1.36 millions.
Similarly median sales price in Suffolk was £196 K. For the different property types it was:
- Detached at £290 K
- Semi-Detached at £185 K
- Terraced at £160 K
- Flat/Maisonette at £120 K
- Other it is at £325 K
Average & Median Sales Price By Districts
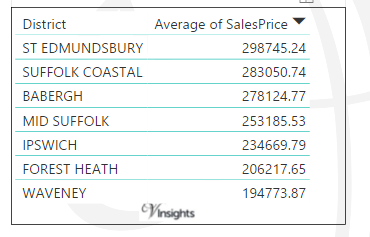
The average of sales prices at district level in Suffolk for 2015 is as follows:
- St Edmundsbury was maximum at £299 K
- Suffolk Coastal at £283 K
- Babergh at £278 K
- Mid Suffolk at £253 K
- Ipswich at £235 K
- Forest Heath at £206 K
- With minimum for Waveney at £195 K
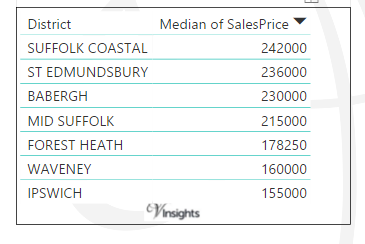
The average of median prices at district level in Suffolk for 2015 is as follows.
- Suffolk Coastal was maximum at £242 K
- St Edmundsbury at £236 K
- Babergh at £230 K
- Mid Suffolk at £215 K
- Forest Heath at £178 K
- Waveney at £160 K
- With minimum for Ipswich at £155 K
New Vs Not New Property Statistics
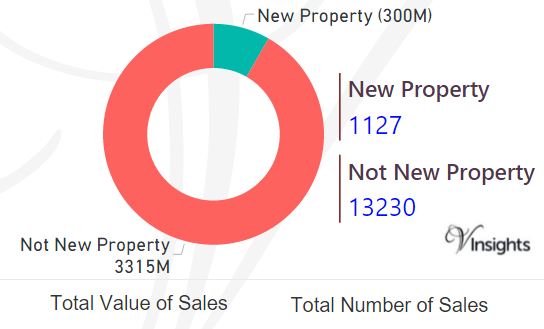
By Sales Values the split is as follows:
- New Properties contributed £300 millions (8.29%)
- Not New Property contributed £3.32 billions (91.71%)
By Total Number the split is as follows:
- New properties sold were 1,127 (7.85%)
- Not new property sold were 13,230 (92.15%)
All England Posts
f5cce71f-c3e1-4fe6-ad39-29db13cc70ca|0|.0|27604f05-86ad-47ef-9e05-950bb762570c