13. October 2016 19:34
/
VInsights Team
/
Wales
/
Comments (0)
Story Highlights
- Flintshire in 2015 had total property sales of about £445 millions
- In 2015 the total number of property sold in Flintshire was 2481
- The average properties price sold in Flintshire 2015 was maximum for Detached £226 K (excluding others).
- The median price was maximum for Detached £215 K (excluding others).
- New Property Sales Values was about £95 millions (21.23%) & Not New Property Sales Value was £351 millions (78.77%).
- Total number of new property sold was 443 (17.86%) & Number of Not New Property Sales was 2038 (82.14%)
Total Value of Sales By Property Types
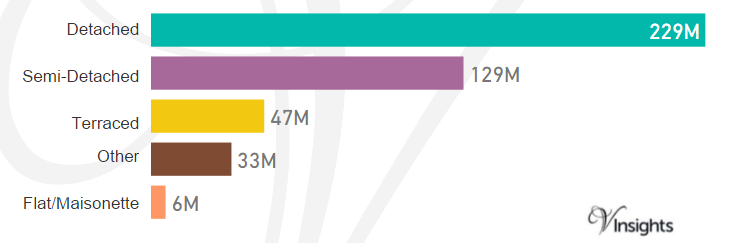
Flintshire in 2015 had total property sales of about £445 millions. When split over different property types it is:
- Detached £229 millions (51.51%)
- Semi-Detached £129 millions (29.05%)
- Terraced £47 millions (10.55%)
- Other £33 millions (7.5%)
- Flat/Maisonette £6 millions (1.38%)
Total Number Of Properties Sold By Property Type
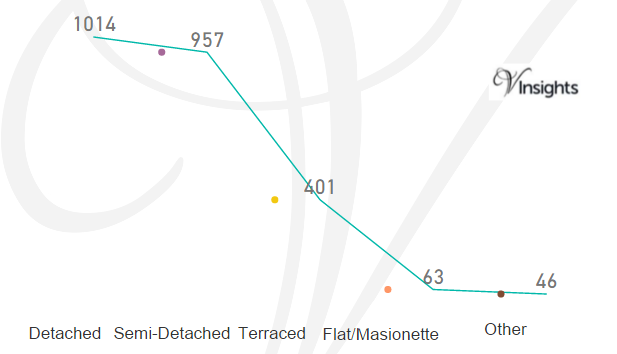
In 2015 the total number of property sold in Flintshire was 2481. The market share for the different property type are:
- Detached 1014 (40.87%)
- Semi-Detached 957 (38.57%)
- Terraced 401 (16.16%)
- Flat/Maisonette 63 (2.54%)
- Other 46 (1.85%)
Average & Median Sales Price
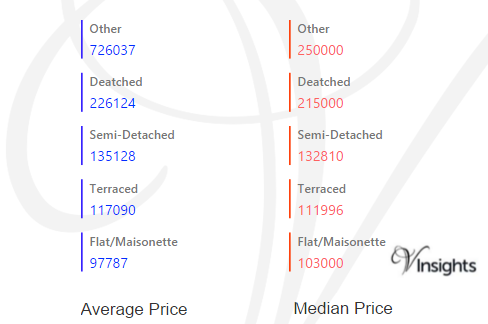
The average price for different type of properties sold in Flintshire 2015 are:
- Other £726 K
- Detached £226 K
- Semi-Detached £135 K
- Terraced £117 K
- Flat/Maisonette £98 k
The median price for different type of properties sold in Flintshire 2015 are:
- Other £250 k
- Detached £215 K
- Semi-Detached £133 K
- Terraced £112K
- Flat/Maisonette £103 k
New Vs Not New Property Statistics
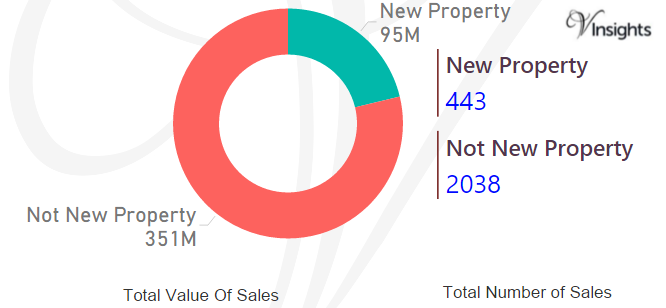
By Value Of Sales
- New Property was about £95 millions (21.23%)
- Not New Property Sales Value was £351 millions (78.77%) giving total of £445 millions.
By Number Of Sales
- Total number of new property sold was 443 (17.86%)
- Number of Not New Property Sales was 2038 (82.14%)
All Posts on North Wales

d5d7bdfd-3eb5-4bba-a72b-71cc2f42cb43|0|.0|27604f05-86ad-47ef-9e05-950bb762570c
13. October 2016 19:23
/
VInsights Team
/
Wales
/
Comments (0)
Story Highlights
- Newport in 2015 had total property sales of about £449 millions
- In 2015 the total number of property sold in Newport was 2554.
- The average price in Newport 2015 was maximum for Detached £257 K, while the median for Detached was £240 K.
- New Property Sales Values was about £108 millions (24.05%) & Not New Property Sales Value was £341 millions (75.95%).
- Number of new property sold was 557 (21.81%) & Number of Not New Property Sales was 1997 (78.19%).
Total Value of Sales By Property Types
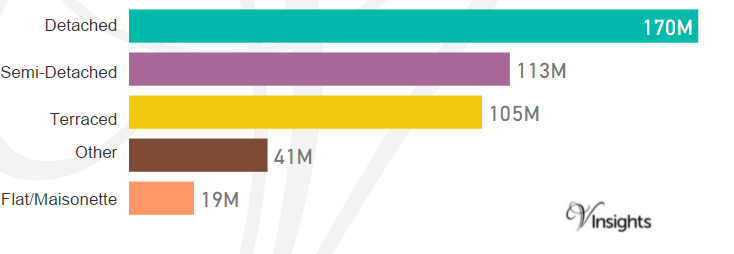
Newport in 2015 had total property sales of about £449 millions. When split over different property types it is:
- Detached £170 millions (37.76%)
- Semi-Detached £113 millions (25.27%)
- Terraced £105 millions (23.43%)
- Other £41 millions (9.21%)
- Flat/Maisonette £19 millions (4.33%)
Total Number Of Properties Sold By Property Type
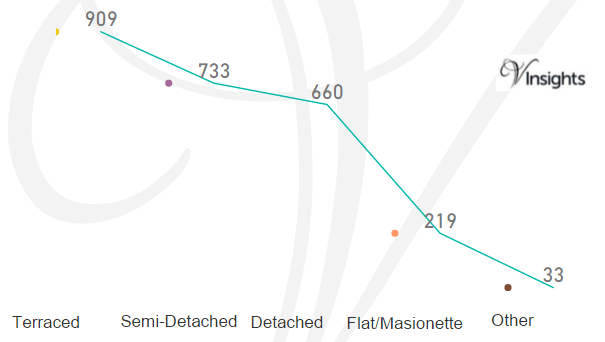
In 2015 the total number of property sold in Newport was 2554. The market share for the different property type are:
- Terraced 909 (35.59%)
- Semi-Detached 733 (28.7%)
- Detached 660 (25.84%)
- Flat/Maisonette 219 (8.57%)
- Other 33 (1.29%)
Average & Median Sales Price
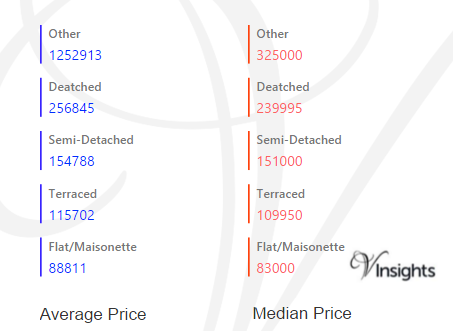
The average price for different type of properties sold in Newport 2015 are:
- Other £125 k
- Detached £257 K
- Semi-Detached £155 K
- Terraced £116 K
- Flat/Maisonette £89 k
The median price for different type of properties sold in Newport 2015 are:
- Other £325 k
- Detached £240 K
- Semi-Detached £151 K
- Terraced £110 K
- Flat/Maisonette £83 k
New Vs Not New Property Statistics
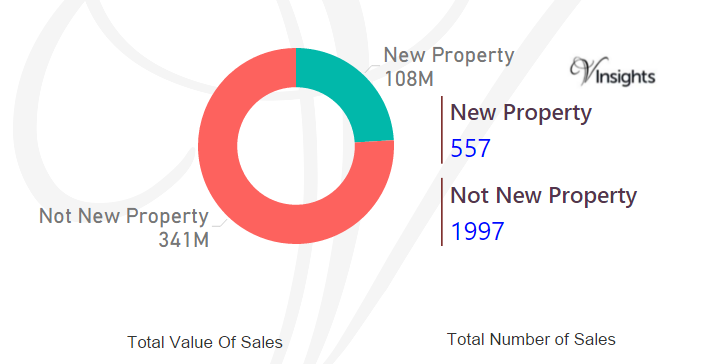
By Value Of Sales
- New Property Sales Values was about £108 millions (24.05%)
- Not New Property Sales Value was £341 millions (75.95%) giving Newport Total Sales Value of £449 millions
By Number Of Sales
- Number of new property sold was 557 (21.81%)
- Number of Not New Property Sales was 1997 (78.19%) giving total of 2554
All Posts on South Wales
17a10a71-85e4-4b12-a5e4-7750d60bc6cc|0|.0|27604f05-86ad-47ef-9e05-950bb762570c
13. October 2016 18:35
/
VInsights Team
/
Wales
/
Comments (0)
Story Highlights
- Monmouthshire in 2015 had total property sales of about £462 millions.
- The total number of property sold was 1543.
- The average price was maximum for Detached £315 K, while median was £279 K (excluding others).
- New Property Sales Values was about £34 millions (7.28%) & Not New Property Sales Value was £428 millions (92.72%)
- The number of new property sold was 111 (7.19%) & Number of Not New Property Sales was 1432 (92.81%).
Total Sales Value By Property Types
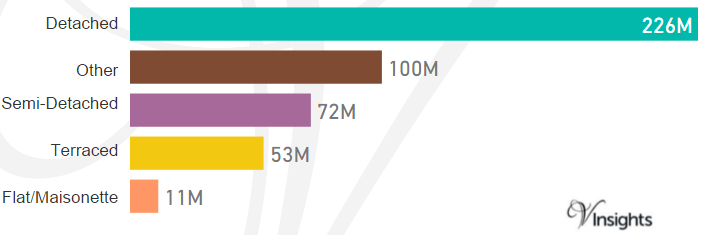
Monmouthshire in 2015 had total property sales of about £462 millions. When split over different property types it is:
- Detached £226 millions (48.81%)
- Other £100 millions (21.66%)
- Semi-Detached £72 millions (15,56%)
- Terraced £53 millions (11.5%)
- Flat/Maisonette £11 millions (2.46%)
Total No Of Properties Sold By Property Type
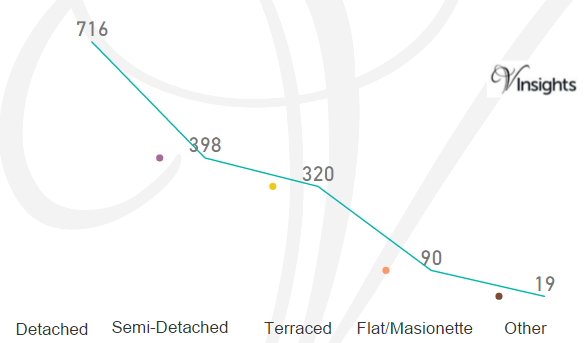
In 2015 the total number of properties sold in Monmouthshire was 1543. The market share for the different property type are:
- Detached 716 (46.4%)
- Semi-Detached 398 (25.79%)
- Terraced 320 (20.74%)
- Flat/Maisonette 90 (5.83%)
- Other 19 (1.23%)
Average & Median Sales Price

The average price for different type of properties sold in Monmouthshire 2015 are:
- Other £527 K
- Detached £315 K
- Semi-Detached £181 K
- Terraced £166 K
- Flat/Maisonette £126 k
The median price for different type of properties sold in Monmouthshire 2015 are:
- Other £665 k
- Detached £279 K
- Semi-Detached £169 K
- Terraced £149 K
- Flat/Maisonette £114 k
New Vs Not New Property Statistics
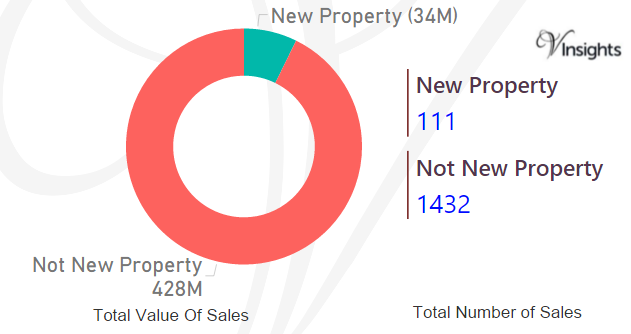
By Value Of Sales
- New Property Sales Values was about £34 millions (7.28%)
- Not New Property Sales Value was £428 millions (92.72%) giving total of £462 millions.
By Number Of Sales
- New property sold was 111 (7.19%)
- Number of Not New Property Sales was 1432 (92.81%) giving total of 1543.
All Posts on South Wales
a7109701-ed37-4c30-8288-e8d101fcfa29|0|.0|27604f05-86ad-47ef-9e05-950bb762570c
13. October 2016 18:23
/
VInsights Team
/
Wales
/
Comments (0)
Story Highlights
- Rhondda Cynon Taff in 2015 had total property sales of about £466 millions .
- The total number of property sold was 3826.
- The average price was maximum for Detached £213 K and the median for Detached was £208 K (excluding Others).
- New Property Sales Values was about £86 millions (18.4%) & Not New Property Sales Value was £380 millions (81.6%).
- Number of new property sold was 456 (11.92%) & Number of Not New Property Sales was 3370 (88.08%).
Total Value of Sales By Property Types
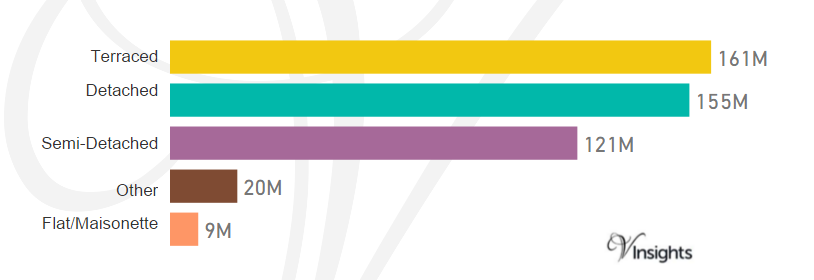
Rhondda Cynon Taff in 2015 had total property sales of about £466 millions . When split over different property types it is:
- Terraced £161 millions (34.59%)
- Detached £155 millions (33.21%)
- Semi-Detached £121 millions (26.05%)
- Other £20 millions (4.32%)
- Flat/Maisonette £9 millions (1.83%)
Total Number Of Properties Sold By Type
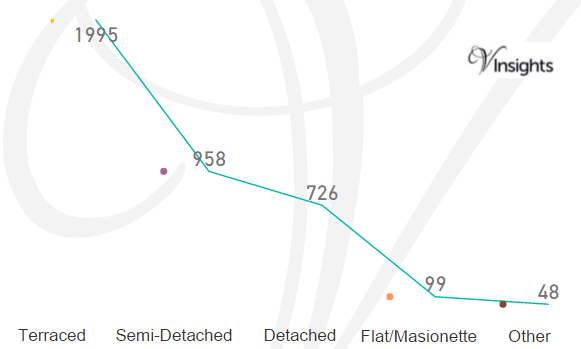
In 2015 the total number of property sold in Rhondda Cynon Taff was 3826. The market share for the different property type are:
- Terraced 1995 (52.14%)
- Semi-Detached 958 (25.04%)
- Detached 726 (18.98%)
- Flat/Maisonette 99 (2.59%)
- Other 48 (1.25%)
Average & Median Sales Price
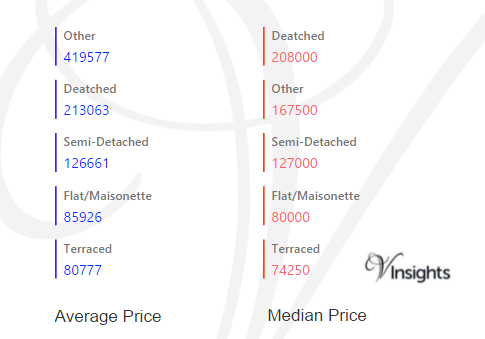
The average price for different type of properties sold in Rhondda Cynon Taff 2015 are:
- Other £420 K
- Detached £213 K
- Semi-Detached £127 K
- Flat/Maisonette £86 k
- Terraced £81 k
The median price for different type of properties sold in Rhondda Cynon Taff 2015 are:
- Other £168 K
- Detached £208 K
- Semi-Detached £127 K
- Flat/Maisonette £80 k
- Terraced £74 k
New Vs Not New Property Statistics
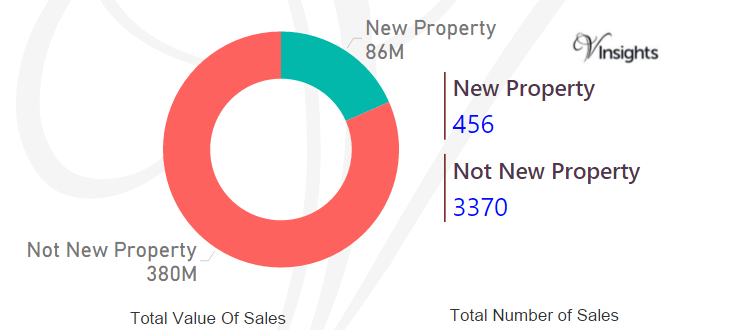
By Value Of Sales
- New Property Sales Values was about £86 millions (18.4%)
- Not New Property Sales Value was £380 millions (81.6%) giving total of £466 millions
By Number Of Sales
- New property sold was 456 (11.92%)
- Number of Not New Property Sales was 3370 (88.08%) giving combined total of 3826
All Posts on South Wales
a187f2a5-ee68-436f-9d2a-f0333596ff64|0|.0|27604f05-86ad-47ef-9e05-950bb762570c
13. October 2016 18:10
/
VInsights Team
/
Wales
/
Comments (0)
Story Highlights
- Vale Of Glamorgan in 2015 had total property sales of about £573 millions.
- In 2015 the total number of property sold in Vale Of Glamorgan was 2431
- The average price in Vale Of Glamorgan 2015 was maximum for Detached £340 K, while median for detached was £295 K (excluding others)
- New Property Sales Values was about £89 millions (15.53%) & Not New Property Sales Value was £484 millions (84.47%).
- Total Number Of Property Sales in Vale Of Glamorgan was 2431 of which number of new property sold was 398 (16.37%) & Number of Not New Property Sales was 2033 (83.62%).
Total Sales Value By Property Types
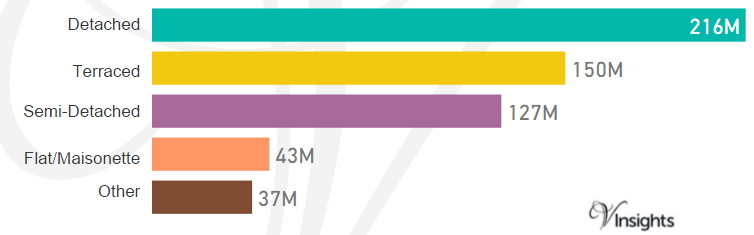
Vale Of Glamorgan in 2015 had total property sales of about £573 millions . When split over different property types it is:
- Detached £216 millions (37.7%)
- Terraced £150 millions (26.26%)
- Semi-Detached £127 millions (22.19%)
- Flat/Maisonette £43 millions (7.47%)
- Others £37 millions (6.38 %)
Total No Of Properties Sold By Property Type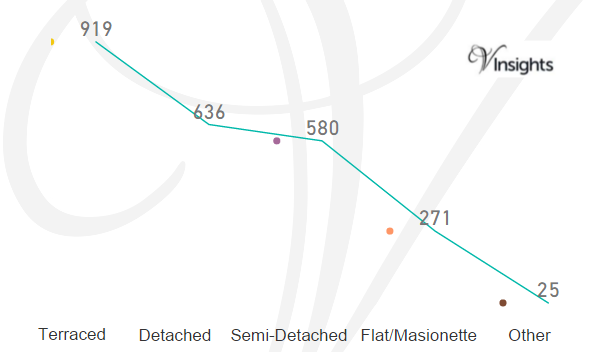
In 2015 the total number of property sold in Vale Of Glamorgan was 2431. The market share for the different property type are:
- Terraced 919 (37.8%)
- Detached 636 (26.16%)
- Semi-Detached 580 (23.86%)
- Flat/Maisonette 271 (11.15%)
- Other 25 (1.03%)
Average & Median Sales Price
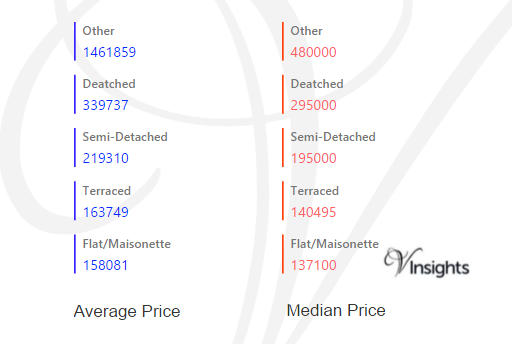
The average price for different type of properties sold in Vale Of Glamorgan 2015 are:
- Other £1.46 million
- Detached £340 K
- Semi-Detached £219 K
- Terraced £164 k
- Flat/Maisonette £158 k
The median price for different type of properties sold in Vale Of Glamorgan 2015 are:
- Other £480 K
- Detached £295 K
- Semi-Detached £195 K
- Terraced £141 k
- Flat/Maisonette £137 K
New Vs Not New Property Statistics
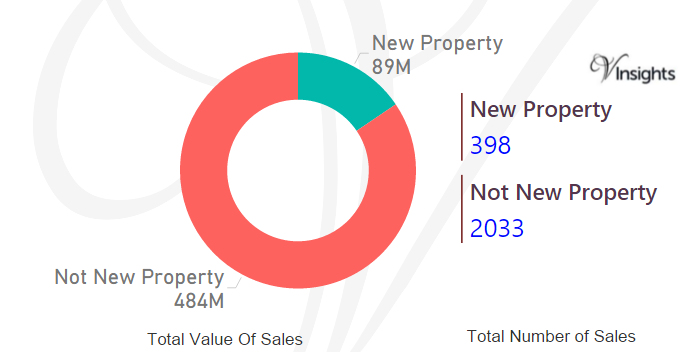
By Value Of Sales
- New Property Sales Values was about £89 millions (15.53%)
- Not New Property Sales Value was £484 millions (84.47%) giving total sales of £573 millions
By Number Of Sales
- Number of new property sold was 398 (16.37%)
- Number of Not New Property Sales was 2033 (83.62%) giving combined total of 2431.
All Posts on South Wales
3ca57455-0e18-4497-bfc7-04759e3b14ac|0|.0|27604f05-86ad-47ef-9e05-950bb762570c