Story Highlights
- Derbyshire had total property sales of £3.2 Billions in 2015.
- The total number of properties sold in 2015 in Derbyshire was 18,014
- The total volume of sales at district level was maximum for City Of Derby at £662 millions
- The average sales price in Derbyshire was £178 K, whereas median was £148 K
- The average sales price at district level was maximum for Derbyshire Dales at £272 K
- The median sales price at district level was also maximum for Derbyshire Dales at £226 K
- New Property sales in Derbyshire contributed 11.22% and Not New Property contributed 88.78%
Derbyshire is one of the counties of East Midlands. The districts of Derbyshire are City Of Derby, Amber Valley, South Derbyshire, Erewash, Derbyshire Dales, High Peak, North East Derbyshire, Chesterfield, Bolsover.
Total Sales By Districts
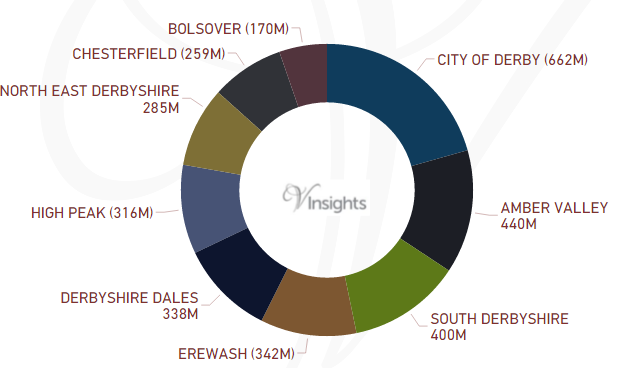
Derbyshire had total property sales of £3.2 Billions which was 19.16% of the East Midland Property Market 2015.
The split across its districts is as follows:
- City Of Derby at £662 millions (20.61%)
- Amber Valley at £440 millions (13.69%)
- South Derbyshire at £400 millions (12.45%)
- Erewash at £342 millions (10.64%)
- Derbyshire Dales at £338 millions (10.52%)
- High Peak at £316 millions (9.85%)
- North East Derbyshire at £285 millions (8.87%)
- Chesterfield at £259 millions (8.08%)
- Bolsover at £170 millions (5.28%)
Total Sales By Property Type
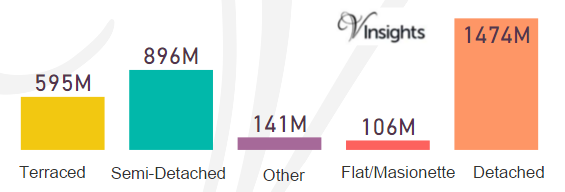
The split of £3.2 Billions across the different property types in Derbyshire are :
- Detached at £1.5 billions (45.9%)
- Semi-Detached at £896 millions (27.91%)
- Terraced at £595 millions (18.51%)
- Flat/Maisonette at £106 millions (3.3%)
- Other at £141 millions (4.38%)
Total No Of Properties Sold By Property Type
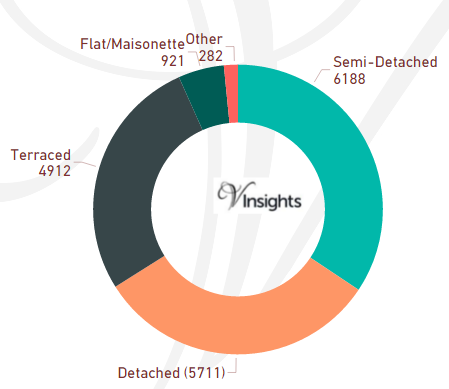
The total property sales of £3.2 Billions in 2015 was spread over 18,014 properties.
- Detached at 5711 (31.7%)
- Semi-Detached at 6188 (34.35%)
- Terraced properties at 4912 (27.27%)
- Flat/Maisonette at 921 (5.11%)
- Others at 282 (1.57%)
Average & Median Sales Price
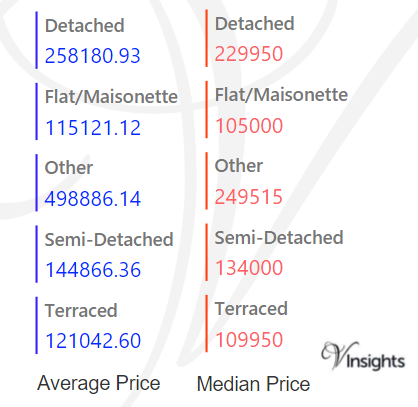
The average sales price in Derbyshire was £178 K. For the different property types it was:
- Detached at £258 K
- Semi-Detached at £145 K
- Terraced at £121 K
- Flat/Maisonette at £115 K
- Other at £499 K
Similarly median sales price in Derbyshire was £148 K. For different property types it was:
- Detached at £230 K
- Semi-Detached at £134 K
- Terraced at £110 K
- Flat/Maisonette at £105 K
- Other at £250 K
Average & Median Sales Price By Districts
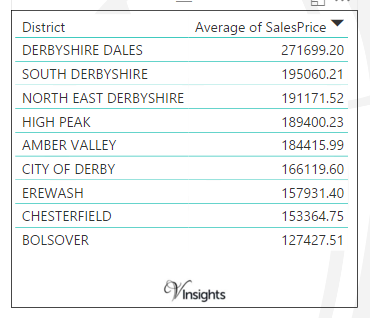
The average sales prices at district level in Derbyshire for 2015 is as follows:
- Derbyshire Dales at £272 K
- South Derbyshire at £195 K
- North East Derbyshire at £ 191 K
- High Peak at £189 K
- Amber Valley at £184 K
- City Of Derby at £166 K
- Erewash at £158 K
- Chesterfield at £153 K
- Bolsover at £127 K
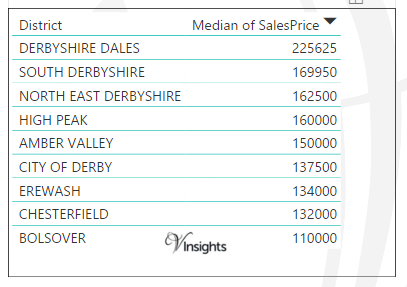
The median sales prices at district level in Derbyshire for 2015 is as follows:
- Derbyshire Dales at £226 K
- South Derbyshire at £170 K
- North East Derbyshire at £163 K
- High Peak at £160 K
- Amber Valley at £150 K
- City Of Derby at £138 K
- Erewash at £134 K
- Chesterfield at £132 K
- Bolsover at £110 K
New Vs Not New Property Statistics
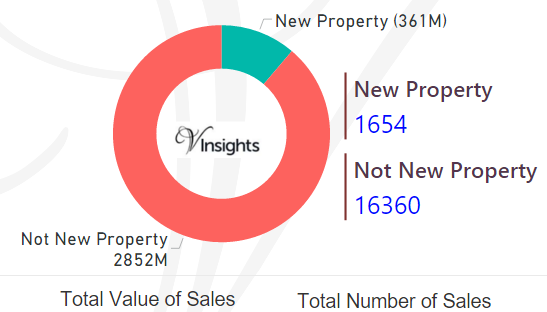
By Sales Values the split is as follows:
- New Properties contributed £361 millions (11.22%)
- Not New Property contributed £2.85 billions (88.78%)
By Total Number the split is as follows:
- New properties sold were 1654 (9.18%)
- Not new property sold were 16,360 (90.82%).
All Posts on Derbyshire

b7056c33-414c-4694-84dc-5cecd96bc72b|0|.0|27604f05-86ad-47ef-9e05-950bb762570c