Story Highlights
- Essex had total property sales of £8.79 billions in 2015.
- The total number of properties sold in 2015 in Essex was 29,210
- The total volume of sales at district level was maximum for Chelmsford at £1.7 Billions
- The average sales price in Essex was £301 K whereas median was £250 K
- The average sales price at district level was maximum for Epping Forest at £462 K
- Similarly the median of sales price at district level was maximum for Epping Forest at £378 K
- New Property sales in Essex contributed 9.94% and Not New Property contributed 90.06%
Essex is one of the counties of East England. The districts of Essex are Chelmsford, Epping Forest, Colchester, Basildon, Braintree, Uttlesford, Brentwood, Tendring, Rochford, Castle Point, Maldon, Harlow.
Let us look at the Essex Property Market in 2015 in detail.
Total Sales By Districts
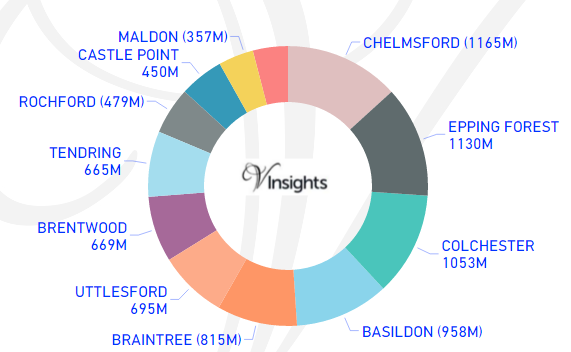
The total sales of £8.79 Billions in 2015 contributed 25.53% of East England Property Market 2015.
The split across its districts is as follow:
- Chelmsford was maximum at £1.17 Billions (13.25%)
- Epping Forest at £1.13 billions (12.85%)
- Colchester at £1.05 billions (11.98%)
- Basildon at £958 millions (10.89%)
- Braintree at £815 millions (9.27%)
- Uttlesford at £695 millions (7.91%)
- Brentwood at £669 millions (7.61%)
- Tendring at £665 millions (7.57%)
- Rochford at £479 millions (5.44%)
- Castle Point at £450 millions (5.12%)
- Maldon at £357 millions (4.06%)
- With minimum for Harlow at £356 millions (4.05%)
Total Sales By Property Type
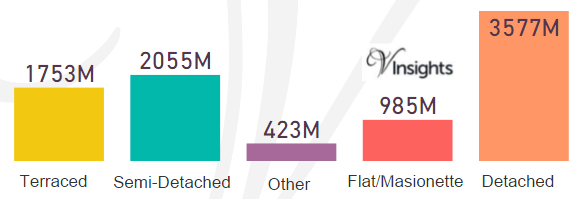
The split of £8.79 billions across the different property types in Essex are:
- Detached at £3.577 billions (40.68%)
- Terraced at £1.75 billions (19.93%)
- Semi-Detached at £2.06 billions (23.37%)
- Flat/Maisonette at £985 millions (11.2%)
- Other at £423 millions (4.81%)
Total No Of Properties Sold By Property Type
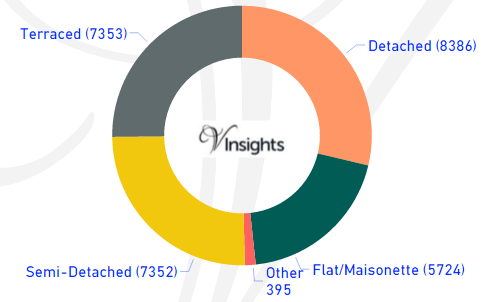
The total property sales of £8.79 billions in 2015 was spread over 29,210 properties.
- Terraced properties at 7,353 (25.17%)
- Detached at 8,386 (28.71%)
- Semi-Detached at 7,352 (25.17%)
- Flat/Maisonette at 5,724 (19.6%)
- Others at 395 (1.35%).
Average & Median Sales Price
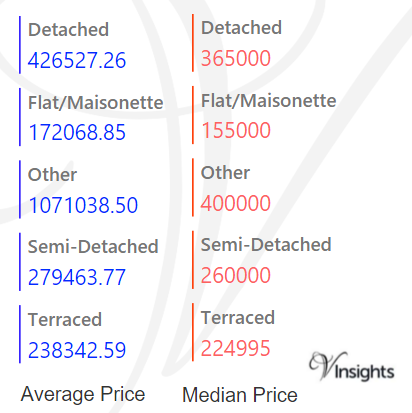
The average sales price in Essex was £301 K. For the different property types it was:
- Detached at £427 K
- Semi-Detached at £280 K
- Terraced at £238 K,
- Flat/Maisonette at £172 K
- Other it is at £1.07 millions.
Similarly median sales price in Essex was £250 K. For the different property types it was:
- Detached at £365 K
- Semi-Detached at £260 K
- Terraced at £225 K
- Flat/Maisonette at £155 K
- Other it is at £400 K
Average & Median Sales Price By Districts
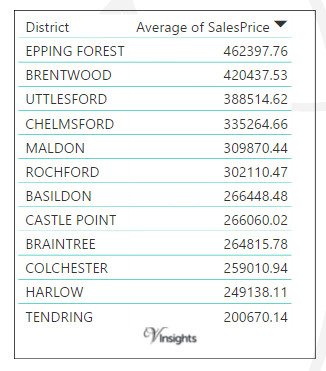
The average sales prices at district level in Essex for 2015 is as follows:
- Epping Forest had maximum average sales price at £462 K
- Brentwood at £420 K
- Uttlesford at £389 K
- Chelmsford at £335 K
- Maldon at £310 K
- Rochford at £302 K
- Basildon at £267 K
- Castle Point at £266 K
- Braintree at £265 K
- Colchester at £259 K
- Harlow at £249 K
- With minimum average sales price for Tendring at £201 K
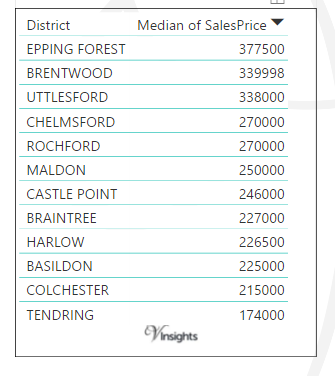
The average of median price at district level in Essex for 2015 is as follows.
- Epping Forest had maximum median sales price at £378 K
- Brentwood at £340 K
- Uttlesford at £338 K
- Chelmsford at £270 K
- Rochford at £270 K
- Maldon at £250 K
- Castle Point at £246 K
- Braintree at £227 K
- Harlow at £227 K
- Basildon at £225 K
- Colchester at £215 K
- With minimum of median sales price for Tendring at £174 K
New Vs Not New Property Statistics
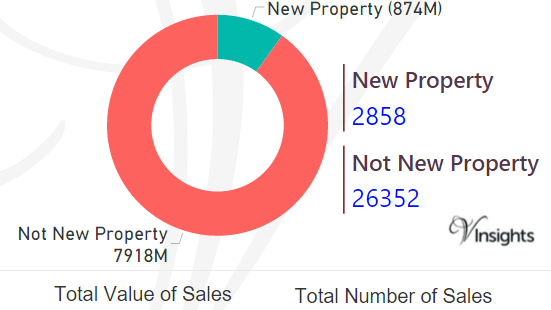
By Sales Values the split is as follows:
- New Properties contributed £874 millions (9.94%)
- Not New Property contributed £7.92 billions (90.06%)
By Total Number the split is as follows:
- New properties sold were 2,858 (9.78%)
- Not new property sold were 26,352 (90.22%).
All England Posts
8529e78c-e9a4-415c-877f-17cea4bf5dd8|0|.0|27604f05-86ad-47ef-9e05-950bb762570c