For 2016 details - Islington Property Market 2016
Story Highlights
- Islington had total Property Sales of £2.21 billions in 2015.
- The total number of properties sold in year 2015 was 2597.
- The Average property price was £851 K millions while Median was £580 K.
-
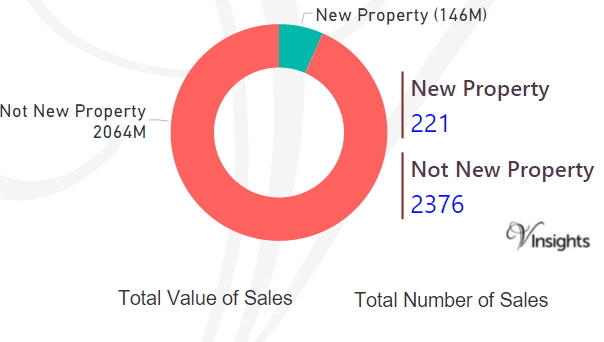
Not New Property contributed £2.064 billion (93.4%) and New Property 146 millions (6.6%) giving combined total of £2.21 billions.
-
The number of Not New Property sold was 2376 (91.49%), whereas the number of New Property sold was 221 (8.51%) giving combined total of 2597.
Total Sales By Property Type

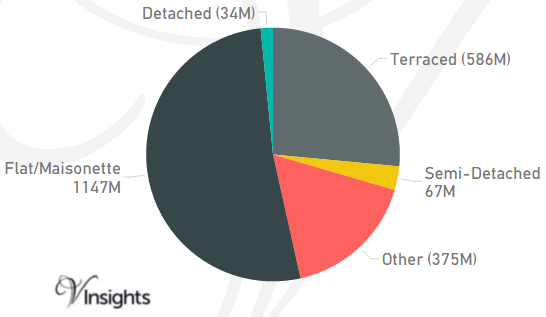
Islington is one of the Boroughs of Central London. It had total Property Sales of £2.21 billions which was 7.9% of Central London Property Market 2015.
The split across the different property types are:
- Terraced £586 millions (26.5%)
- Semi-Detached £67 millions (3.02%)
- Other £375 millions (16.99%)
- Flat/Maisonette £1.147 billions (51.93%)
- Detached £34 millions (1.56%)
Total No Of Properties Sold By Property Type

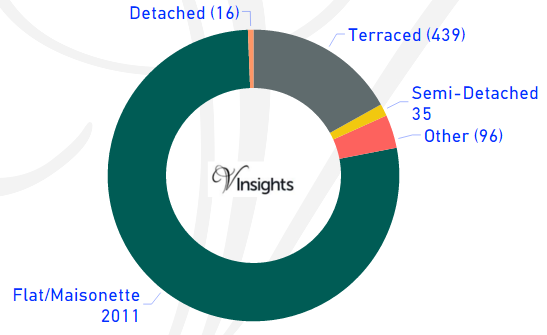
In Islington the total number of properties sold in year 2015 was 2597. The breakdown by different property types are:
- Terraced 439 (16.9%)
- Semi-Detached 35 (1.35%)
- Other 96 (3.7%)
- Flat/Maisonette 2011 (77.44%)
- Detached 16 (0.62%)
Average & Median Sales Price

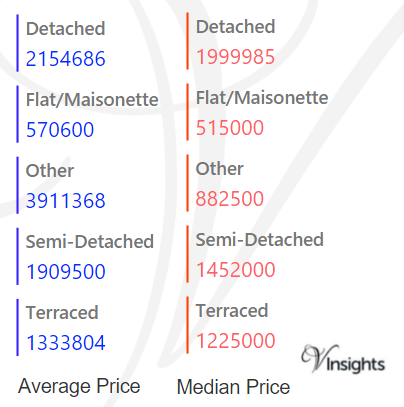
In 2015 the Average property price was £851 K in Islington. The average price for the different property types are:
- Detached £2.155 millions
- Flat/Maisonette £571 K
- Other £3.9 millions
- Semi-Detached £1.91 millions
- Terraced £1.33 millions
The Median Price was £580 K. The median property price for the different property types are:
- Detached £2 millions
- Flat/Maisonette £515 K
- Other £883 K
- Semi-Detached £1.45 millions
- Terraced £1.23 millions
New Vs Not New Property Statistics

By Value Of Sales
- Not New Property contributed £2.064 billion (93.4%)
- New Property 146 millions (6.6%) giving combined total of £2.21 billions.
By Number Of Sales
- The number of Not New Property sold was 2376 (91.49%)
- The number of New Properties sold was 221 (8.51%) giving combined total of 2597.
All London Posts
379ee4d7-2df4-4cba-adc2-52affdb6074a|0|.0|27604f05-86ad-47ef-9e05-950bb762570c