For 2016 Details : Cheshire West and Chester Property Market 2016 at Postcode Level with School Details
Story Highlights
- Cheshire West and Chester had total property sales of £1.48 millions in 2015
- The total number of properties sold in 2015 was 6,501
- The average sales price in Cheshire West and Chester was £227 K, whereas median was £180 K
- New Property sales were 15.64% by value, whereas Not New Property contributed 84.36%
Cheshire West and Chester has unitary authority status in North West England.
Total Sales By Property Type
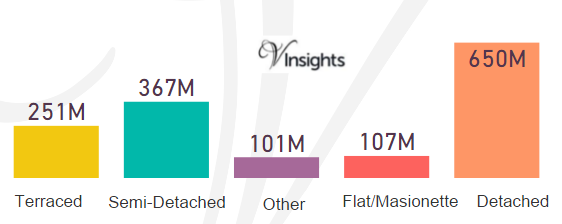
Cheshire West and Chester had total property sales of £1.48 billions which was 6.81% of the North West Property Market 2015.
The split across the different property types are:
- Terraced at £251 millions (17.03%)
- Semi-Detached at £367 millions (24.85%)
- Other at £101 millions (6.82%)
- Flat/Maisonette at £107 millions (7.24%)
- Detached at £650 millions (44.06%)
Total No Of Properties Sold By Property Type
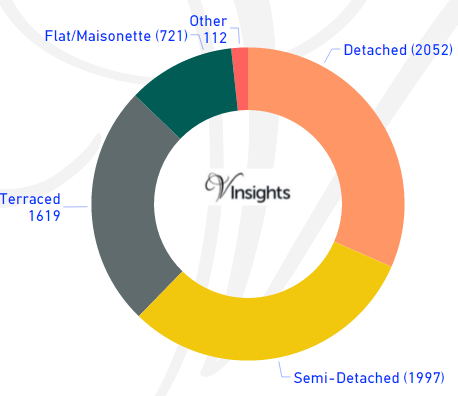
The total property sales of £268 millions in 2015 was spread over 6,501 properties.
- Terraced properties was 1,619 (24.9%)
- Detached at 2052 (31.56%)
- Semi-Detached at 1997 (30.72%)
- Flat/Maisonette at 721 (11.09%)
- Others at 112 (1.72%)
Average & Median Sales Price
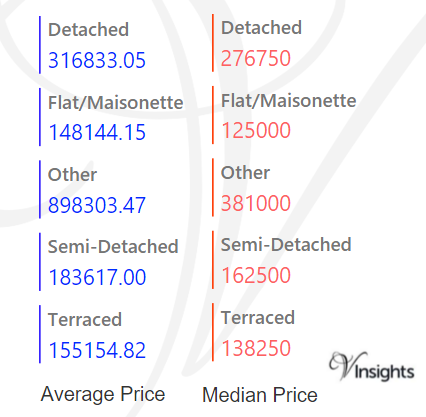
The average sales price in Cheshire West and Chester was £227 K.For the different property types it was:
- Detached at £317 K
- Semi-Detached at £184 K
- Terraced at £155 K
- Flat/Maisonette at £148 K
- Other it is at £898 K
Similarly median sales price in Cheshire West and Chester was £180 K.For different property types it was:
- Detached at £277 K
- Semi-Detached at £163 K
- Terraced at £138 K
- Flat/Maisonette at £125 K
- Other it is at £381 K
New Vs Not New Property Statistics
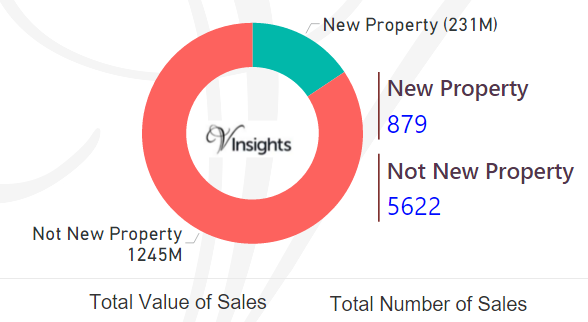
By Sales Values the split is as follows:
- New Property was £231 millions (15.64%)
- Not New Property contributed £1.25 billions (84.36%)
By Total Number the split is as follows:
- New properties sold were 879 (13.52%)
- Not new property sold were 5,622 (86.48%)
All North West England Posts

931062dc-887f-4699-8174-d3b53b31646e|0|.0|27604f05-86ad-47ef-9e05-950bb762570c