
For 2016 details - Central London Property Market 2016
Story Highlights
- Central London in 2015 had total property sales of £28 billions
- City Of Westminster was the leader contributing sales worth £8.72 billions (31.15%)
- The total number of property sold in Central London 2015 was 22,128
- The average sales price in Central London was £1.264 millions and the median sales price was £600 K
- The average sales price was maximum in City of London at £3.44 millions and minimum in Lambeth at £606 K.
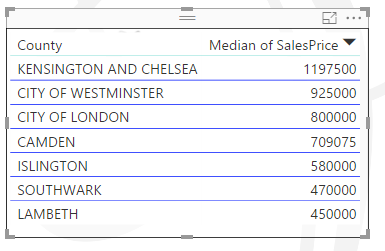
- The median sales price was maximum in Kensington And Chelsea at £1.2 millions and minimum in Lambeth at £450 K.
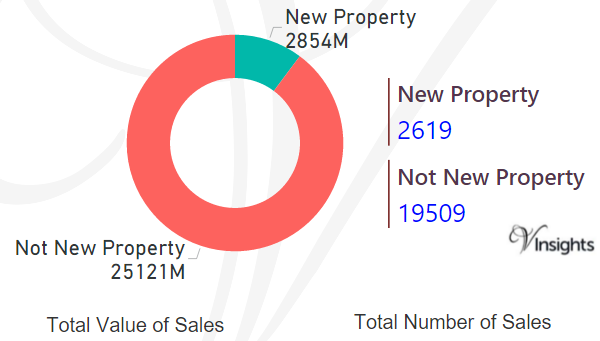
- The sales value contributed by New Property was £2.854 billions (10.2%) where as Not New Property contributed £25.12 billions (89.8 %).
Central London comprises of the Greater London boroughs of Camden, City of London, Westminster, Islington, Kensington & Chelsea, Lambeth and Southwark.
Total Sales By Property Type
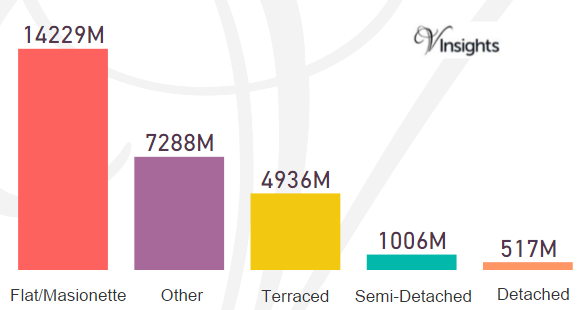
Central London in 2015 had total property sales of £28 billions. It was 34.31% of the London Property Market 2015.
The split across the different property types are:
- Detached £517 millions (1.85%)
- Semi-Detached £1.006 billion (3.6%)
- Terraced £4.936 billions (17.64 %)
- Other £7.288 billions (26.05%)
- Flat/Maisonette £14.229 billions (50.86%)
Total Sales By Borough
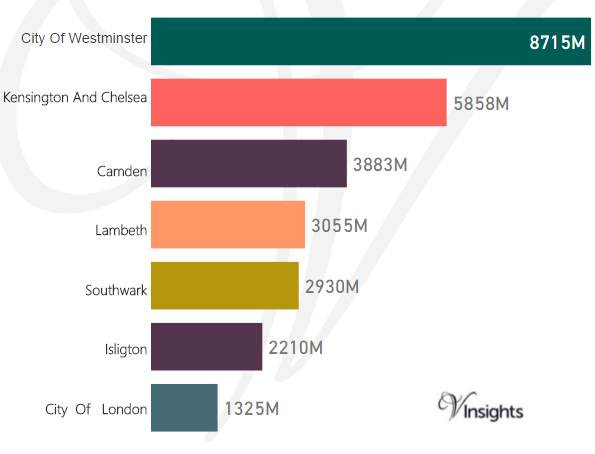
The total sales of £28 billions in 2015 was split across its borough as above.
Total Number Of Sales By Property Types
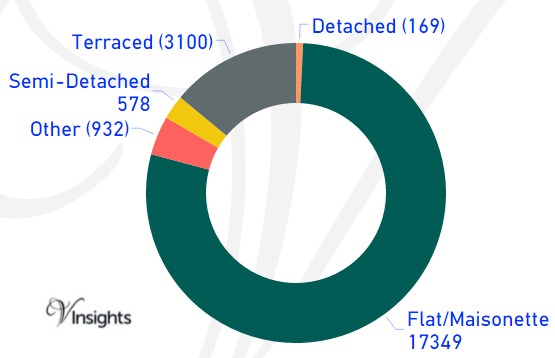
The total number of property sold in Central London 2015 was 22,128. It is split as:
- Detached 169 (0.76%)
- Semi-Detached 578 (2.61%)
- Terraced 3,100(14.01%)
- Flat/Maisonette 17,349 (78.4%)
- Other 932(4.21%)
Average & Median Sales Price
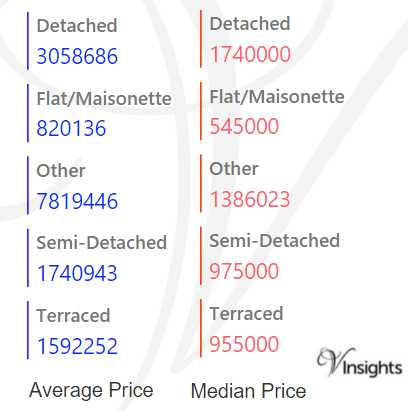
The average sales price in Central London was £1.264 millions. For the different property types it was:
- Detached £3.0586 millions
- Semi-Detached £1.741 millions
- Terraced £1.592 millions
- Flat/Maisonette £820 K
- Other it is £7.82 millions
Similarly the median sales price in Central London was £600 K. For the different property types it was:
- Detached £1.74 millions
- Semi-Detached £975 K
- Terraced £955 K
- Flat/Maisonette £545 K
- Other it is £1.386 millions
Average & Median Sales Price By Borough
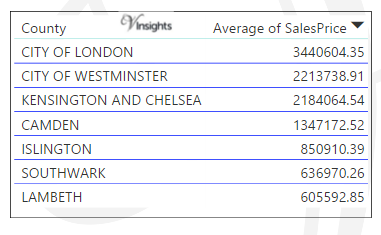
In Central London the Average of Sales Price is as above.
New Vs Not New Property Statistics
By Value Of Sales
- The sales value contributed by New Property was £2.854 billions (10.2%)
- Not New Property contributed £25.12 billions (89.8 %)
By Number Of Sales
- New properties sold were 2,619 (11.84%)
- Not new property sold were 19,509 (88.16%)
All London Posts

68734453-97a7-4c28-857a-13afa7bb8b13|0|.0|27604f05-86ad-47ef-9e05-950bb762570c

For 2016 details - Yorkshire and Humber Property Market 2016
Story Highlights
- Yorkshire and Humber had total property sales of £16 Billions
- The number of properties sold was 87,733 properties
- Across it counties the maximum sales is in West Yorkshire at £6.5 billions
- The average property price was £184 K and the median was £140 K
- The average sales price at County level is maximum at York is £263 K
- New properties contributed 10.82% by value and not new property 89.82%
Yorkshire and Humber is one of the 9 principal areas of England. It comprises of South Yorkshire, West Yorkshire, North Yorkshire, York, East Riding of Yorkshire, Kingston upon Hull, North Lincolnshire, North East Lincolnshire.
Total Value of Sales By Property Types
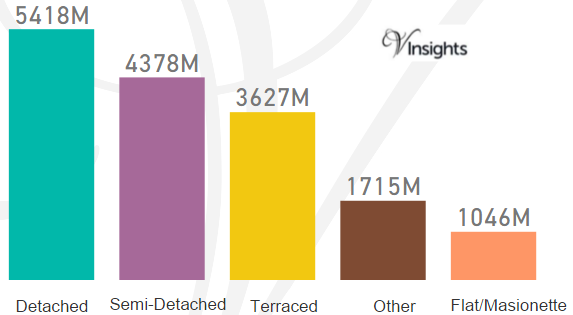
Yorkshire and Humber had total property sales of £16 Billions.It contributed 5.48% of the England and Wales Property Market 2015.
The split across the different property types was :
- Detached at £5.42 Billions (33.48%),
- Semi-Detached at £4.38 Billions (27.05%),
- Terraced at £3.63 Billions (22.41 %) ,
- Other at £1.72 Billions (10.6%),
- Flat/Maisonette at £1.05 Billions (6.46%)
Total Sales By County
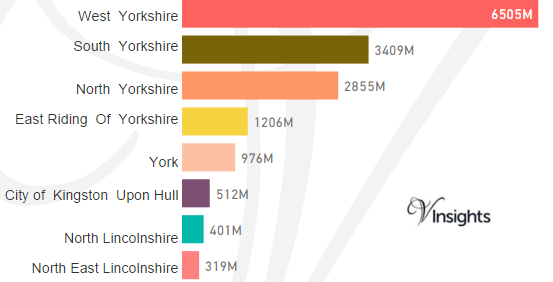
The total sales of £16 billions in 2015 was split across its counties as above.
Total Number of Sales By Property Types
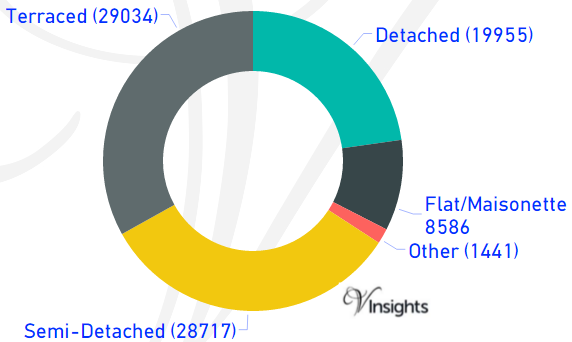
The total property sales of £16 Billions in 2015 was spread over 87,733 properties.
- Terraced properties at 29,034 (33.09%)
- Semi-Detached at 28,717 ( 32.73%)
- Detached at 19,955 (22.75%)
- Flat/Maisonette at 8,586 (9.79%)
- Others at 1,441 (1.64%)
Average & Median Sales Price
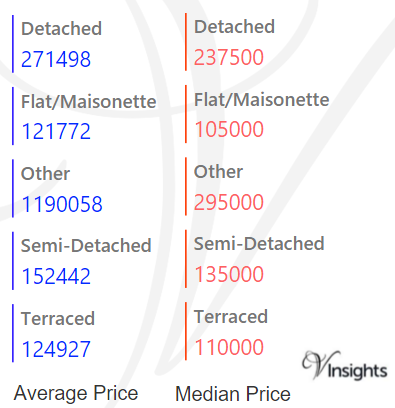
The average sales price in Yorkshire and Humber was £184 K. For the different property types it was
- Detached at £272 K
- Semi-Detached at £152 K
- Terraced at £125K
- Flat/Maisonette at £122 K
- Other it is at £1.19 million.
The median sales price was £140 K and for different property types it was
- Detached at £238 K,
- Semi-Detached at £135 K,
- Terraced at £110 K,
- Flat/Maisonette at £105 K
- Other at £295 k.
Average & Median Sales Price By County
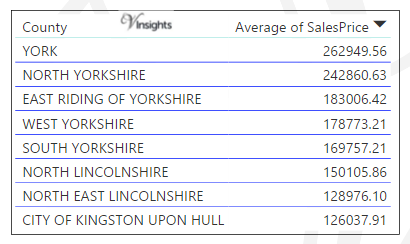
The average sales price by county in Yorkshire and Humber 2015 is as above.
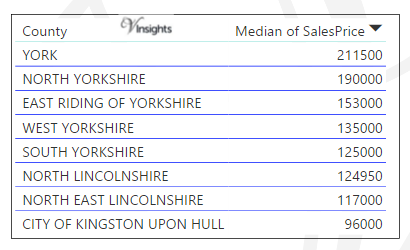
The median sales price by county in Yorkshire and Humber 2015 is as above.
New Vs Not New Property Statistics
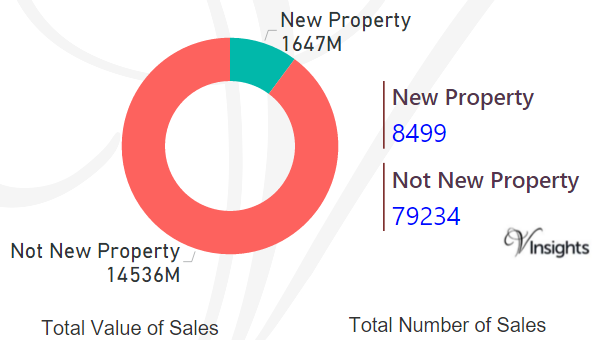
By Value of Sales
- The sales value contributed by New Property was £1.68 billions (10.18%)
- where as Not New Property contribute £14.54 billions (89.82 %)
By Number of Sales
- New properties sold were 8499 (9.69%)
- where as not new property sold were 79234 (90.31%)
All England Posts
fb3b27ae-480d-4843-afe4-b941d51c14df|0|.0|27604f05-86ad-47ef-9e05-950bb762570c
For 2016 details - West Midlands Property Market 2016
Story Highlights
- West Midlands had total property sales of £19 Billions in 2015
- The number of properties sold was 88,925 properties
- The average property price was £209 K and the median was £160 K
- The sales price at the county level was maximum at Warwickshire £262 K
- New properties contributed 11.34% by sales value and not new 88.66%
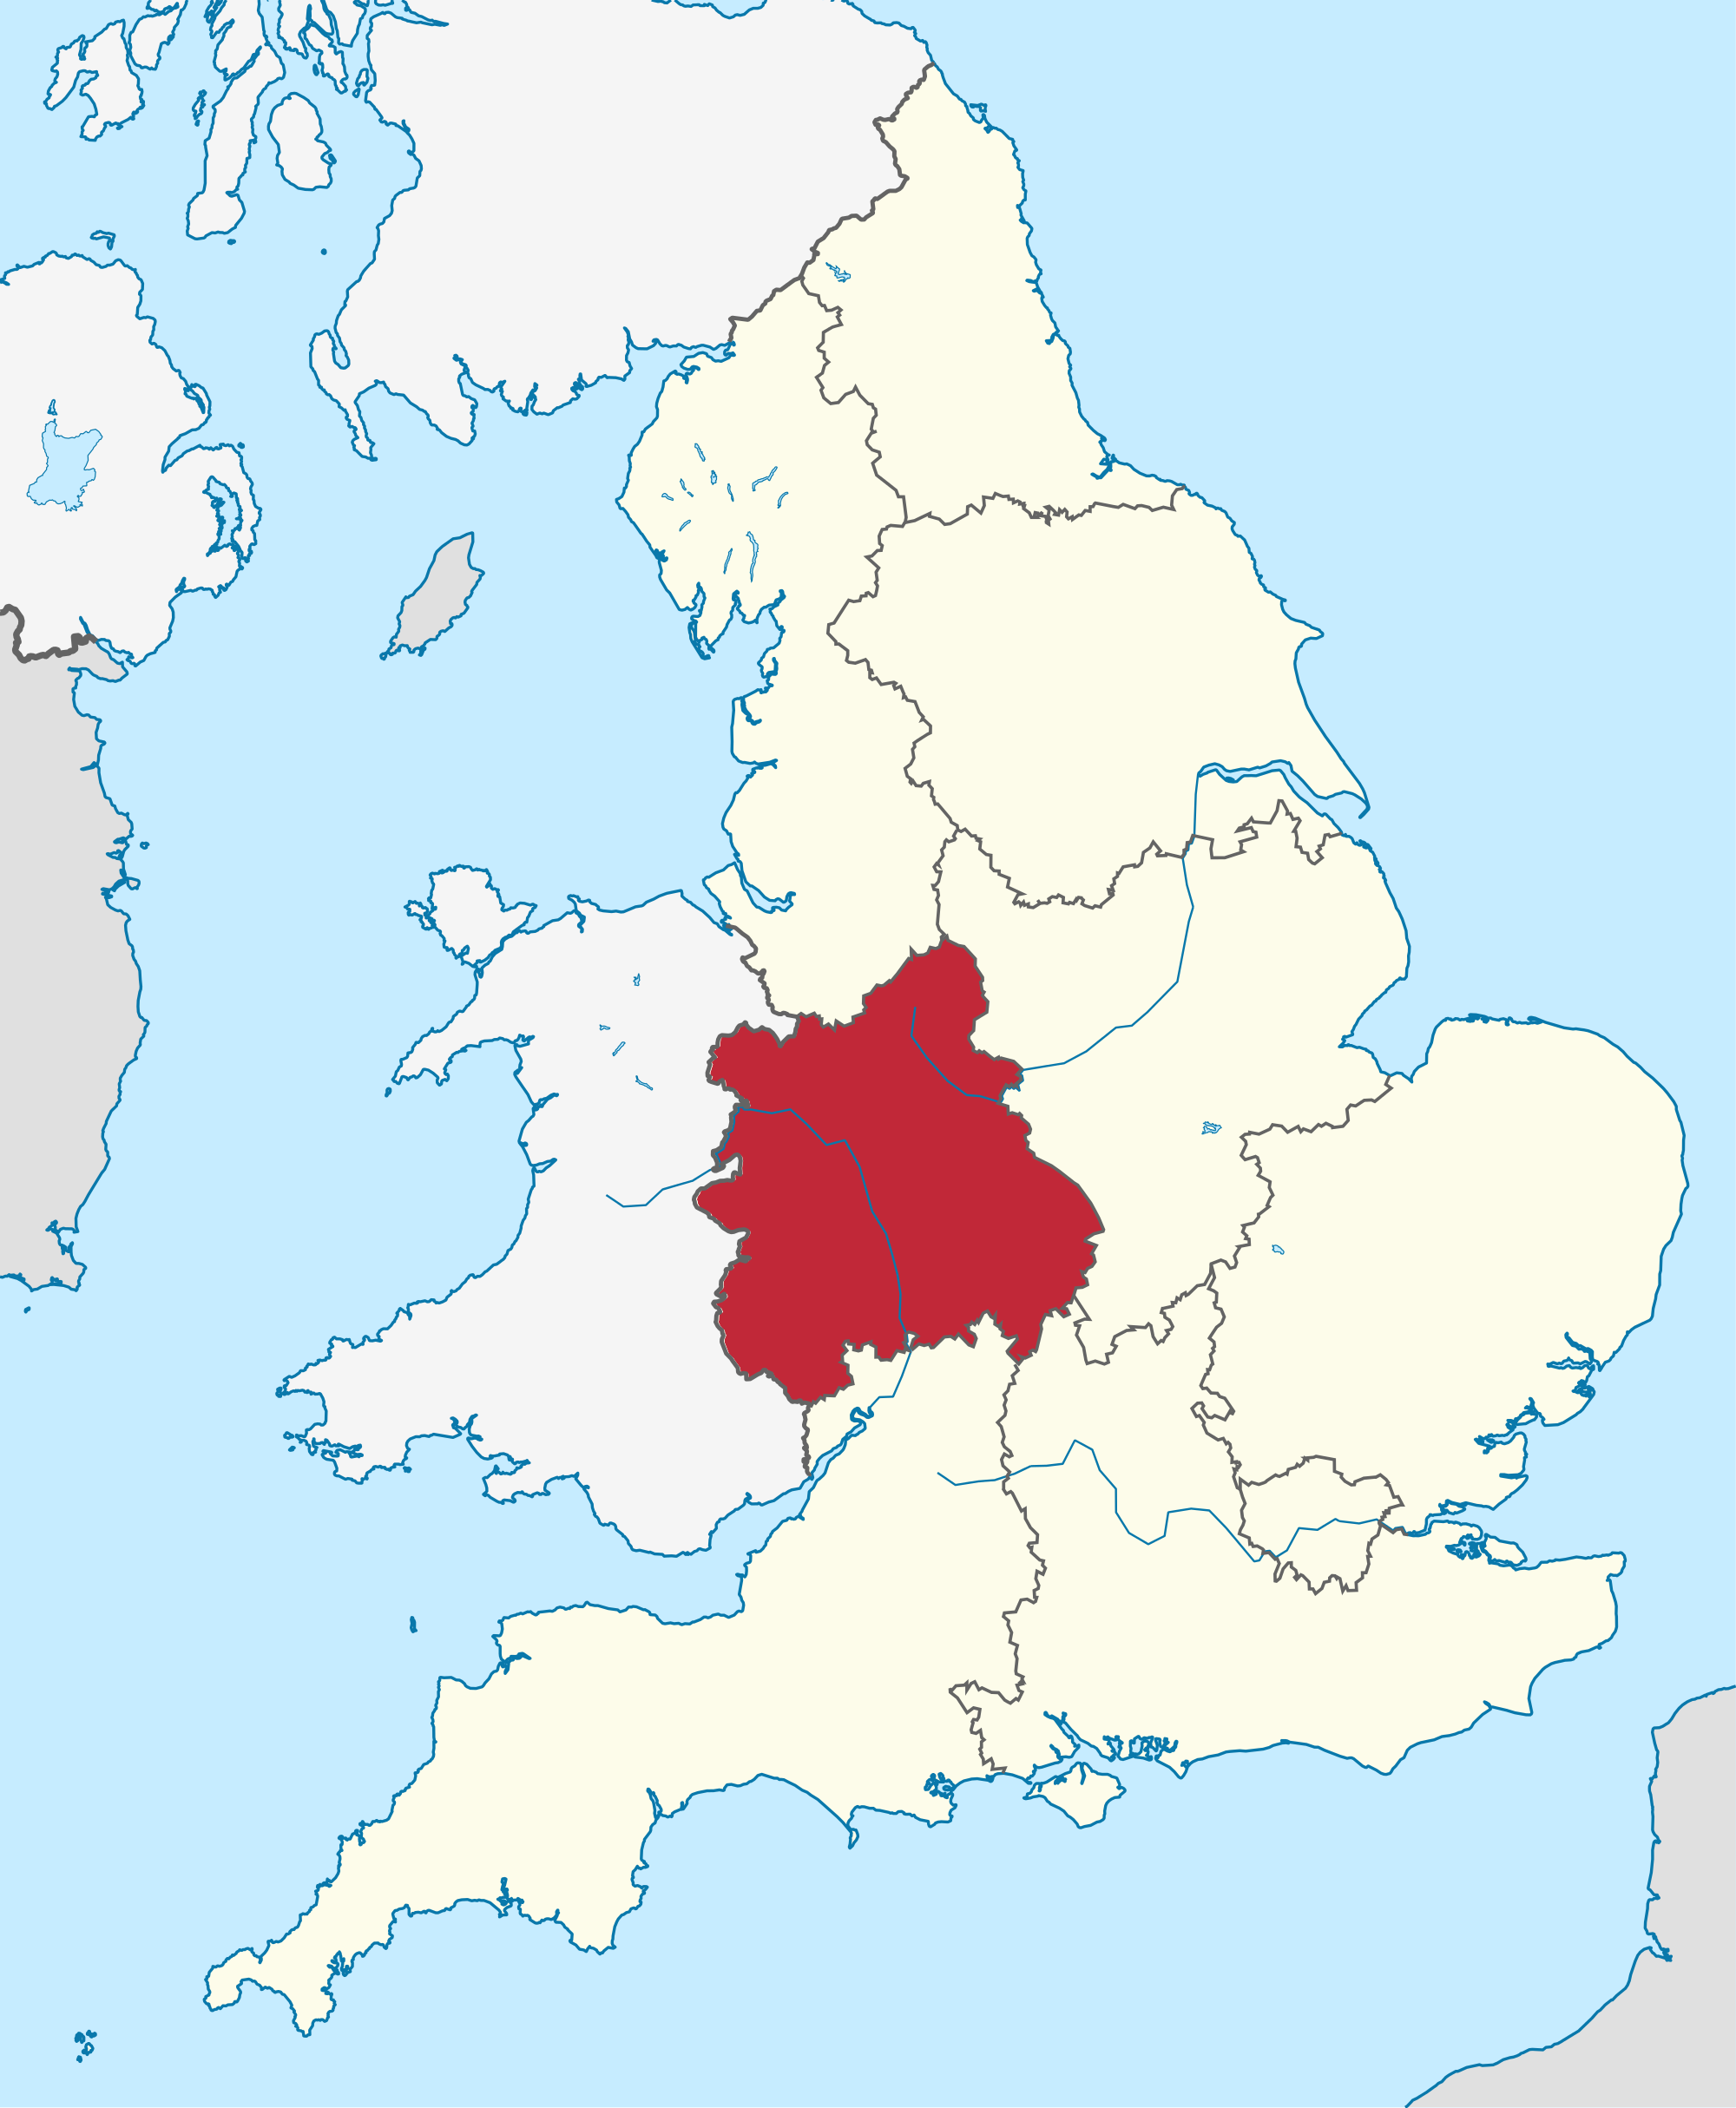
West Midlands is one of the 9 principal areas of England. It comprises of Herefordshire, Shropshire, Telford and Wrekin, Staffordshire, Stoke-on-Trent,Warwickshire, West Midlands county , Worcestershire.
Total Value of Sales By Property Types
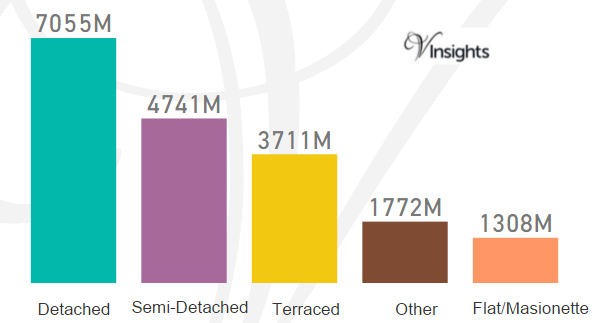
West Midlands had total property sales of £19 billions. It contributed 6.3% of the England and Wales Property Market 2015.
The split across the different property types was
- Detached at £7.06 billions (37.16%)
- Semi-Detached at £4.74 billions (24.95%)
- Terraced at £3.71 billions (19.5 %)
- Other at £1.77 billions (9.31%)
- Flat/Maisonette at £1.31 Billions (6.9%)
Total Sales By County
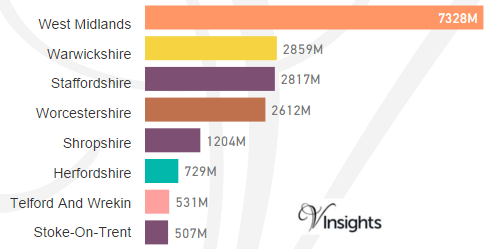
The total sales of £19 billions in 2015 was split across its counties as above.
Total Number of Sales By Property Types
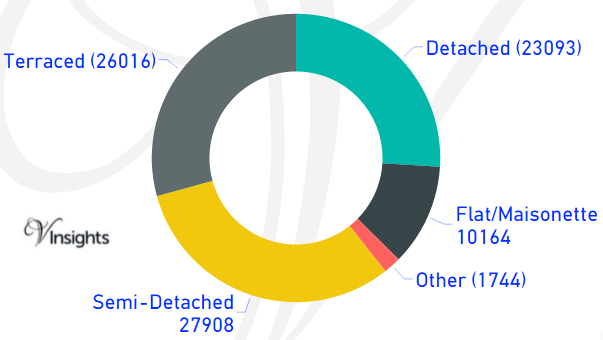
The total property sales of £19 billions in 2015 was spread over 88,925 properties.
- Semi-Detached at 27,908 (31.38%)
- Terraced at 26,016 (29.26%)
- Detached at 23,093 (25.97%)
- Flat/Maisonette at 10,164 (11.43%)
- Others at 1,744 (1.96%)
Average & Median Sales Price
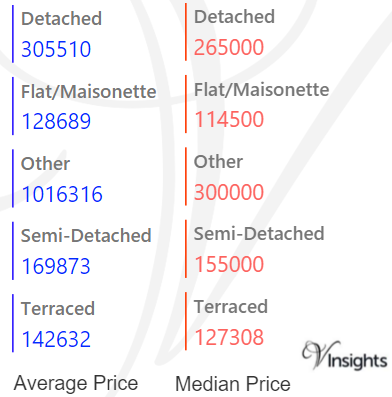
The average sales price in West Midlands was £209 K. For the different property types it was
- Detached £306 K
- Semi-Detached £170 K
- Terraced £143 K
- Flat/Maisonette £129 K
- Other it is £1.02 million.
The median sales price in West Midlands was £160 K. For the different property types it was
- Detached £265 at K
- Semi-Detached at £155 K
- Terraced at £127 K
- Flat/Maisonette at £115 K
- Other it is at £300 K
Average & Median Sales Price By County
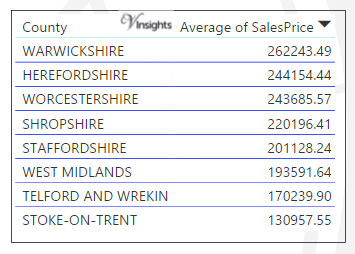
The average sales price at the county level in West Midlands 2015 is as above.
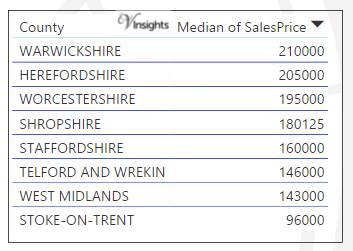
The median sales price at the county level in West Midlands 2015 is as above.
New Vs Not New Property Statistics
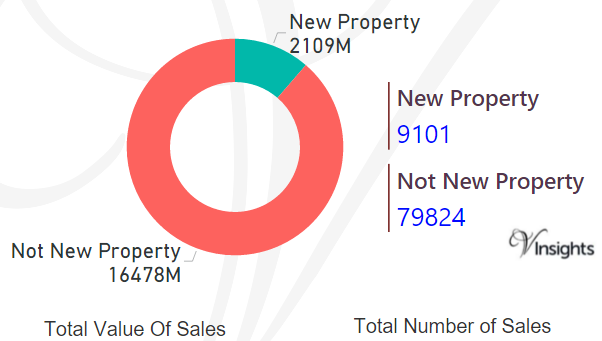
By Value Of Sales
- The sales value contributed by New Property was £2.11 billions (11.34%)
- where as Not New Property contributed £16.5 billions (88.66 %).
By Number Of sales
- New properties sold were 9,101 (10.23%)
- where as not new property sold were 79,824 (89.77%).
All England Posts
9de170f4-ff7d-4850-a485-872ca4b0247a|0|.0|27604f05-86ad-47ef-9e05-950bb762570c
For 2016 details - South West Property Market 2016
Story Highlights
- South West had total property sales of £30 Billions
- Across its counties the property sale was maximum in Devon at £4.4 Billions
- The number of properties sold in South West was 111,721 properties.
- The average sales price in South West was £265 K while median was £215 k.
- The average sales price across it counties was maximum in Poole at £345 K
- New properties contributed 10.82% and not new property contributed 89.7% by value
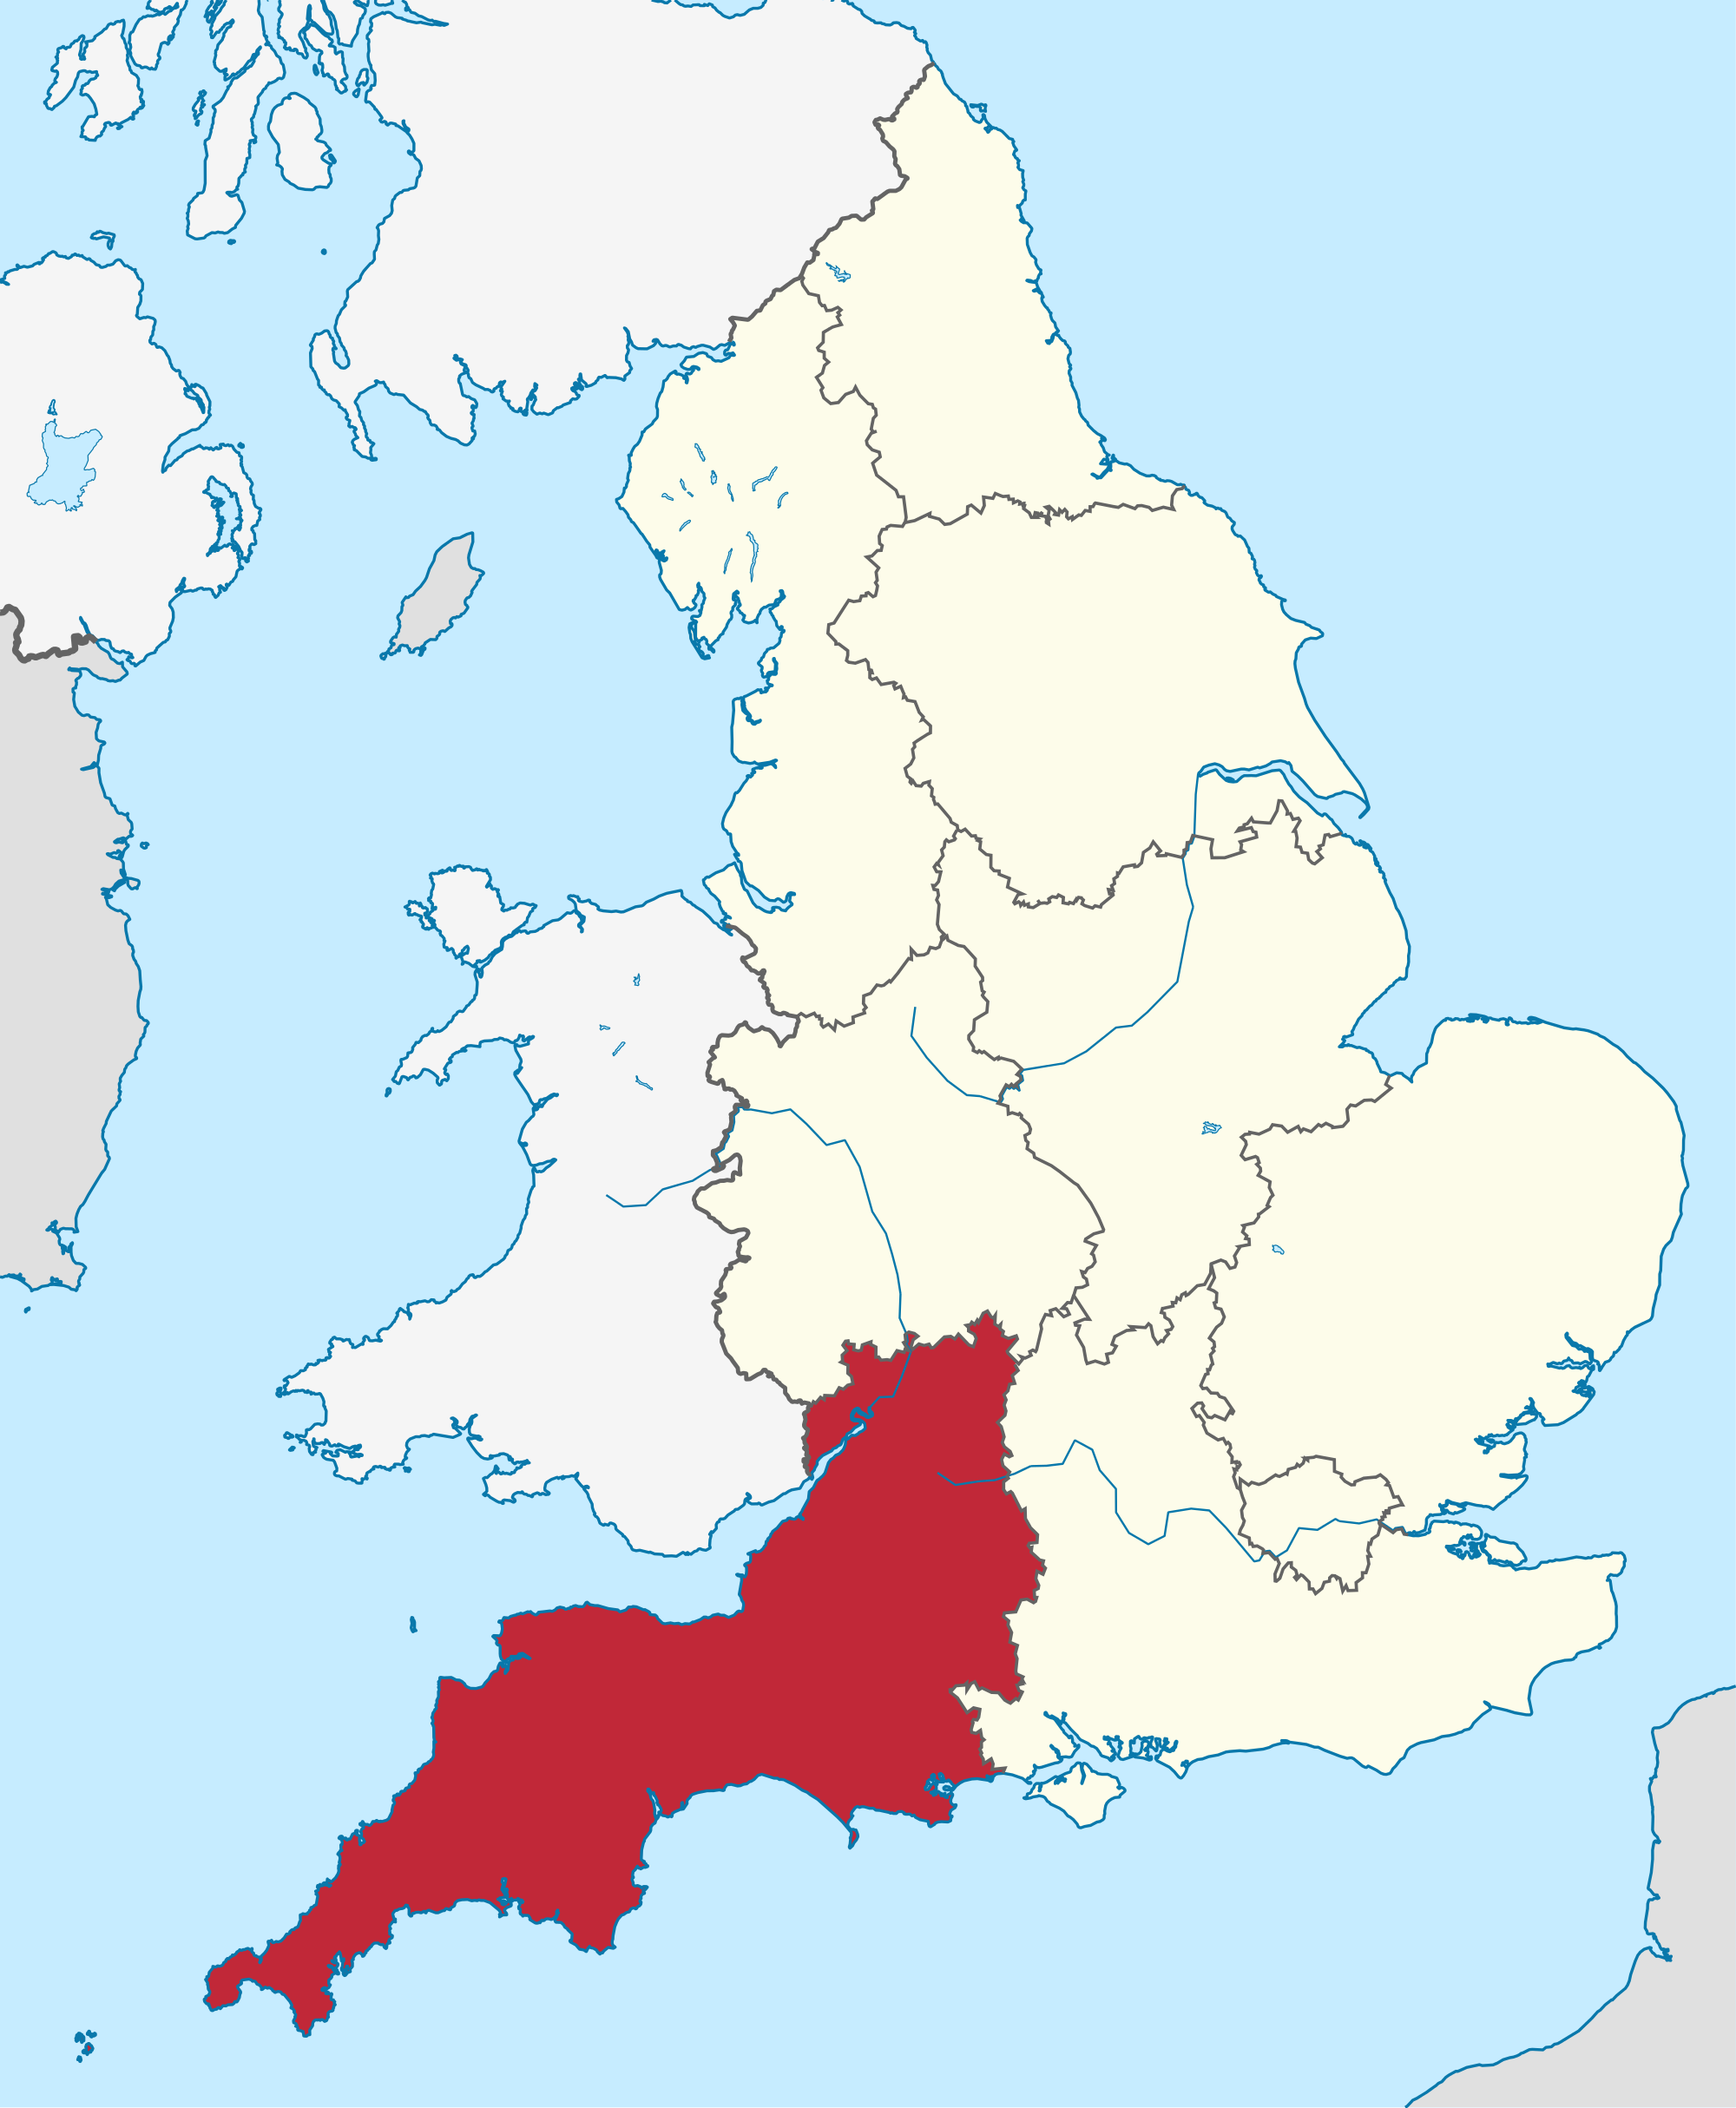
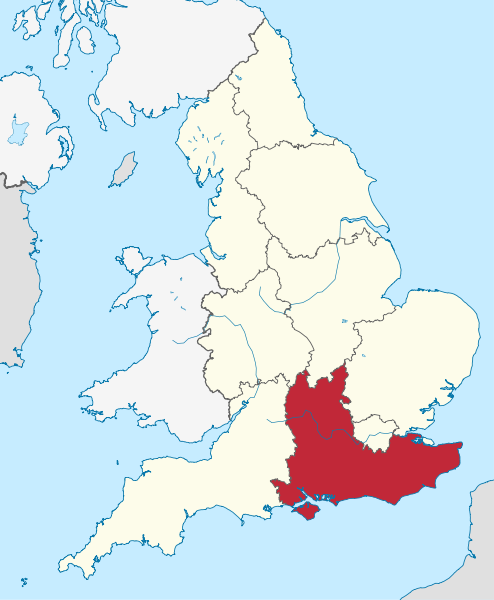
South West is one of the 9 principal areas of England. It comprises of Bath and North East Somerset, North Somerset, Bristol,South Gloucestershire, Gloucestershire, Swindon, Wiltshire, Dorset, Poole,Bournemouth, Somerset, Devon,Torbay, City of Plymouth, Isles of Scilly, Cornwall.
Total Value of Sales By Property Types
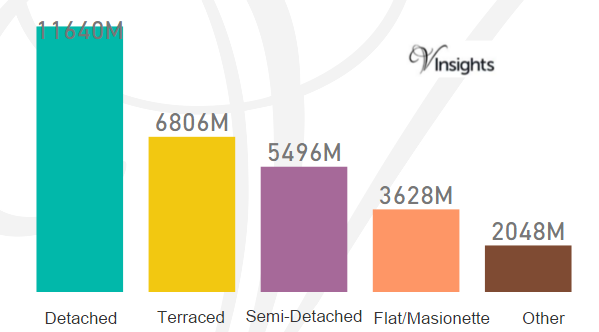
South West had total property sales of £30 Billions. It contributed 10.03% of the England and Wales Property Market 2015.
The split across the different property types was :
- Detached at £11.64 billions (39.3%),
- Terraced at £6.81 billions (22.98 %) ,
- Semi-Detached at £5.5 billions (18.56%),
- Flat/Masionette at £3.63 billions (12.25%),
- Other at £2.05 Billions (6.92%).
Total Sales By County
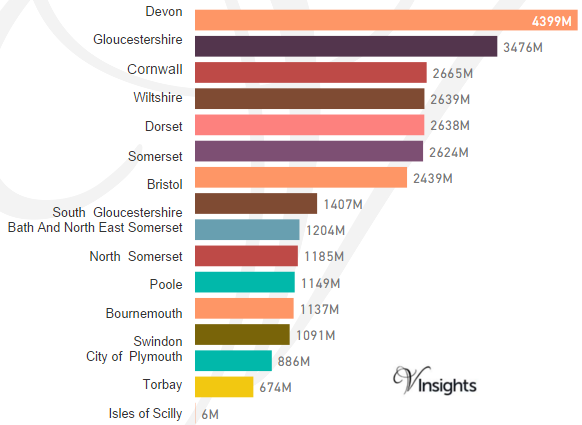
The total sales of £30 billions in 2015 was split across its counties as above.
Total Number of Sales By Property Types
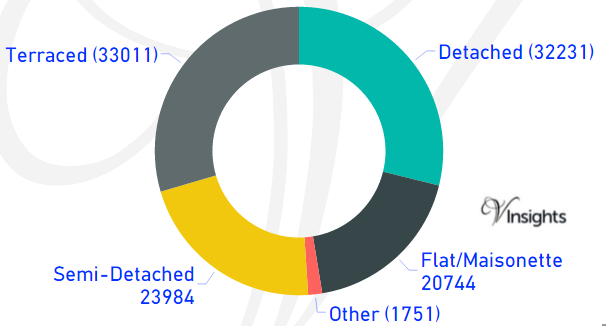
The total property sales of £30 Billions in 2015 was spread over 111,721 properties.
- Terraced properties at 33,011 (29.55%) ,
- Detached at 32,231 ( 28.85%),
- Semi-Detached at 23,984 (21.47%),
- Flat/Maisonette at 20,744 (18.57%),
- Others at 1,751 (1.57%).
Average & Median Sales Price
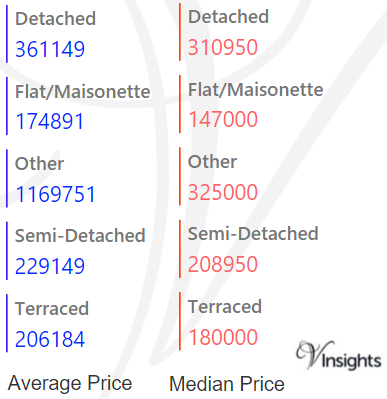
The average sales price in South West was 265 K. For the different property types it was
- Detached at £361 K
- Semi-Detached at £229 K
- Terraced at £206K
- Flat/Maisonette at £175 K
- Other it is at £1.17 million.
The median sales price in South West was 215 K. For different property types it was
- Detached £311 K,
- Semi-Detached £209 K,
- Terraced £180 K,
- Flat/Maisonette £147 K
- Other £325 k.
Average & Median Sales Price By County
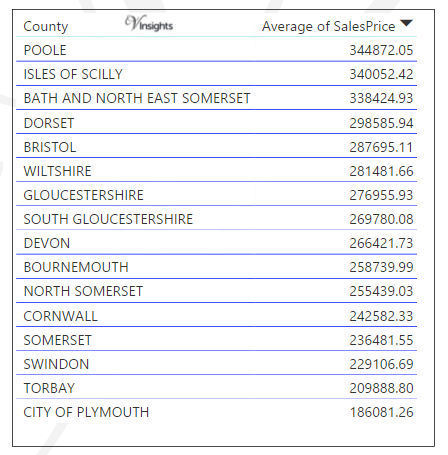
The average sales price for the counties of South West are as above.
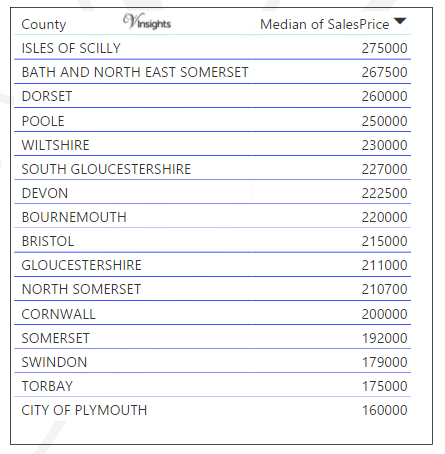
The median sales price for the counties of South West are as above.
- The maximum median sales price was for Isles Of Scilly at £275 K,
- Bath And North East Somerset £268 K,
- Dorset £260 K,
- Poole £250 K,
- Wiltshire £230 K,
- South Gloucestershire £227 K,
- Bournemouth £220 K,
- Bristol £215 K,
- Gloucestershire £211 K,
- North Somerset £211 K,
- Devon £205 K,
- Cornwall £200 K,
- Somerset £192 K,
- Swindon £179 K,
- Torbay £175 K
- with minimum for City of Plymouth at £160 K.
New Vs Not New Property Statistics
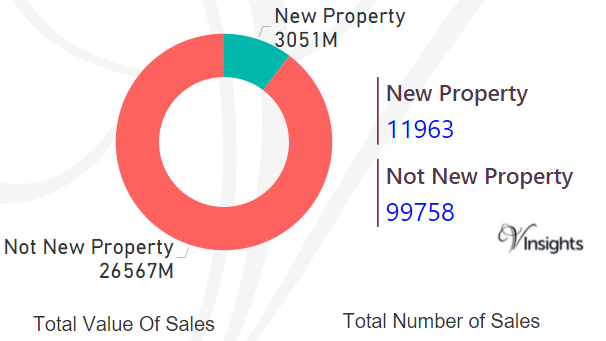
By Sales Value
- The sales value contributed by New Property contribute £3.05 billions (10.3%)
- where as Not New Property contribute £26.57 billions (89.7 %).
By Number Of Sales
- Number of new properties sold were 11,963 (10.71%)
- where as not new property sold were 99,758 (89.29%).
All England Posts
3de8ff67-28a6-43bb-82ab-aabad54f2286|0|.0|27604f05-86ad-47ef-9e05-950bb762570c
For 2016 details - South East England Property Market 2016
Story Highlights
- South East had total property sales of £61 Billions in 2015
- Total Sales By county was maximum in Surrey at £11.16 Billions
- The total number of properties sold in 2015 was 174,172 properties
- The average sales price in South East was £352 K whereas median was £270 K
- The average sales price in South East at County level was maximum for Surrey at £504 K and was minimum for Isle Of Wight at £219 K.
- New Property sales were 9.53% by value where as Not New Property contributed 90.47%
South East is one of the 9 principal areas of England. South East England counties are Berkshire, Buckinghamshire, Milton Keynes, East Sussex, Brighton & Hove,Hampshire, Southampton, Portsmouth, Isle Of Wight, Kent, Medway, Oxfordshire, Surrey and West Sussex. It is the most populous of the nine regions of England.
Total Value of Sales By Property Types
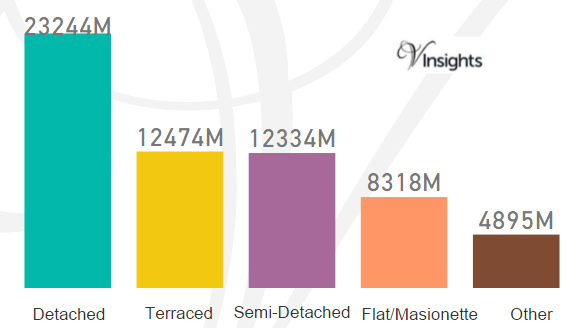
South East had total property sales of £61 Billions. It contributed 20.75% of the England and Wales Property Market 2015.
The split across the different property types was
- Detached at £23.24 Billions (37.94%)
- Terraced at £12.47 Billions (20.36%)
- Semi-Detached at £12.33 Billions (20.13 %)
- Flat/Masionette at £8.32 Billions (13.58%)
- Other at 4.9 billions (7.99%)
Total Sales By County
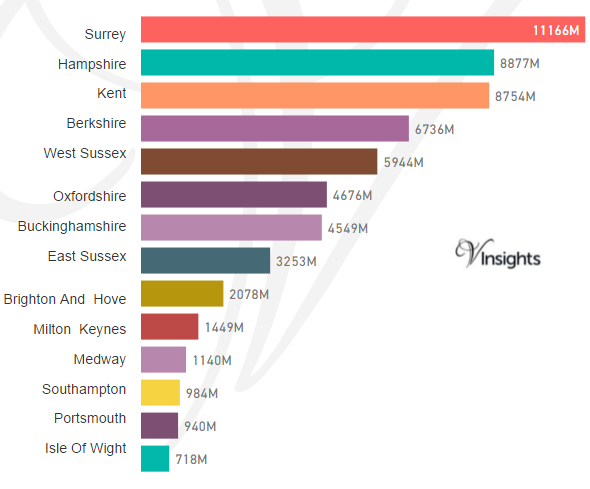
The total sales of £61 billions in 2015 was split across its counties as above.
Total Number of Sales By Property Types
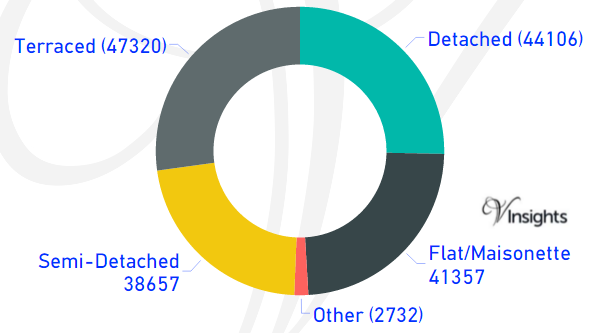
The total property sales of £61 Billions in 2015 was spread over 174,172 properties.
- Terraced properties at 47,320 (27.17%)
- Detached at 44,109 (25.32%)
- Semi-Detached at 38,657 ( 22.19%)
- Flat/Maisonette at 41,357 (23.74%)
- Others at 2,732 (1.57%)
Average & Median Sales Price
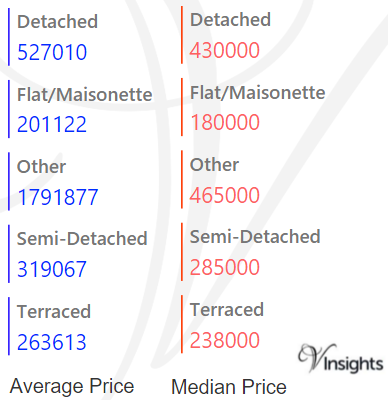
The average sales price in South East was £352 K. For the different property types it was
- Detached at £527 K
- Semi-Detached at £319 K
- Terraced at £264 K
- Flat/Maisonette at £201 K
- Other it is at £1.79 million.
Similarly median sales price in South East was £270 K. For different property types it was
- Detached at £430 K
- Semi-Detached at £285 K
- Terraced at £238 K
- Flat/Maisonette at £180 K
- Other it is at £465 K
Average & Median Sales Price By County
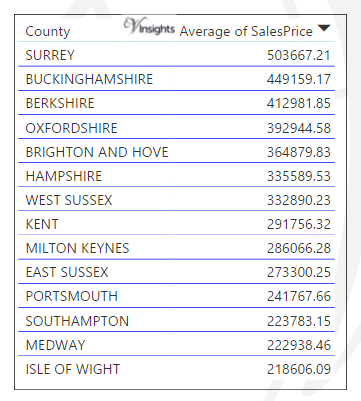
The average sales price in South East in 2015 is as above.
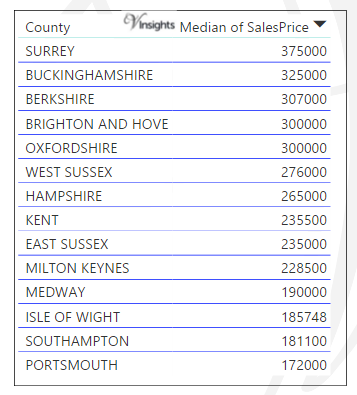
The median sales price in South East in 2015 is as above.
New Vs Not New Property Statistics
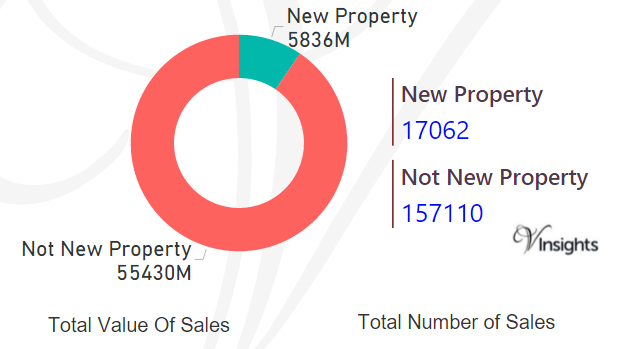
By Value Of Sales
- The sales value contributed by New Property was £5.836 billions (9.53%)
- where as Not New Property contribute £55.43 billions (90.47 %)
By Number Of Sales
- New properties sold were 17,062 (9.8%)
- where as not new property sold were 157,110 (90.2%)
All England Posts
41f3e6d4-2c9a-43b6-9a68-9428aaec4ef4|0|.0|27604f05-86ad-47ef-9e05-950bb762570c