
Story Highlights
- England and Wales had total property sales of approx. £297 billions in 2016
- The total number of properties sold in 2016 was 971,782
- By region the maximum sales was in Greater London at £76 billions
- The average sales price in England and Wales was £306 K, whereas median was £213 K
- By region the average price was maximum in London at £674 K and median at £435 K
- New Property sales were 9.47% by value, where as Not New Property contributed 90.53%
- Stamp duty hike caused monthly spike in March
- Brexit coupled with Stamp Duty Hike arrested the sharp growth of England and Wales property market in 2016 that was witnessed over the last couple of years
England and Wales property market 2016 is as below. The regions it is made up of are Greater London, South East England, East Of England, South West England, North West England , West Midlands, East Midlands, Yorkshire and the Humber, Wales, North East England.
Total Sales By Region
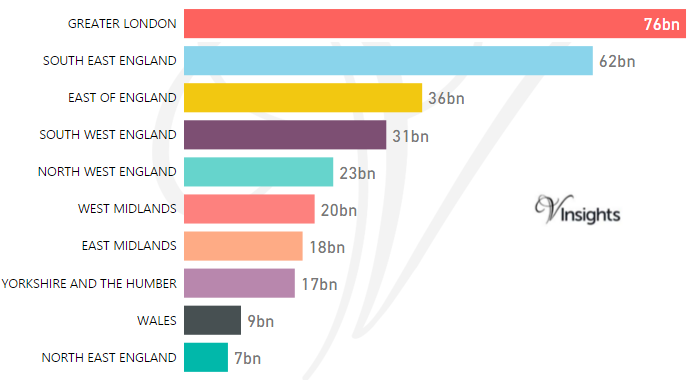
The total property sales of England and Wales combined was approx. £297 billions which is £2 billions growth over 2015.
Region wise Split of
England and
Wales property market 2016 was :
Year on Year Comparison : Compared to England and Wales Property Market 2015
Total Sales By Property Type
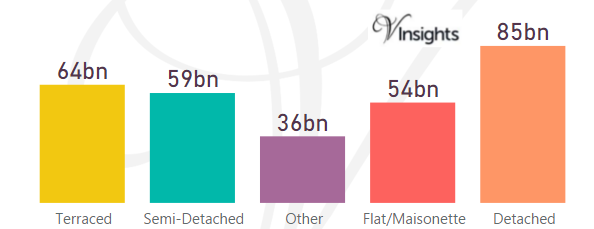
The split of £297 billions across the different property types was
- Terraced at £64 billions (21.41%),
- Semi-Detached at £59 billions (19.91%),
- Other at £36 billions (12.06%),
- Flat/Maisonette at £54 billions (18.18%),
- Detached at £85 billions (28.44%).
Year on Year Comparison : Compared to England and Wales Property Market 2015
- All the property types sales have shown decline except Other and Semi-Detached.
- Other has shown a growth of 16%, which indicates growth in property sales for commercial and business purposes.
Month-wise Break-up of Total Sales
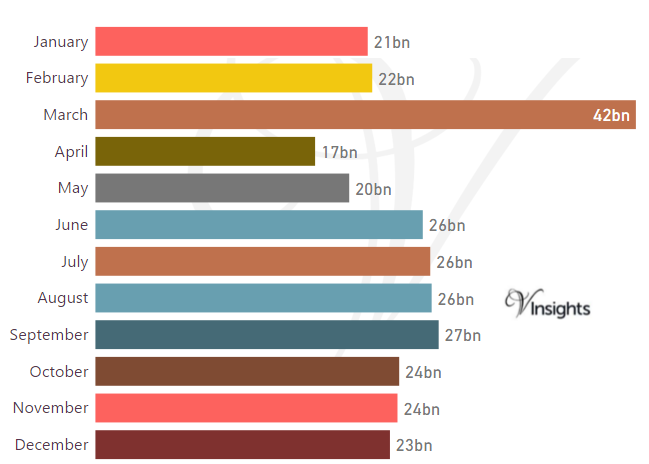
Some of the insights based on the £297 billions month-wise break-down :
Stamp Duty Hike Impact
- March had property sale spike of £42 billions compared to £22 billions in Feb
- The impetus for it was to avoid the extra 3% in Stamp Duty Tax applicable on buying an additional home, being applicable from April 1 2016
Brexit Impact
- Brexit took place on 23rd June 2016.
- As can be observed from the month-wise break-up there does not seem to have been dip in property sales in the immediate aftermath of Brexit
- Year on Year growth over the last 4 years have been 30.82% in 2013, 32.21 % in 2014, 7.27% in 2015, 0.67% in 2016.
- Brexit has cooled the sharp growth in property market witnessed over the last 4 years.
Total No Of Properties Sold By Property Type
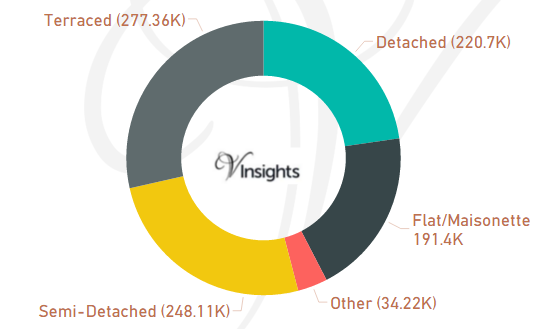
England and Wales had total property sales of 971,782
The split across the different property types are
- Detached are 220,696 (22.71%)
- Flat/Maisonette at 191,399 (19.7%)
- Other at 34,216 (3.52%)
- Semi-Detached at 248,113 (25.53%)
- Terraced at 277,358 (28.54%)
Year on Year Comparison : Compared to England and Wales Property Market 2015
- Total number of property sales in 2016 has decreased by 2.66%.
- All property types have shown decline in number of properties sold except property type Other.
- Other has shown significant increase of 94% from 17,614 in 2015 to 34,216 in 2016.
Average & Median Sales Price
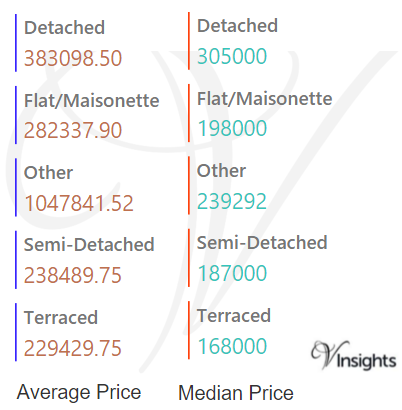
The average sales price in England and Wales was £306 K
For the different property types it was:
- Detached at £383 K
- Semi-Detached at £239 K
- Terraced at £230 K
- Flat/Maisonette at £282 K
- Other it is at £1.05 million.
Similarly median sales price in England and Wales was £213 K
For the different property types it was:
- Detached at £305 K
- Semi-Detached at £187 K
- Terraced at £168 K
- Flat/Maisonette at £198 K
- Other it is at £239 k.
Year on Year Comparison : Compared to England and Wales Property Market 2015
- The average and median property prices have gone up except for property type Other
Average and Median Sales Price By Regions
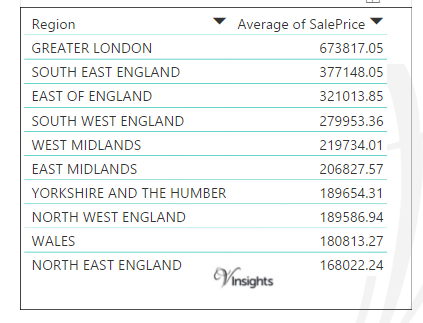
The average sales price by region in England and Wales was :
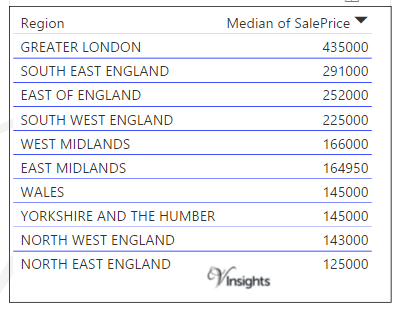
The median sales price by region in England and Wales was :
Year on Year Comparison : Compared to England and Wales Property Market 2015
- The average and median sales price across all the regions except North East England, have gone up
- London has maximum average and median sales price
New Vs Not New Property Statistics
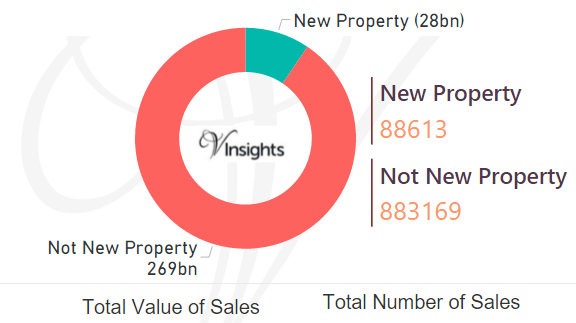
By Sales Value
- Sales value contributed by New Property was £28 billions (9.47%)
- Not New Property contributed £269 billions (90.53%).
By Number Of Sales
- New Properties sold were 88,613 (9.12%)
- Not New Properties sold were 88,3169 (90.88%)
Year on Year Comparison : Compared to England and Wales Property Market 2015
- New property market share in property market has gone down in 2016 over 2015
All England Posts
b7ecb640-c230-4b44-9c1a-4555ff263198|0|.0|27604f05-86ad-47ef-9e05-950bb762570c