For 2016 details - Bromley Property Market 2016
Story Highlights
- Bromley had total Property Sales of £2.92 billions in 2015.
- The total number of properties sold in year 2015 was 6365.
- The Average property price was £459 K in Bromley while Median was £373 K.
- Not New Property contributed 92.64% and New Property 7.36% by value
Total Sales By Property Type
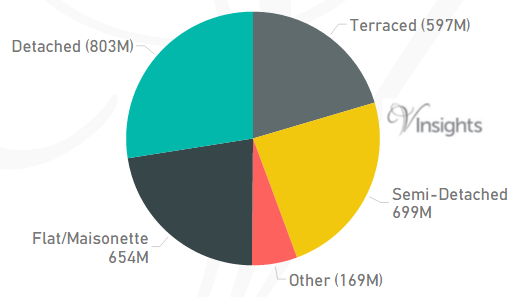
Bromley is one of the Boroughs of South London. It had total Property Sales of £2.92 billions which was 19.83% of South London Property Market 2015.
The split across the different property types are:
- Terraced £597 millions (20.43%)
- Semi-Detached £699 millions (23.93%)
- Other £169 millions (5.78%)
- Flat/Maisonette £654 millions (22.37%)
- Detached £803 millions (27.49%)
Total No Of Properties Sold By Property Type
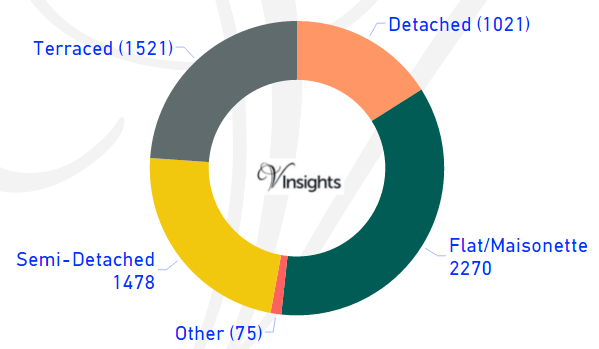
In Bromley the total number of properties sold in year 2015 was 6365.
The breakdown by different property types are:
- Terraced 1521 (23.9%)
- Semi-Detached 1478 (23.22%)
- Other 75 (1.18%)
- Flat/Maisonette 2270 (35.66%)
- Detached 1021 (16.04%).
Average & Median Sales Price
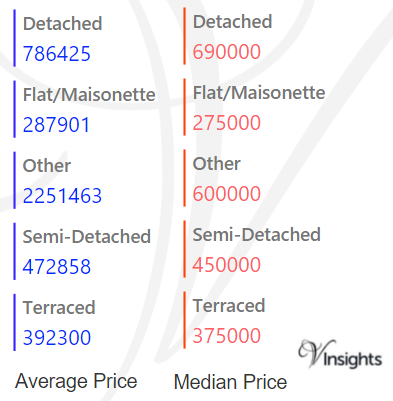
In 2015 the Average property price was £459 K in Bromley. The average price for the different property types are:
- Detached £786 K
- Flat/Maisonette £288 K
- Other £2.25 millions
- Semi-Detached £473 K
- Terraced £392 K
The Median Price was £373 K.The median property price for the different property types are
- Detached £690 K
- Flat/Maisonette £275 K
- Other £600 K
- Semi-Detached £450 K
- Terraced £375 K
New Vs Not New Property Statistics
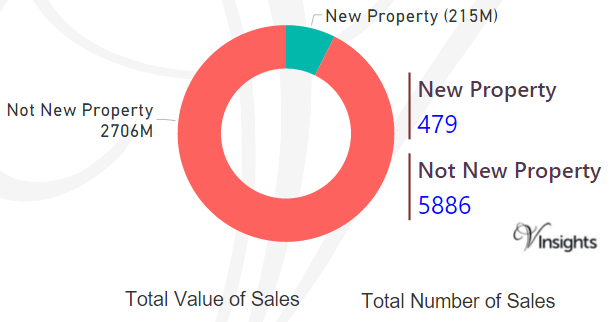
By Value Of Sales
- Not New Property contributed £2.71 billion (92.64%)
- New Property £215 millions (7.36%) giving combined total of £2.92 billions.
By Number Of Sales
- The number of Not New Property sold was 5886 (92.47%)
- The number of New Property sold was 479 (7.53%) giving combined total of 6365.
All London Posts

efd7028d-ace6-491d-9a7b-77af9907c476|0|.0|27604f05-86ad-47ef-9e05-950bb762570c
For 2016 details - Brent Property Market 2016
Story Highlights
- Brent had total Property Sales of £1.93 billions in 2015.
- The total number of properties sold in year 2015 was 3253.
- The Average property price was £548 K in Brent while Median was £405 K.
- Not New Property Contributed £1.66 billion (86.05%) and New Property 269 millions (13.95%) giving combined total of £1.93 billions.
- The number of Not New Property sold was 2807 (79.68%), whereas the number of New Property sold was 716 (20.32%) giving combined total of 3523.
Total Sales By Property Type
Brent is one of the Boroughs of West London. It had total Property Sales of £1.93 billions which was 12.47% of West London Property Market 2015.
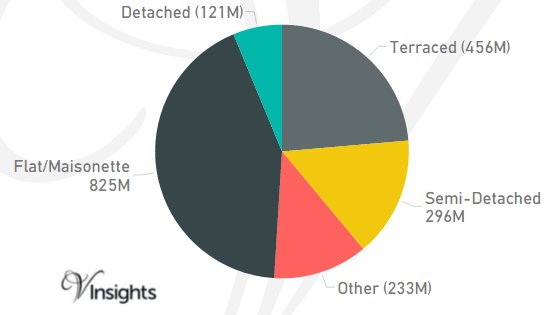
The split across the different property types are:
- Terraced: £456 millions (23.62%)
- Semi-Detached: £296 millions (15.32%)
- Other: £233 millions (12.05%)
- Flat/Maisonette: £825 millions (42.76%)
- Detached: £121 millions (6.25%).
Total No Of Properties Sold By Property Type
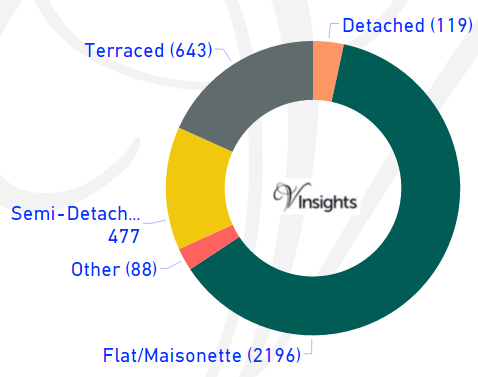
In Brent the total number of properties sold in year 2015 was 3523.
The breakdown by different property types are:
- Terraced: 643 (18.25%)
- Semi-Detached: 477 (13.54%)
- Other: 88 (2.5%)
- Flat/Maisonette: 2196 (62.33%)
- Detached: 119 (3.38%).
Average & Median Sales Price
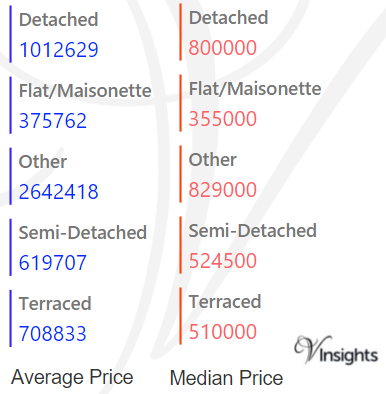
In 2015 the Average property price was £548 K in Brent. The average property price for the different property types are:
- Detached: £1.01 millions
- Flat/Maisonette: £376 K
- Other: £2.64 millions
- Semi-Detached: £620 K
- Terraced: £709 K.
The Median property price was £405 K. The median property price for the different property types are:
- Detached: £800 K
- Flat/Maisonette: £355 K
- Other: £829 K
- Semi-Detached: £525 K
- Terraced: £510 K.
New Vs Not New Property Statistics
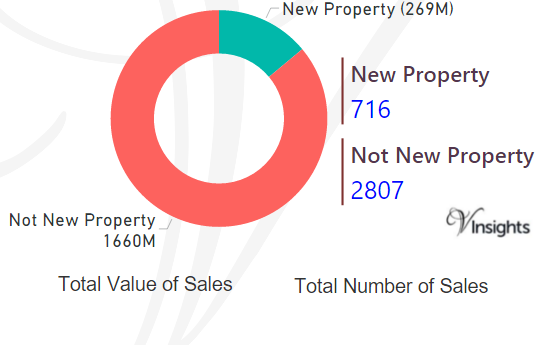
By Value Of Sales
- Not New Property Contributed £1.66 billion (86.05%)
- New Property 269 millions (13.95%) giving combined total of £1.93 billions.
By Number Of Sales
- The number of Not New Property sold was 2807 (79.68%)
- whereas the number of New Property sold was 716 (20.32%) giving combined total of 3523.
All London Posts
b19ac477-a296-4715-b420-ccfabdaa5d9e|0|.0|27604f05-86ad-47ef-9e05-950bb762570c
For 2016 details - Bexley Property Market 2016
Story Highlights
- Bexley had total Property Sales of £1.27 billions in 2015.
- The total number of properties sold in year 2015 was 4240.
- The Average property price was £300 K in Bexley, while Median was £275 K.
- Not New Property Contributed £1.149 billion (90.48%) and New Property 121 millions (9.52%) giving combined total of £1.27 billions.
- The number of Not New Property sold was 3709 (87.48%), whereas the number of New Property sold was 531 (12.52%) giving combined total of 4240.
Total Sales By Property Type
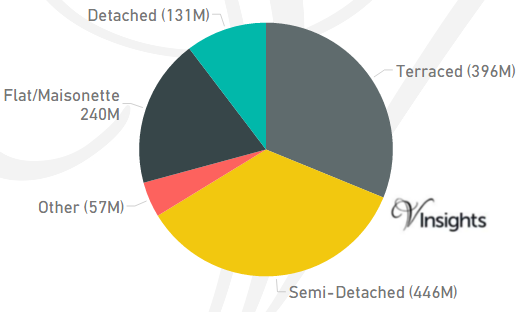
Bexley is one of the Boroughs of East London. It had total Property Sales of £1.27 billions which was 7.76% of East London Property Market 2015.
The split across the different property types are:
- Terraced £396 millions (31.18%)
- Semi-Detached £446 millions (35.08%)
- Other £57 millions (4.52%)
- Flat/Maisonette £240 millions (18.88%)
- Detached £131 millions (10.34%).
Total No Of Properties Sold By Property Type
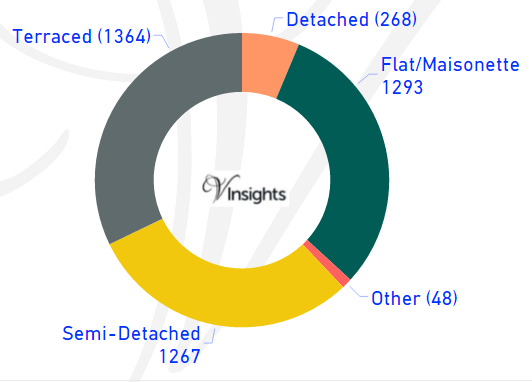
In Bexley the total number of properties sold in year 2015 was 4240. The breakdown by different property types are:
- Terraced 1364 (32.17%)
- Semi-Detached 1267 (29.88%)
- Other 48 (1.13%)
- Flat/Maisonette 1293 (30.5%)
- Detached 268 (6.32%).
Average & Median Sales Price
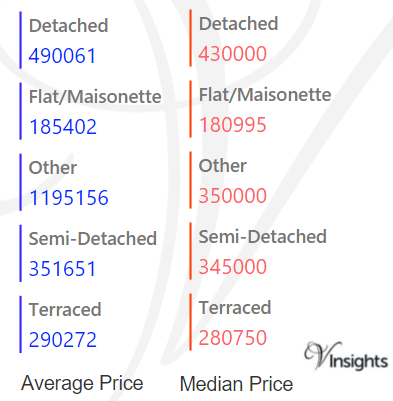
In 2015 the Average property price was £300 K in Bexley. The average property price for the different property types are:
- Detached £490 K
- Flat/Maisonette £185.4 K
- Other £1.195 millions
- Semi-Detached £352 K
- Terraced £290 K .
The Median Price was £275 K. The median property price for the different property types are:
- Detached £430 K
- Flat/Maisonette £181 K
- Other £350 K
- Semi-Detached £345 K
- Terraced £281 K.
New Vs Not New Property Statistics
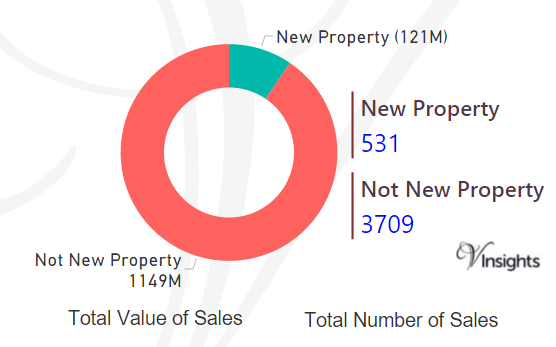
By Value Of Sales
- Not New Property Contributed £1.149 billion (90.48%)
- New Property 121 millions (9.52%) giving combined total of £1.27 billions.
By Number Of Sales
- The number of Not New Property sold was 3709 (87.48%)
- The number of New Properties sold was 531 (12.52%) giving combined total of 4240.
All London Posts
e6d38794-ce1b-43f8-8460-1ac9da1d1b00|0|.0|27604f05-86ad-47ef-9e05-950bb762570c
For 2016 details - Barnet Property Market 2016
Story Highlights
- Barnet had total property sales of £3.366 Billions in 2015
- The total number of properties sold was 5607
- In 2015 the Average property price was £600 K while Median Price was £445 K
- Not New Property Contributed 85.02% and New Property 14.98% by Sales Value
Total Sales By Property Type
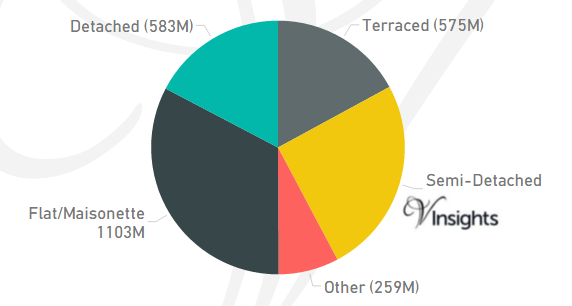
Barnet is one of the boroughs of North London. It had property sales of £3.366 Billions which was 48.22% of North London Property Market 2015 Property Market in 2015.
The split across the different property types are:
- Flat/Maisonette £1.103 billions (32.76%)
- Detached £583 millions (17.31%)
- Semi-Detached £847 millions (25.16%)
- Terraced £575 millions (17.08%)
- Other £259 millions (7.69%)
Total No Of Properties Sold By Property Type
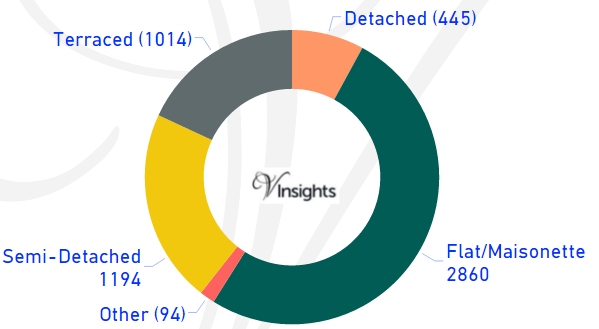
In Barnet the total number of properties sold in year 2015 was 5607. The breakdown by different property types are:
- Terraced 1014 (18.08%)
- Semi-Detached 1194 (21.29%)
- Other 94 (1.68%)
- Flat/Maisonette 2860 (51.01%)
- Detached 445 (7.94%)
Average & Median Sales Price
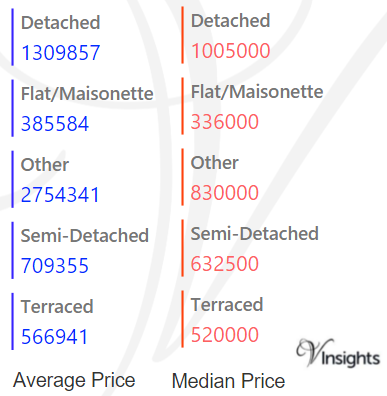
In 2015 the Average property price was £600 K in Barnet. The average price for the different property types was:
- Detached £1.31 millions
- Flat/Maisonette £386 K
- Other £2.75 millions
- Semi-Detached £709 K
- Terraced £567 K .
The Median Price in Barnet was £445 K. The median property price for the different property types was:
- Detached £1.0 million
- Flat/Maisonette £336 K
- Other £830 K
- Semi-Detached £633 K
- Terraced £520 K
New Vs Not New Property Statistics
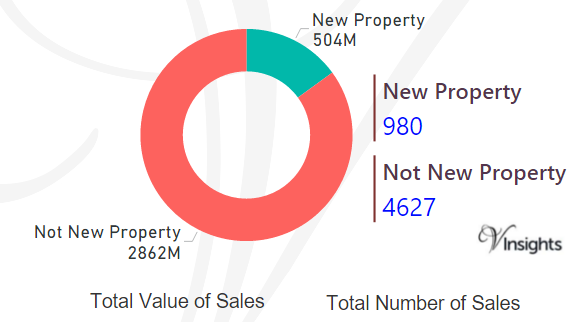
By Value Of Sales
- Not New Property contributed £2862 millions (85.02%)
- New Property 504 millions (14.98%) giving combined total of £3.366 Billions.
By Number Of Sales
- The number of Not New Property sold was 4627 (82.52%)
- The number of New Property sold was 980 (17.48%) giving combined total of 5607.
All London Posts
ab9a2fa0-fc04-4c60-be5c-d66a3e1917d6|0|.0|27604f05-86ad-47ef-9e05-950bb762570c
For 2016 details - Barking And Dagenham Property Market 2016
Story Highlights
- Barking and Dagenham in 2015 had total property sales of £719 millions.
- The total number of properties sold in year 2015 was 2604
- The Average property price was £276 K while median was £245 K
- Not New Property Contributed £664 millions (92.33%) and New Property 55 millions (7.67%) to the total sales giving combined total of £719 millions.
- The number of Not New Property sold was 2367 (90.9%), whereas the number of New Property sold was 237 (9.1%) giving combined total of 2604.
Barking and Dagenham is one of the boroughs of East London.
Total Sales By Property Type
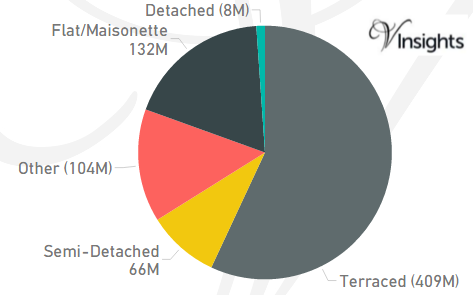
Barking And Dagenham is one of the boroughs of East London. It had property sales of £719 millions which was 4.39% of East London Property Market 2015.
The breakdown of £719 millions by different property in Barking And Dagenham was:
- Terraced 409 millions (56.95%)
- Detached £8 millions (1.1%)
- Flat/Maisonette £132 millions (18.39 %)
- Other £104 millions (14.41%)
- Semi-Detached £66 millions (9.15%).
Total No Of Properties Sold By Property Type
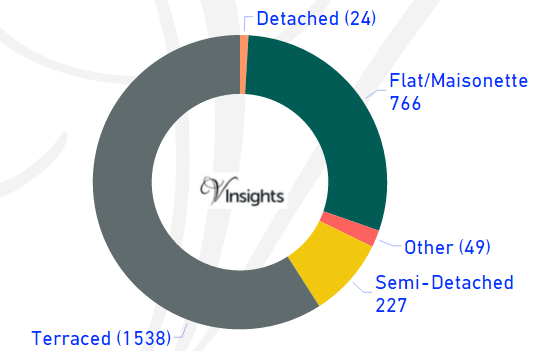
In Barking And Dagenham the total number of properties sold in year 2015 was 2604.
The breakdown by different property types are:
- Terraced 1538 (59.06%)
- Semi-Detached 227 (8.72%)
- Other 49 (1.88%)
- Flat/Maisonette 766 (29.42%)
- Detached 24 (0.92%).
Average & Median Sales Price
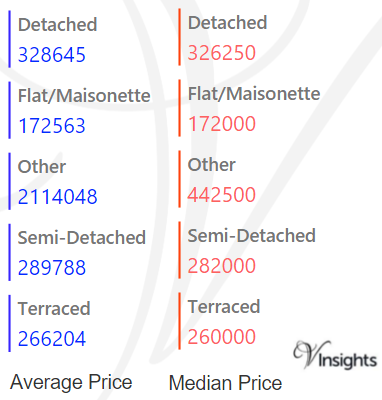
In 2015 the Average property price was £276 K in Barking and Dagenham.
The average property price for the different property types are:
- Detached £329 K
- Flat/Maisonette £173 K
- Other £2.11 millions
- Semi-Detached £290 K
- Terraced £266 K .
The Median Price in Barking and Dagenham was £245 K.
The median property price for the different property types are:
- Detached £326 K
- Flat/Maisonette £172 K
- Other £443 K
- Semi-Detached £282 K
- Terraced £260 K.
New Vs Not New Property Statistics
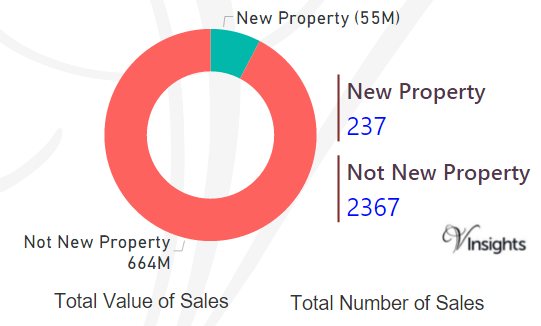
By Value Of Sales
- Not New Property contributed £664 millions (92.33%)
- New Property 55 millions (7.67%) giving combined total of £719 millions.
By Number Of Sales
- Not New Property sold was 2367 (90.9%)
- New Properties sold were 237 (9.1%) giving combined total of 2604.
All London Posts
f20dd4dd-5ff7-4009-8cf1-e290d4643801|0|.0|27604f05-86ad-47ef-9e05-950bb762570c