
Story Highlights
- East of England had total property sales of £36 billions in 2016.
- The total number of properties sold in 2016 was 112,401 properties.
- The total value of sales was maximum for Essex at £9.4 Billions
- The average sales price in East of England was £321 K, whereas median was £252 K
- The average sales at county level was maximum in Hertfordshire at £461 K
- New Property contributed 8.7%, whereas Not New Property contributed 91.3% by value
- Stamp duty hike caused monthly spike in March
- Brexit coupled with Stamp Duty Hike did not have major impact in East of England Property Market 2016
East of England is one of the 9 principal areas of England.
It consists of the counties: Thurrock, Southend-on-Sea, Essex, Hertfordshire, Luton, Bedford, Central Bedfordshire, Cambridgeshire, City Of Peterborough, Norfolk, Suffolk. Essex has the highest population in the region.
Total Sales By County
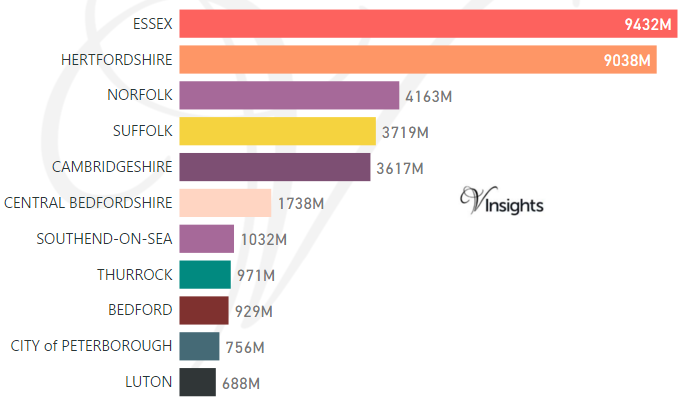
East of England had total property sales of £36 billions. It contributed 12.14% of the England Wales Property Market 2016.
The split across its counties as above.
Year on Year Comparison : Compared to East of England Property Market 2015 in 2016
- East of England property sales has shown growth of 5.88%
- All counties had growth over 2015 except City Of Peterborough
Total Value of Sales By Property Types
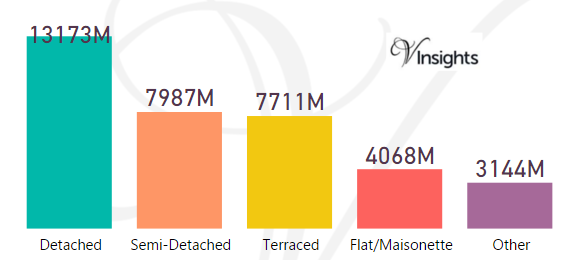
The split of £36 billions across the different property types are
- Detached at £13.17 billions (36.51%)
- Semi-Detached at £7.99 billions (22.14%)
- Terraced at £7.7 billions (21.37%)
- Flat/Maisonette at £4.07 billions (11.27%)
- Other at £3.14 billions (8.71%).
Year on Year Comparison : Compared to East of England Property Market 2015 in 2016
- All the property types sales have shown growth except Detached
Month-wise Break-up of Total Sales
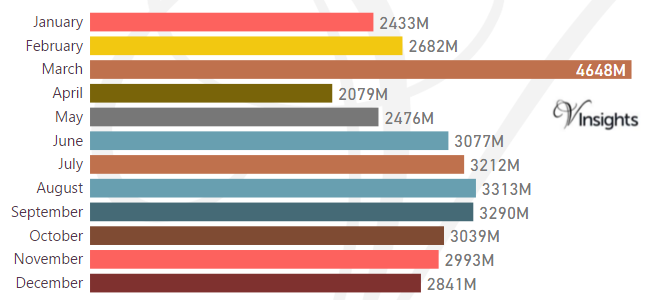
Some of the insights based on the £36 Billions month-wise break-down :
Stamp Duty Hike Impact
- March had property sale spike of £4.65 billions compared to £2.68 billions in Feb
- The impetus for it was to avoid the extra 3% in Stamp Duty Tax applicable on buying an additional home, being applicable from April 1 2016
Brexit Impact
- Brexit took place on 23rd June 2016.
- As can be observed from the month-wise break-up there does not seem to have been dip in property sales in the immediate aftermath of Brexit
- Year on Year growth has been 5.88%
- So Brexit does not seem to have had major impact on East Of England Property Market 2016
Total Number of Sales By Property Types
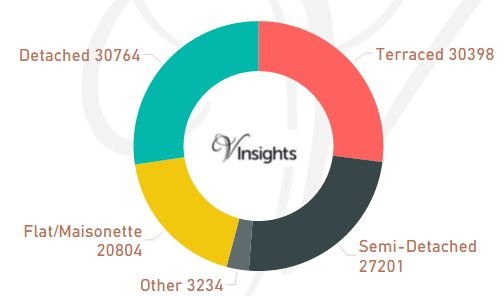
The total property sales of £36 Billions in 2016 was spread over 112,401 properties.
- Terraced properties was 30,398 (27.04%)
- Detached 30,764 (27.37%)
- Semi-Detached 27,201 (24.2%)
- Flat/Maisonette 20,804 (18.51%)
- Others 3,234 (2.88%)
Year on Year Comparison : Compared to East of England Property Market 2015 in 2016
- Total number of property sales in 2016 has decreased by 3.81%.
- All property types have shown decline in number of properties sold except property type Flat/Maisonette and Other.
- Other has shown significant increase of 83%
Average & Median Sales Price
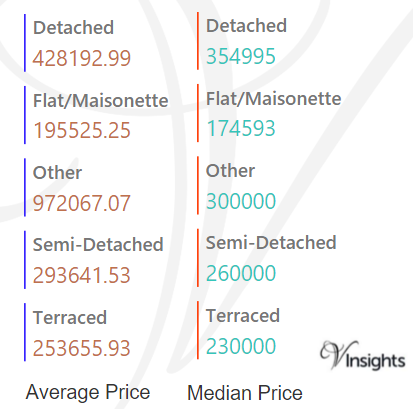
The average sales price in East of England was £321 K. For the different property types it was
- Detached at £428 K,
- Semi-Detached at £294 K,
- Terraced at £254 K,
- Flat/Maisonette at £196 K
- Other it is at £972 K
Median sales price in East of England was £252 K. For different property types it was
- Detached at £355 K,
- Semi-Detached at £260 K,
- Terraced at £230 K,
- Flat/Maisonette at £175 K
- Other it is at £300 K
Year on Year Comparison : Compared to East of England Property Market 2015 in 2016
- The average and median property prices have gone up except for property type Other
- Other has had decline in average and median property price
Average & Median Sales Price By County
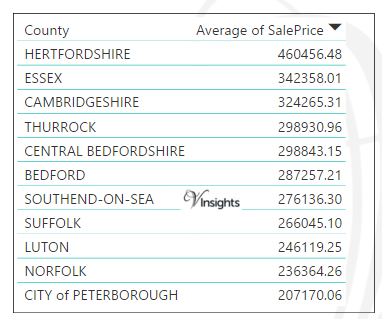
The average of sales price at county level in East Of England in 2016 is as above.
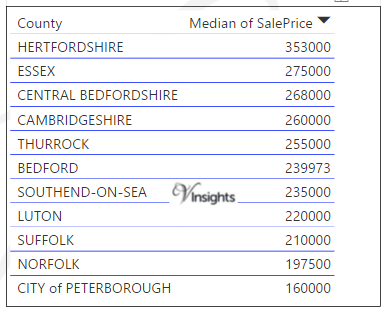
The median of sales price at county level in East Of England in 2016 is as above.
Year on Year Comparison : Compared to East of England Property Market 2015 in 2016
- The average and median sales price across all the counties have gone up except for City Of Peterborough
- The median sales price across all the counties have gone up
New Vs Not New Property Statistics
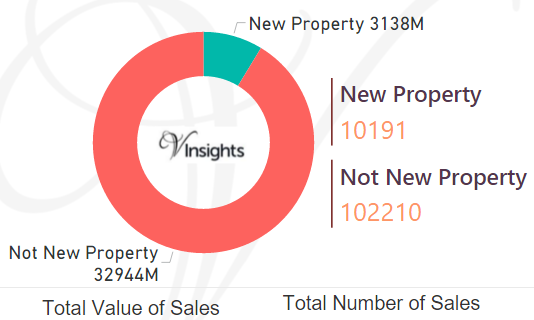
By Value Of Sales
- The sales value contributed by New Property was £3.14 billions (8.7%)
- where as Not New Property contributed £32.9 billions (91.3%).
By Number Of Sales
- New properties sold were 10,191 (9.07%)
- where as not new property sold were 102,210 (90.93%).
Year on Year Comparison : Compared to East of England Property Market 2015 in 2016
- New property market share in property market has gone down in 2016 over 2015
All East of England Posts

27e8b442-dcec-41bd-944d-c28415bf80a9|0|.0|27604f05-86ad-47ef-9e05-950bb762570c