Story Highlights
London is broadly divided into Central London, East London, West London, North London and South London
Total Value & Number Of Sales By Region
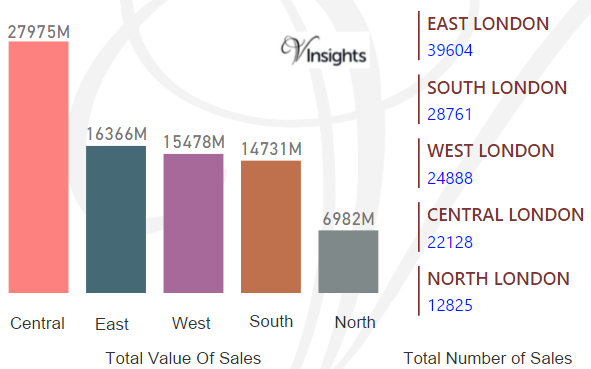
London in 2015 had total property sales of £82 billions.The split across the different regions are:
Similarly London in 2015 had total number of sales of 128,206. The split across the different London regions:
Flat/Maisonette Total Value & Number Of Sales By Region
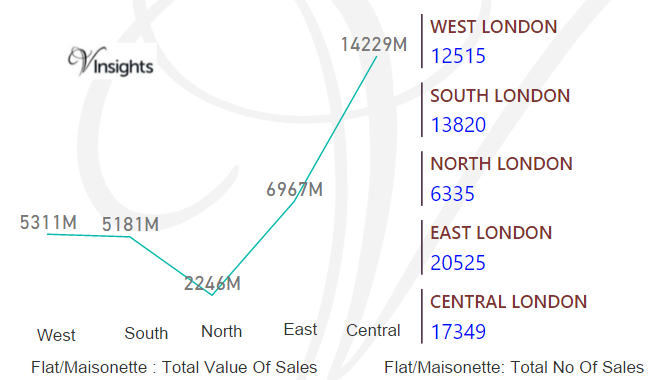
London in 2015 had total Flat/Maisonette sales of £34 Billions.
Similarly London in 2015 had total number of Flat/Maisonette sold was 70,544.
Detached Total Value & Number Of Sales By Region
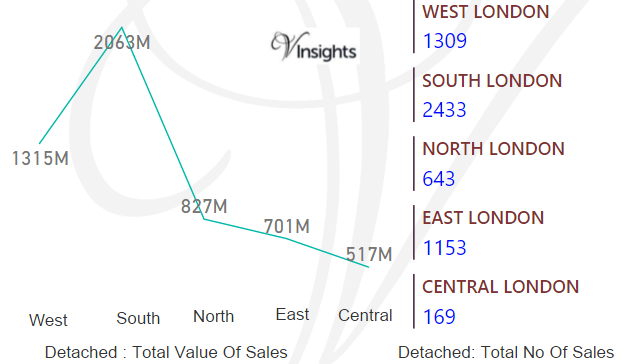
London in 2015 had total Detached sales of £5 billions.
Similarly London in 2015 the total number of detached property sold was 5,707.
Semi-Detached Total Value & Number Of Sales By Region
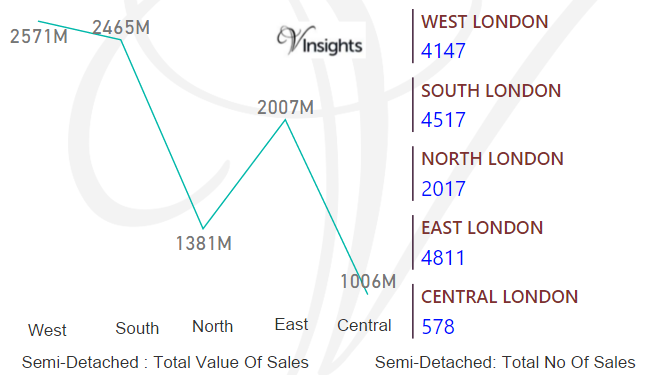
London in 2015 had total Semi-Detached sales of £9 billions.
Similarly London in 2015 the total number of Semi-Detached property sold was 16,070.
Terraced Total Value & Number Of Sales By Region
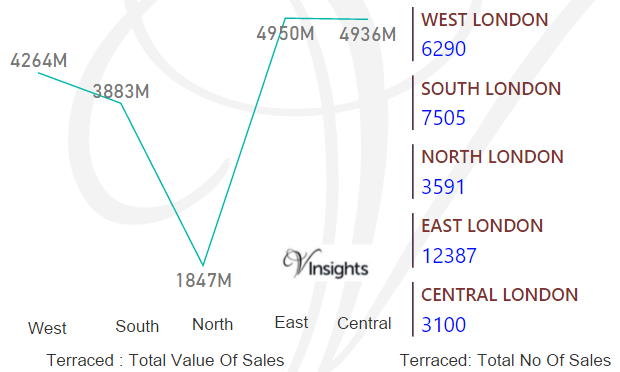
London in 2015 had total Terraced property sales of £20 billions.
Similarly London in 2015 the total number of Terraced property sold was 32,873.
Other Total Value & Number Of Sales By Region
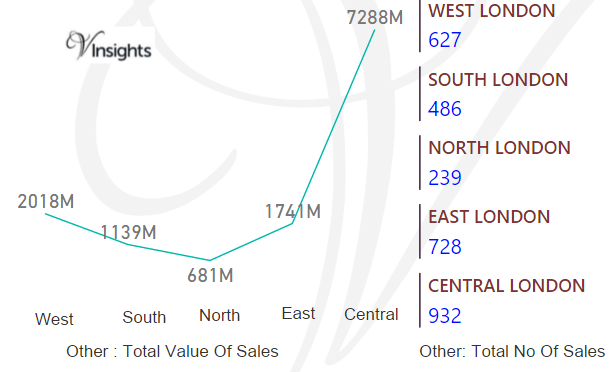
London in 2015 had total Other property sales of £13 billions.
Similarly London in 2015 the total number of Other property sold was 3,012.
Average & Median Value of Property By Region
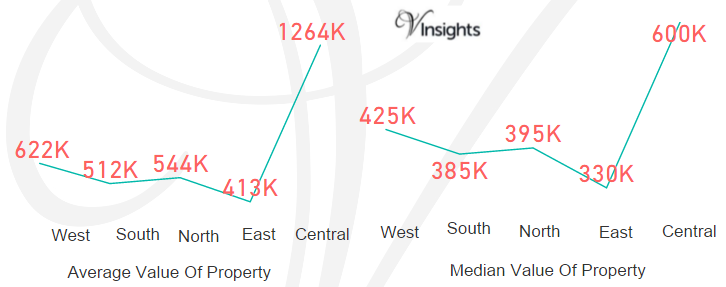
The average sales price in London was £636 K. For the different regions it was:
Similarly the median sales price in London was £399 K. For the different regions it was:
All London Posts

2fcb6384-62b7-40ef-ad1d-fcd24a460464|4|4.0|27604f05-86ad-47ef-9e05-950bb762570c

For 2016 details - West London Property Market 2016
Story Highlights
- West London in 2015 had total property sales of £15 billions
- Hammersmith And Fulham was the leader contributing £3.13 billions (20.23%)
- The total number of properties sold in West London 2015 was 24,888
- The average sales price in West London was £622 K and the median sales price was £425 K
- The average sales price in West London was maximum for the borough of Hammersmith And Fulham £1.12 millions and minimum for Hillingdon at £453 K.
- The median sales price in West London was maximum for the borough of Hammersmith And Fulham £730 K and minimum for Hillingdon at £350 K.
- The sales value contributed by New Property was £1.7 billions (10.2%) where as Not New Property contribute £13.78 billions (89.8 %)
West London boroughs are Brent, Ealing, Hammersmith & Fulham, Harrow, Hillingdon, Hounslow and Richmond upon Thames.
Total Sales By Property Type
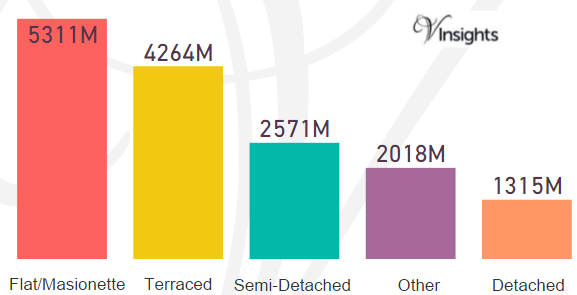
West London in 2015 had total property sales of £15 billions. It was 18.98% of the London Property Market 2015.
The split across the different property types are:
- Detached at £1.32 billions (8.5%)
- Semi-Detached at £2.57 billions (16.6%)
- Terraced at £4.264 billions (27.55 %)
- Other at £2.02 billions (13.04%)
- Flat/Maisonette at £5.3 billions (34.31%).
Total Sales By Borough
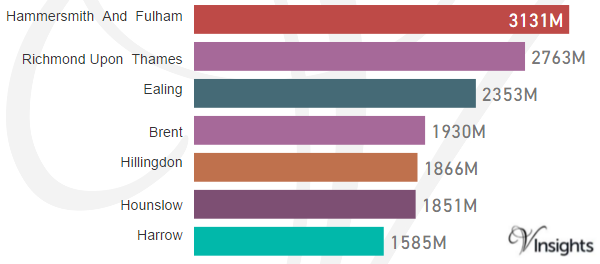
The total sales of £15 billions in 2015 was split across its borough as above.
Total Number Of Sales By Property Types
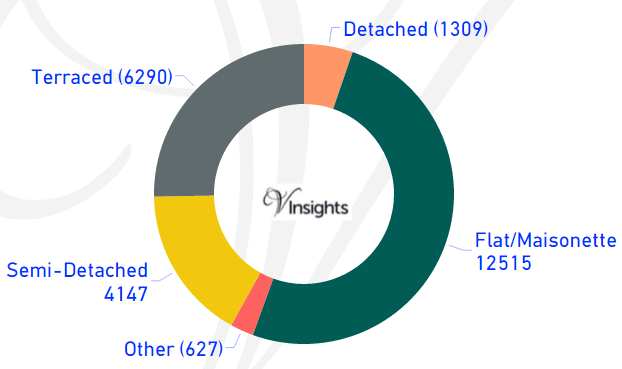
The total number of properties sold in West London 2015 was 24,888.
- Detached 1,309 (5.26%)
- Semi-Detached 4,147 (16.66%)
- Terraced 6,290 (25.27%)
- Flat/Maisonette 12,515 (50.29%)
- Other 627(2.52%)
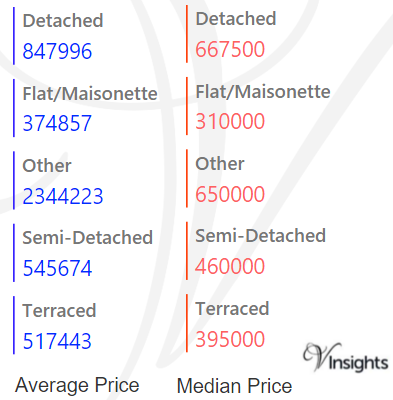
Average & Median Sales Price

The average sales price in West London was £622 K. For the different property types it was:
- Detached £848 K
- Semi-Detached £546 K
- Terraced £517 K
- Flat/Maisonette £375 K
- Other it was £2.34 millions.
Similarly the median sales price in West London was £425 K. For the different property types it was:
- Detached £668 K
- Semi-Detached £460 K
- Terraced £395 K
- Flat/Maisonette £310 K
- Other it was £650 K.
Average & Median Sales Price By Borough
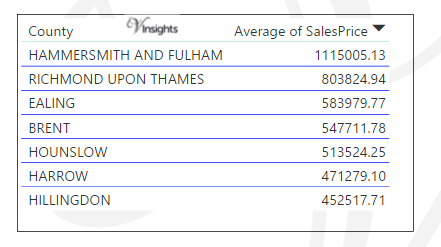
The average sales prices in West London at Borough level is as above.
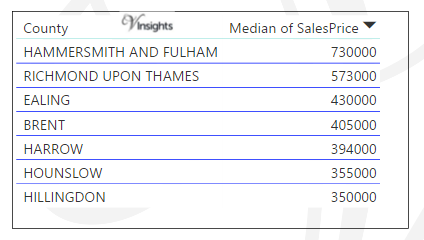
The average median prices in West London at Borough level is as above.
New Vs Not New Property Statistics
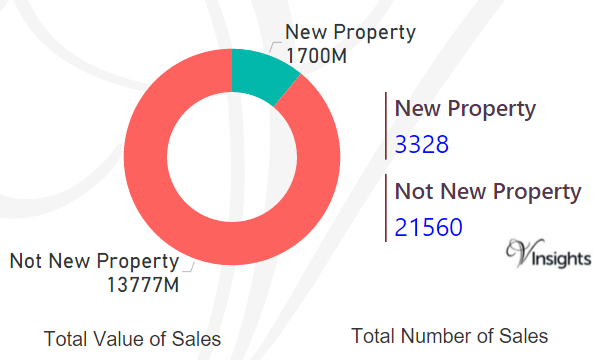
By Value Of Sales
- The sales value contributed by New Property was £1.7 billions (10.2%)
- where as Not New Property contribute £13.78 billions (89.8 %).
By Number Of Sales
- New properties sold were 3,328 (9.35%)
- where as not new property sold were 21,560 (90.65%).
All London Posts
499e2735-ca1b-4014-a0bb-568d3bdfb84b|0|.0|27604f05-86ad-47ef-9e05-950bb762570c

For 2016 details - South London Property Market 2016
Story Highlights
- South London in 2015 had total property sales of £15 billions
- Wandsworth was the leader contributing £4.6 billions (30.94%)
- The total number of property sold in South London 2015 was 28,761
- The average sales price in South London was £512 K and the median sales price was £385 K
- The average sales prices was maximum in the Borough of Wandsworth £703 K
- The sales value for New Property was 9.66% where for Not New Property was 90.34 %
South London is the southern part of London. South London boroughs in Greater London are Bromley, Croydon, Kingston upon Thames, Merton, Sutton and Wandsworth.
Total Sales By Property Type
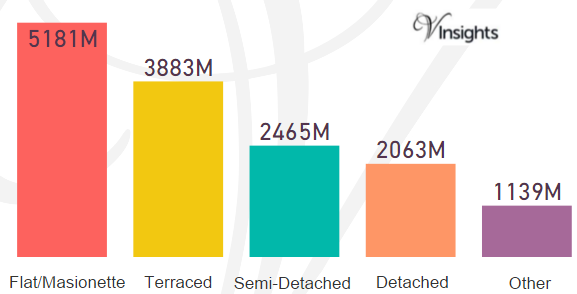
South London in 2015 had total property sales of £15 billions. It was 18.07% of the London Property Market 2015.
The split across the different property types are:
- Detached: £1.14 billions (14.01%)
- Semi-Detached: £2.063 billions (16.73%)
- Terraced: £3.88 billions (26.36%)
- Other: £1.14 billions (7.73%)
- Flat/Maisonette: £5.18 billions (35.17%)
Total Sales By Borough
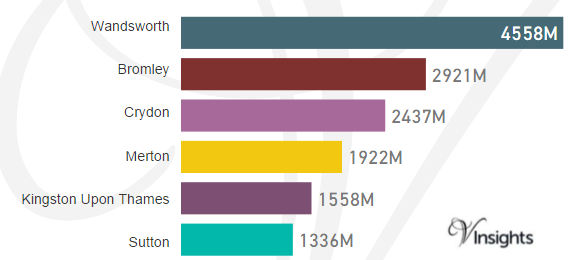
The total sales of £15 billions in 2015 was split across its borough as above.
Total Number Of Sales By Property Types
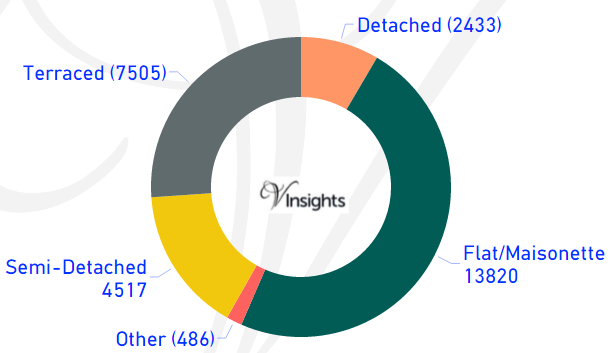
The total number of properties sold in South London 2015 was 28,761. It is split as:
- Detached: 2,433 (8.46%)
- Semi-Detached: 4,517 (15.71%)
- Terraced: 7,505 (26.09%)
- Flat/Maisonette: 13,820 (48.05%)
- Other: 486 (1.69%)
Average & Median Sales Price
The average sales price in South London was £512 K. For the different property types it was:
- Detached: £848 K
- Semi-Detached: £546 K
- Terraced: £517 K
- Flat/Maisonette: £375 K
- Other it is £2.34 millions.
Similarly the median sales price in South London was £385 K. For the different property types it was:
- Detached: £668 K
- Semi-Detached: £460 K
- Terraced: £395 K
- Flat/Maisonette: £310 K
- Other it is £650 K.
Average & Median Sales Price By Borough
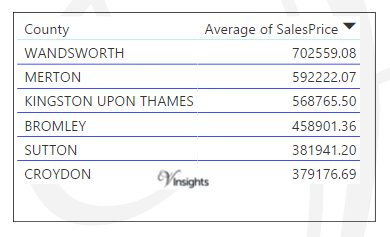
In South London the Average Sales Price is as above.
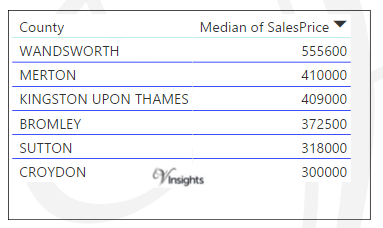
In South London the Median Sales Price is as above.
New Vs Not New Property Statistics
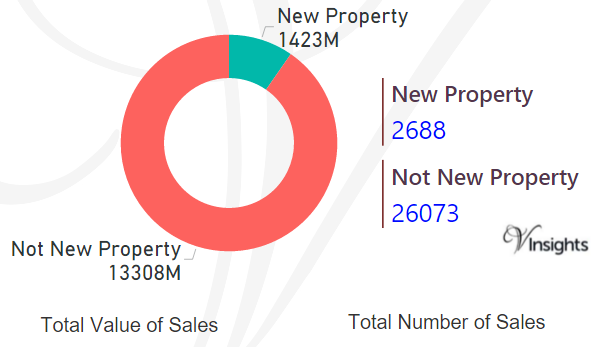
By Value Of Sales
- The sales value contributed by New Property was £1.423 billions (9.66%)
- Not New Property contributed £13.31 billions (90.34 %).
By Number Of Sales
- New properties sold were 2,688 (9.35%)
- Not new property sold were 26,073 (90.65%).
All London Posts
5b0a720c-5124-4b7d-a5c1-c94186511bad|0|.0|27604f05-86ad-47ef-9e05-950bb762570c

For 2016 details - North London Property Market 2016
Story Highlights
North London is the northern part of London. It comprises of Barnet, Enfield and Haringey
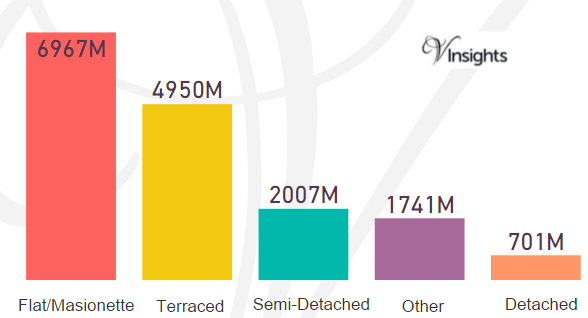
Total Sales By Property Type
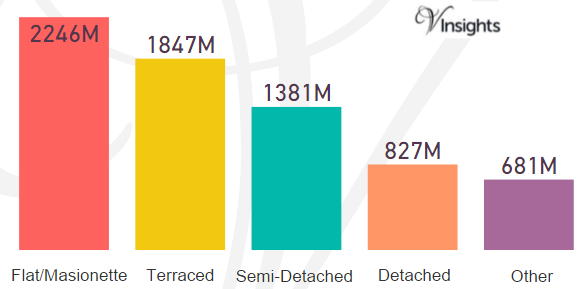
North London in 2015 had total property sales of £7 billions.The split across the different property types are:
- Detached: £827 millions (11.84%)
- Semi-Detached: £1.38 billions (19.78%)
- Terraced: £1.85 billions (26.45 %)
- Other: £681 million (9.75%)
- Flat/Maisonette: £2.25 billions (32.17%)
Total Sales By Borough
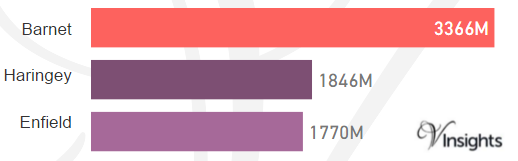
The total sales of £7 billions in 2015 was split across its borough as above.
Total Number Of Sales By Property Types
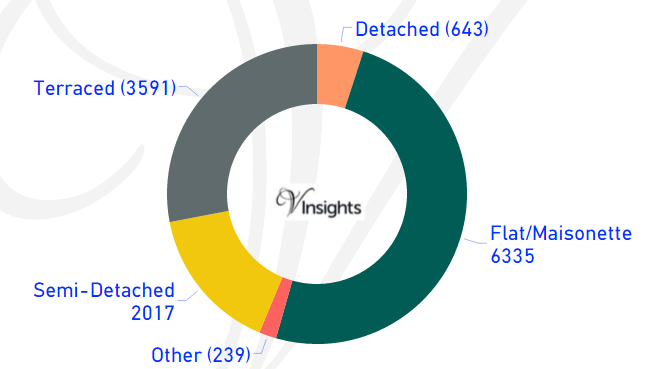
The total number of property sold in North London 2015 was 12,825. It is split as:
- Detached: 643 (5.01%)
- Semi-Detached: 2,017 (15.73%)
- Terraced: 3,591(28%)
- Flat/Maisonette: 6,335 (49.4%)
- Other: 239(15.73%)
Average & Median Sales Price
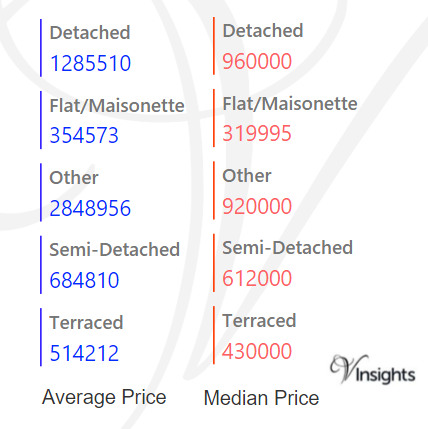
The average sales price in North London was £544 K. For the different property types it was:
- Detached: £1.286 millions
- Semi-Detached: £685 K
- Terraced: £514 K
- Flat/Maisonette: £355 K
- Other it is £2.85 millions.
Similarly the median sales price in North London was £395 K. For the different property types it was:
- Detached: £960 K
- Semi-Detached: £612 K
- Terraced: £430 K
- Flat/Maisonette: £320 K
- Other it is £920 K
Average & Median Sales Price By Borough
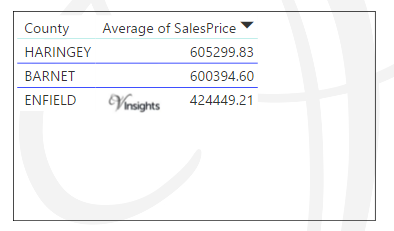
In North London the Average of Sales Price is as above.
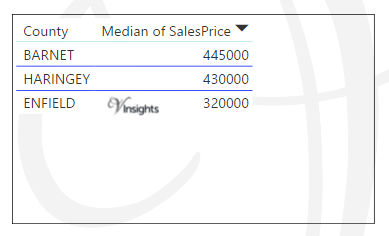
In North London the Median of Sales Price is as above.
New Vs Not New Property Statistics
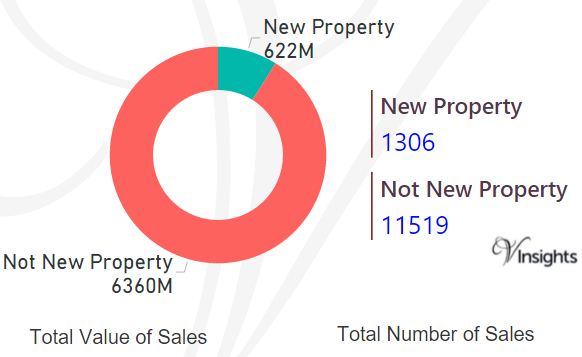
By Value Of Sales
- The sales value contributed by New Property was £622 millions (8.91%)
- Not New Property contributed £6.36 billions (91.09 %).
By Number Of Sales
- New properties sold were 1,306 (10.18%)
- Not new property sold were 11,519 (89.82%).
All London Posts
6552010f-a2c1-43ed-bf69-0bea9fc1fa49|1|5.0|27604f05-86ad-47ef-9e05-950bb762570c

For 2016 details - East London Property Market 2016
Story Highlights
- East London in 2015 had total property sales of £16 billions
- Tower of Hamlets was the leader contributing £2.6 billions (15.66%)
- The total number of property sold in East London 2015 was 39,604
- The average sales price in East London was £413 K and the median sales price was £330 K
- The average sales price in East London at borough level was maximum in Hackney at £611 K
- New Property contributed 13.84% by value where as Not New 86.16%
East London comprises of the boroughs of Barking and Dagenham, Bexley, Greenwich, Hackney, Havering, Lewisham, Newham, Redbridge, Tower Hamlets, Waltham Forest.
Total Sales By Property Type
East London in 2015 had total property sales of £16 billions. It is 20.07% of London Property Market 2015.
The split across the different property types are:
- Detached: £701 millions (4.28%)
- Semi-Detached: £2.007 billions (12.26%)
- Terraced: £4.95 billions (30.25 %)
- Other: £1.74 billions (10.64%)
- Flat/Maisonette: £6.97 billions (42.57%).
Total Sales By Borough
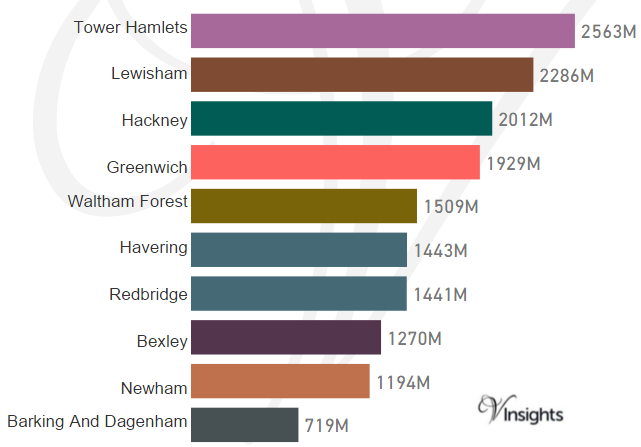
The total sales of £16 billions in East London 2015 was split across its borough as above.
Total Number Of Sales By Property Types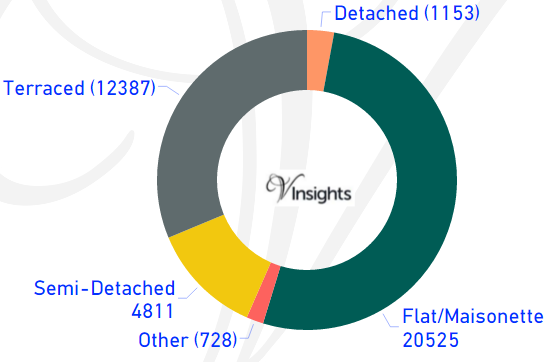
The total number of properties sold in East London 2015 was 39,604. It is split as
- Detached: 1,153 (2.91%)
- Semi-Detached: 4,811 (12.15%)
- Terraced: 12,387(31.28%)
- Flat/Maisonette: 20,525 (51.83%)
- Other: 728(1.84%)
Average & Median Sales Price

The average sales price in East London was £413 K. For the different property types it was:
- Detached: £608 K
- Semi-Detached: £417 K
- Terraced: £400 K
- Flat/Maisonette: £339 K
- Other it is £2.39 millions.
Similarly the median sales price in East London was £330 K. For the different property types it was:
- Detached: £510 K
- Semi-Detached: £365 K
- Terraced: £340 K
- Flat/Maisonette: £305 K
- Other it is £600 K.
Average & Median Sales Price By Borough
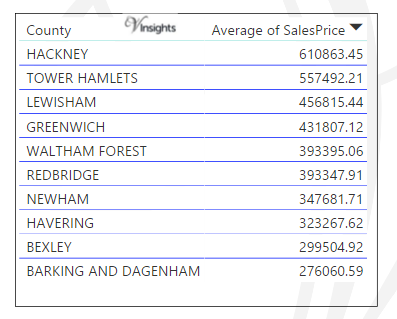
East London average sales price at borough level is as above.
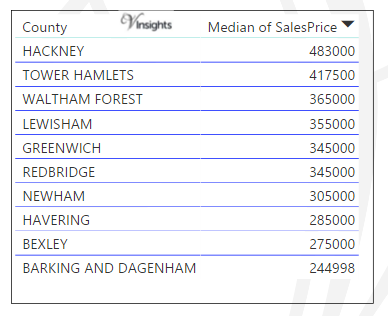
East London median sales price at borough level is as above.
New Vs Not New Property Statistics
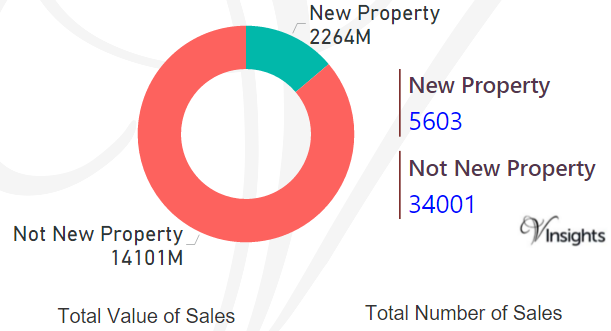
By Value Of Sales
- The sales value contributed by New Property was £2.264 billions (13.84%)
- Not New Property contributed £14.1 billions (86.16 %).
By Number Of Sales
- New properties sold were 5,603 (14.15%)
- where as not new property sold were 34,001 (85.85%).
All London Posts
1ccbb00c-c6de-4110-b2b3-98380ad330be|1|5.0|27604f05-86ad-47ef-9e05-950bb762570c