Story Highlights
- Norfolk had total property sales of £3.9 Billions in 2015.
- The total number of properties sold in 2015 in Essex was 17,734
- The total volume of sales at district level was maximum for South Norfolk at £658 millions
- The average sales price in Norfolk was £221 K whereas median was £185 K
- The average sales at district level was maximum for North Norfolk at £244 K
- Similarly the median of sales price at district level was maximum for Broadland at £212 K
- New Property sales in Norfolk contributed 9.41% and Not New Property contributed 90.59%
Norfolk is a county in East of England. The districts in Norfolk are South Norfolk, Breckland, Broadland, Great Yarmouth, King's Lynn and West Norfolk, North Norfolk, Norwich.
Total Sales By Districts
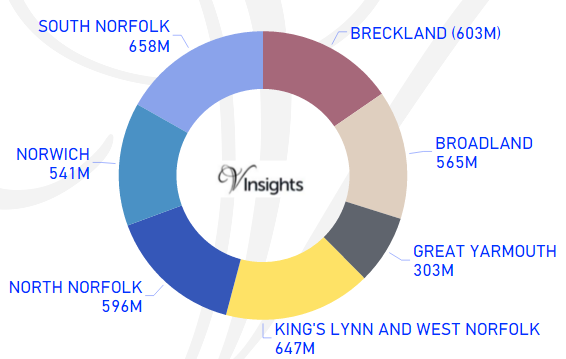
Norfolk has total sales of £3.9 Billions. It was 11.36% of East England Property Market 2015.
The split across its districts is as follow:
- South Norfolk was maximum at £658 millions (16.81%)
- King's Lynn and West Norfolk at £647 millions (16.53%)
- Breckland at £603 millions (15.41%)
- North Norfolk at £596 millions (15.24%)
- Broadland at £565 millions (14.44%)
- Norwich at £541 millions (13.82%)
- With minimum for Great Yarmouth at £303 millions (7.74%)
Total Sales By Property Type
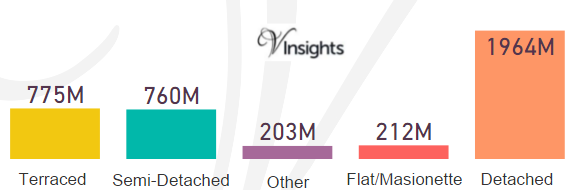
The split of £3.9 Billions across the different property types in Norfolk are:
- Detached at £1.964 billions (50.18%)
- Terraced at £775 millions (19.81%)
- Semi-Detached at £760 millions (19.41%)
- Flat/Maisonette at £212 millions (5.41%)
- Other at £203 millions (5.18%)
Total No Of Properties Sold By Property Type
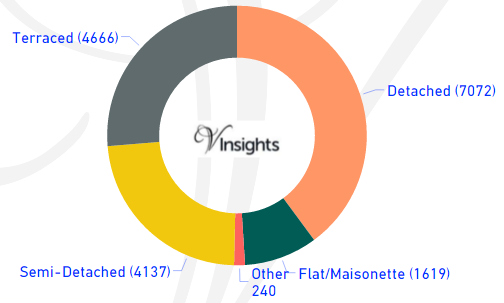
The total property sales of £3.9 Billions in 2015 was spread over 17,734 properties.
- Terraced properties at 4,666 (26.31%)
- Detached at 7,072 (39.88%)
- Semi-Detached at 4,137 (23.33%)
- Flat/Maisonette at 1,619 (9.13%)
- Others at 240 (1.35%).
Average & Median Sales Price
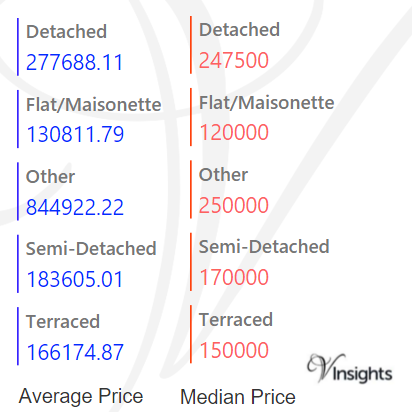
The average sales price in Norfolk was £221 K. For the different property types it was:
- Detached at £278 K
- Semi-Detached at £184 K
- Terraced at £166 K
- Flat/Maisonette at £131 K
- Other it is at £845 K.
Similarly median sales price in Norfolk was £185 K. For the different property types it was:
- Detached at £248 K
- Semi-Detached at £170 K
- Terraced at £150 K
- Flat/Maisonette at £120 K
- Other it is at £250 K
Average & Median Sales Price By Districts
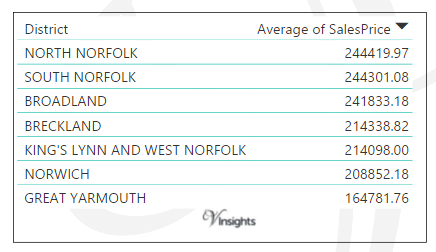
The average sales prices at district level in Essex for 2015 is as follows:
- North Norfolk was maximum at £244 K
- South Norfolk at £244 K
- Broadland at £242 K
- Breckland at £214 K
- King's Lynn and West Norfolk at £214 K
- Norwich at £209 K
- With minimum for Great Yarmouth at £165 K
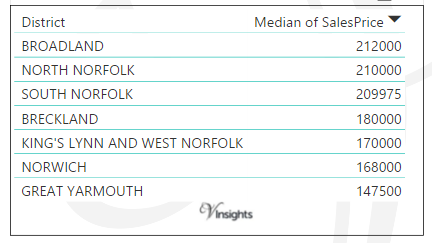
The average median sales prices at district level in Essex for 2015 is as follows:
- Broadland was maximum at £212 K
- North Norfolk at £210 K
- South Norfolk at £210 K
- Breckland at £180 K
- King's Lynn and West Norfolk at £170 K
- Norwich at £168 K
- With minimum for Great Yarmouth at £148 K
New Vs Not New Property Statistics
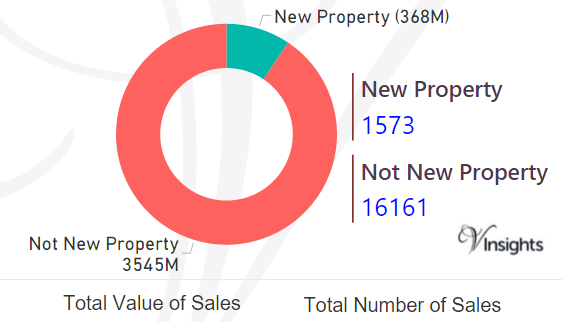
By Sales Values the split is as follows:
- New Properties contributed £368 millions (9.41%)
- Not New Property contributed £3.6 billions (90.59%)
By Total Number the split is as follows:
- New properties sold were 1,573 (8.87%)
- Not new property sold were 16,161 (91.13%).
All Norkfolk Posts

a979e9d1-f86a-46f8-8fe3-4d306ffa1cdc|0|.0|27604f05-86ad-47ef-9e05-950bb762570c