For 2016 details - Islington Property Market 2016
Story Highlights
- Islington had total Property Sales of £2.21 billions in 2015.
- The total number of properties sold in year 2015 was 2597.
- The Average property price was £851 K millions while Median was £580 K.
-
Not New Property contributed £2.064 billion (93.4%) and New Property 146 millions (6.6%) giving combined total of £2.21 billions.
-
The number of Not New Property sold was 2376 (91.49%), whereas the number of New Property sold was 221 (8.51%) giving combined total of 2597.
Total Sales By Property Type
Islington is one of the Boroughs of Central London. It had total Property Sales of £2.21 billions which was 7.9% of Central London Property Market 2015.
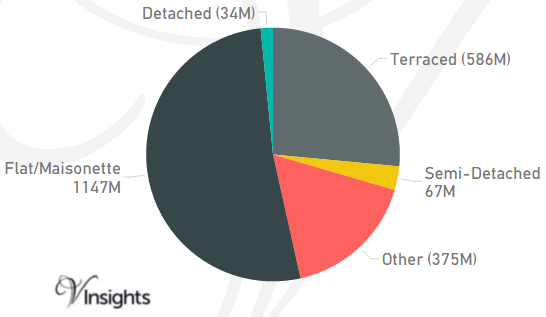
The split across the different property types are:
- Terraced £586 millions (26.5%)
- Semi-Detached £67 millions (3.02%)
- Other £375 millions (16.99%)
- Flat/Maisonette £1.147 billions (51.93%)
- Detached £34 millions (1.56%)
Total No Of Properties Sold By Property Type
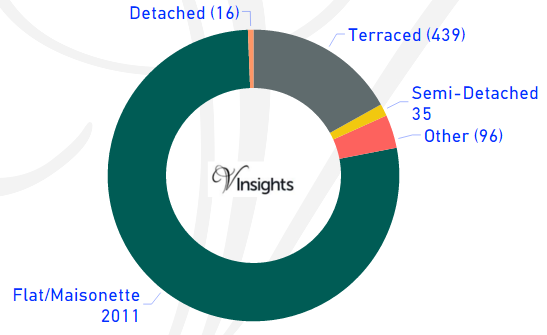
In Islington the total number of properties sold in year 2015 was 2597. The breakdown by different property types are:
- Terraced 439 (16.9%)
- Semi-Detached 35 (1.35%)
- Other 96 (3.7%)
- Flat/Maisonette 2011 (77.44%)
- Detached 16 (0.62%)
Average & Median Sales Price
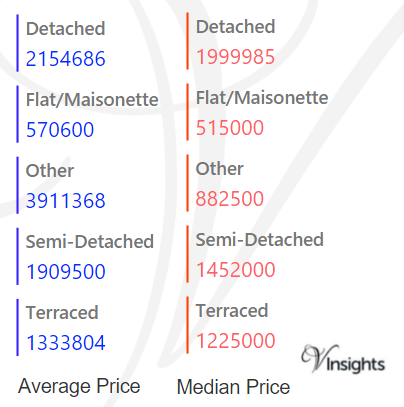
In 2015 the Average property price was £851 K in Islington. The average price for the different property types are:
- Detached £2.155 millions
- Flat/Maisonette £571 K
- Other £3.9 millions
- Semi-Detached £1.91 millions
- Terraced £1.33 millions
The Median Price was £580 K. The median property price for the different property types are:
- Detached £2 millions
- Flat/Maisonette £515 K
- Other £883 K
- Semi-Detached £1.45 millions
- Terraced £1.23 millions
New Vs Not New Property Statistics
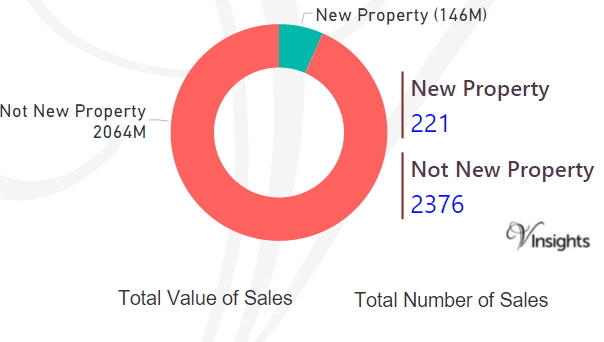
By Value Of Sales
- Not New Property contributed £2.064 billion (93.4%)
- New Property 146 millions (6.6%) giving combined total of £2.21 billions.
By Number Of Sales
- The number of Not New Property sold was 2376 (91.49%)
- The number of New Properties sold was 221 (8.51%) giving combined total of 2597.
All London Posts
379ee4d7-2df4-4cba-adc2-52affdb6074a|0|.0|27604f05-86ad-47ef-9e05-950bb762570c
For 2016 details - Hounslow Property Market 2016
Story Highlights
- Hounslow had total Property Sales of £1.85 billions in 2015.
- The total number of properties sold in year 2015 was 3604.
- The Average property price was £514 K while Median was was £355 K.
- Not New Property contributed 84.46% and New Property 15.54% by sales value
Total Sales By Property Type
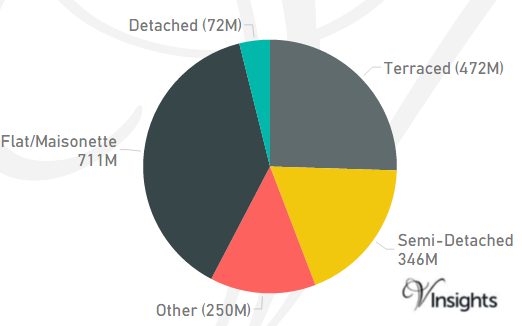
Hounslow is one of the Boroughs of West London. It had total Property Sales of £1.85 billions which was 11.96% of West London Property Market 2015.
The split across the different property types are:
- Terraced: £472 millions (25.49%)
- Semi-Detached: £346 millions (18.69%)
- Other: £250 millions (13.49%)
- Flat/Maisonette: £711 millions (38.43%)
- Detached: £72 millions (3.9%).
Total Number Of Sales By Property Types
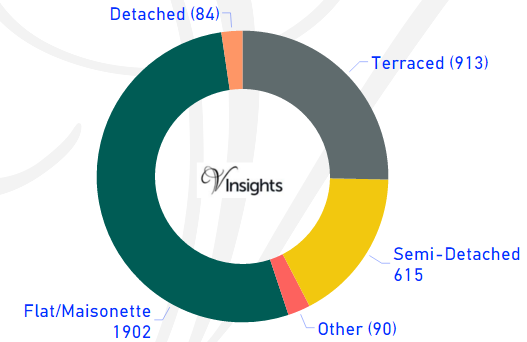
In Hounslow the total number of properties sold in year 2015 was 3604. The breakdown by different property types are:
- Terraced: 913 (25.33%)
- Semi-Detached 615 (17.06%)
- Other 90 (2.5%)
- Flat/Maisonette 1902 (52.77%)
- Detached 84 (2.33%).
Average & Median Sales Price
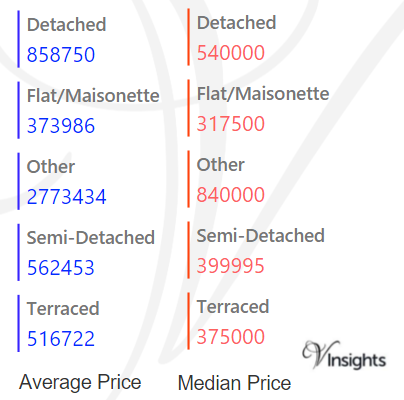
In 2015 the Average property price was £514 K in Hounslow. The average price for the different property types are:
- Detached £859 K
- Flat/Maisonette £374 K
- Other £2.8 millions
- Semi-Detached £563 K
- Terraced £517 K.
The Median property price was £355 K. The median property price for the different property types are:
- Detached £540 K
- Flat/Maisonette £318 K
- Other £840 K
- Semi-Detached £400 K
- Terraced £375 K.
New Vs Not New Property Statistics
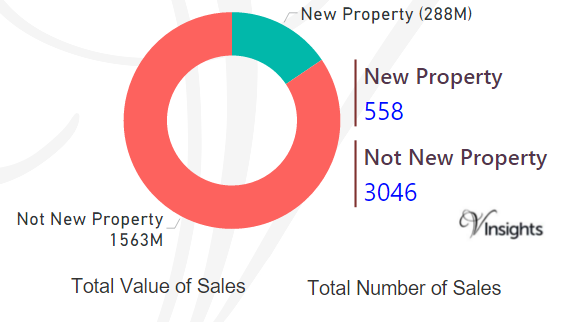
By Value Of Sales
- Not New Property Contributed £1.56 billion (84.46%)
- New Property 288 millions (15.54%) giving combined total of £1.85 billions.
By Number Of Sales
- The number of Not New Property sold was 3046 (84.52%)
- whereas the number of New Properties sold were 558 (15.48%) giving combined total of 3604.
All London Posts
eee3706e-24ac-45ce-b0c7-424884e36575|0|.0|27604f05-86ad-47ef-9e05-950bb762570c
For 2016 details - Hillingdon Property Market 2016
Story Highlights
- Hillingdon had total Property Sales of £1.9 billions in 2015.
- The total number of properties sold in year 2015 was 4124.
- The Average property price was £453 K while Median was was £350 K.
- Not New Property contributed 90.79% and New Property 9.21% by sales value
Total Sales By Property Type
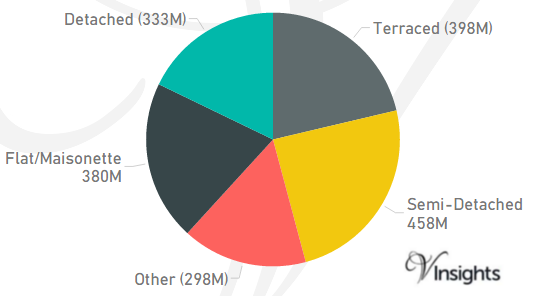
Hillingdon is one of the Boroughs of West London. It had total Property Sales of £1.9 billions which was 12.06% of West London Property Market 2015.
The split across the different property types are:
- Terraced: £398 millions (21.31%)
- Semi-Detached: £458 millions (24.53%)
- Other: £298 millions (15.94%)
- Flat/Maisonette: £380 millions (20.38%)
- Detached: £333 millions (17.83%).
Total No Of Properties Sold By Property Type
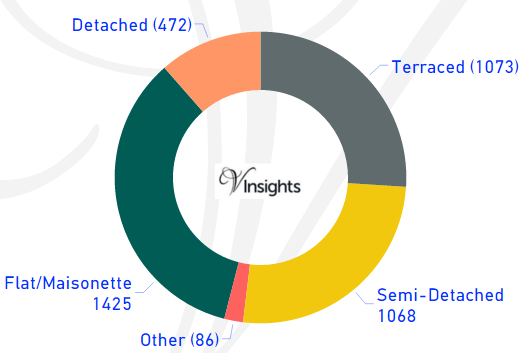
In Hillingdon the total number of properties sold in year 2015 was 4124. The breakdown by different property types are:
- Terraced: 1073 (26.02%)
- Semi-Detached: 1068 (25.9%)
- Other: 86 (2.09%)
- Flat/Maisonette: 1425 (34.55%)
- Detached: 472 (11.45%).
Average & Median Sales Price
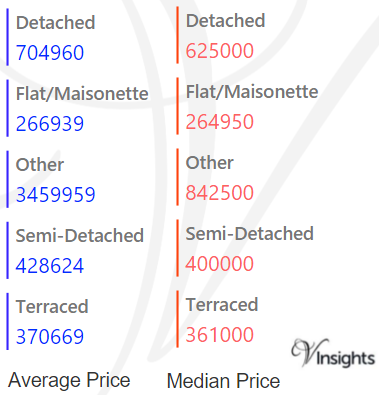
In 2015 the Average price was £453 K in Hillingdon. The average property price for the different property types are:
- Detached: £705 K
- Flat/Maisonette: £267 K
- Other: £3.5 millions
- Semi-Detached: £429 K
- Terraced: £371 K.
The Median property price was £350 K. The median property price for the different property types are:
- Detached: £625 K
- Flat/Maisonette: £265 K
- Other: £843 K
- Semi-Detached: £400 K
- Terraced: £361 K.
New Vs Not New Property Statistics
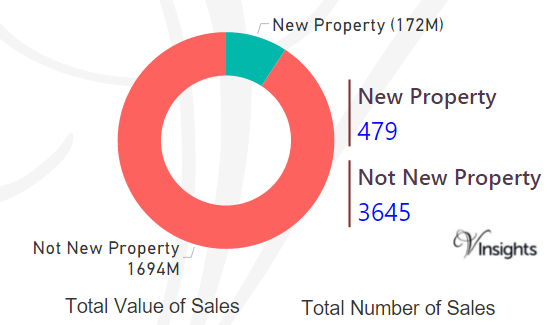
By Value Of Sales
- Not New Property Contributed £1.69 billion (90.79%)
- New Property 172 millions (9.21%) giving combined total of £1.9 billions.
By Number Of Sales
- The number of Not New Property sold was 3645 (88.39%)
- whereas the number of New Properties sold were 479 (11.61%) giving combined total of 4124.
All London Posts
c20f9230-d4b8-4f26-bc6e-8fadf8ed4754|0|.0|27604f05-86ad-47ef-9e05-950bb762570c
For 2016 details - Havering Property Market 2016
Story Highlights
- Havering had total Property Sales of £1.44 billions in 2015
- The total number of properties sold in year 2015 was 4464
- The Average property price was £323 K in Havering while Median was was £285 K
- Not New Property Contributed 88.48% and New Property 11.52%
Total Sales By Property Type
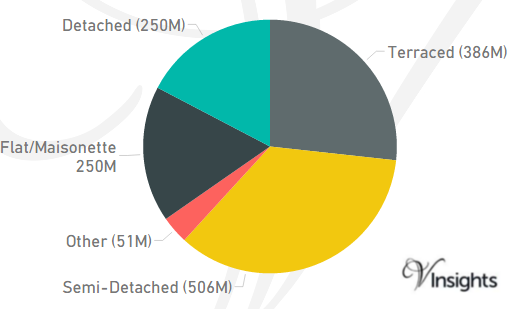
Havering is one of the Boroughs of East London. It had total Property Sales of £1.44 billions which was 8.82% of East London Property Market 2015.
The split across the different property types are:
- Terraced £386 millions (26.74%)
- Semi-Detached £506 millions (35.06%)
- Other £51 millions (3.53%)
- Flat/Maisonette £250 millions (17.34%)
- Detached £250 millions (17.33%).
Total No Of Properties Sold By Property Type
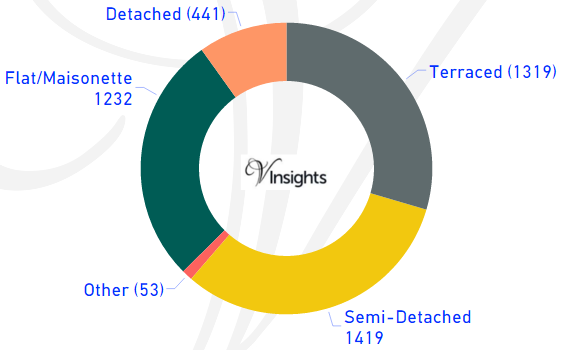
In Havering the total number of properties sold in year 2015 was 4464. The breakdown by different property types are:
- Terraced 1319 (29.55%)
- Semi-Detached 1419 (31.79%)
- Other 53 (1.19%)
- Flat/Maisonette 1232 (27.6%)
- Detached 441 (9.88%).
Average & Median Sales Price
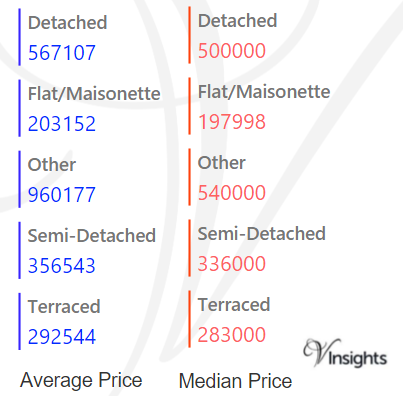
In 2015 the Average property price was £323 K in Havering. The average price for the different property types are:
- Detached £567 K
- Flat/Maisonette £203 K
- Other £960 K
- Semi-Detached £357 K
- Terraced £293 K.
The Median Price was £285 K. The median property price for the different property types are:
- Detached £500 K
- Flat/Maisonette £198 K
- Other £540 K
- Semi-Detached £336 K
- Terraced £283 K.
New Vs Not New Property Statistics
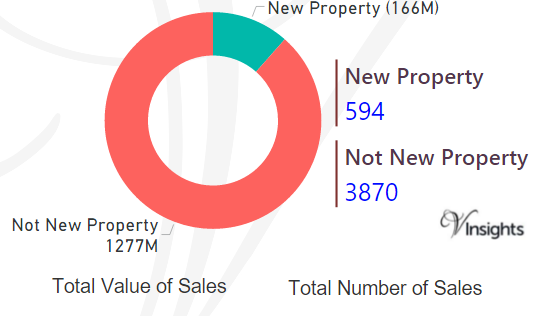
By Value Of Sales
- Not New Property contributed £1.28 billion (88.48%)
- New Property 166 millions (11.52%) giving combined total of £1.44 billions .
By Number Of Sales
- The number of Not New Property sold was 3870 (86.69%)
- The number of New Properties sold was 594 (13.31%) giving combined total of 4464.
All London Posts
08d2c3c1-fd5b-4f98-85e1-3608e42cd0a2|0|.0|27604f05-86ad-47ef-9e05-950bb762570c
For 2016 details - Harrow Property Market 2016
Story Highlights
- Harrow had total Property Sales of £1.6 billions in 2015
- The total number of properties sold in year 2015 was 3363
- The Average property price was £471 K while Median was £394 K
- Not New Property contributed 86.44% and New Property 13.56% by sales value
Total Sales By Property Type
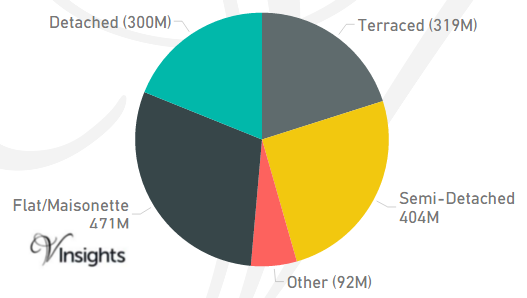
Harrow is one of the Boroughs of West London. It had total Property Sales of £1.6 billions which was 10.24% of West London Property Market 2015.
The split across the different property types are:
- Terraced: £319 millions (20.1%)
- Semi-Detached: £404 millions (25.47%)
- Other: £92 millions (5.84%)
- Flat/Maisonette: £471 millions (29.69%)
- Detached: £300 millions (18.9%).
Total No Of Properties Sold By Property Type
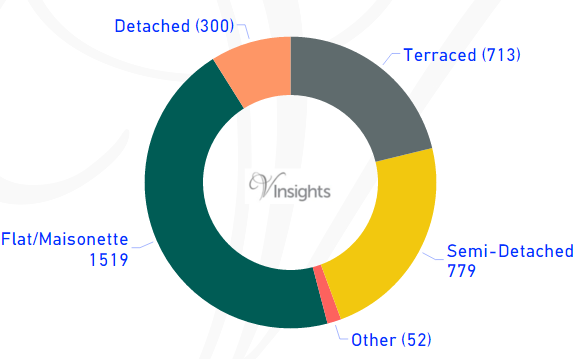
In Harrow the total number of properties sold in year 2015 was 3363. The breakdown by different property types are:
- Terraced: 713 (21.2%)
- Semi-Detached: 779 (23.16%)
- Other: 52 (1.55%)
- Flat/Maisonette: 1519 (45.17%)
- Detached: 300 (8.92%).
Average & Median Sales Price
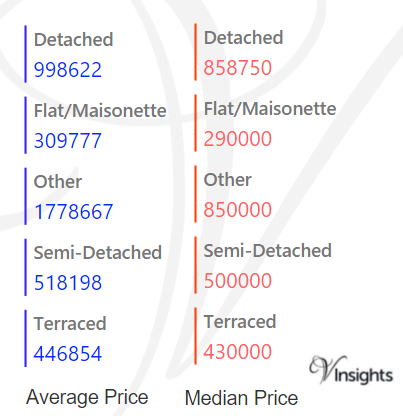
In 2015 the Average property price was £471 K in Harrow. The average property price for the different property types are:
- Detached: £999 K
- Flat/Maisonette: £310 K
- Other: £1.78 millions
- Semi-Detached: £518 K
- Terraced: £447 K.
The Median property price was £394 K. The median property price for the different property types are:
- Detached: £859 K
- Flat/Maisonette: £290 K
- Other: £850 K
- Semi-Detached: £500 K
- Terraced: £430 K.
New Vs Not New Property Statistics
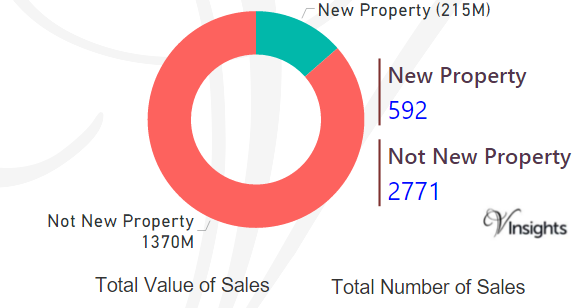
By Value Of Sales
- Not New Property Contributed £1.37 billion (86.44%)
- New Property 215 millions (13.56%) giving combined total of £1.6 billions.
By Number Of Sales
- The number of Not New Property sold were 2771 (82.4%)
- whereas the number of New Property sold were 592 (17.6%) giving combined total of 3363.
All London Posts
574299cc-6581-44fc-86ba-962099b151b6|0|.0|27604f05-86ad-47ef-9e05-950bb762570c