For 2016 details - Ealing Property Market 2016
Story Highlights
- Ealing had total Property Sales of £2.35 billions in 2015
- The total number of properties sold in year 2015 was 4029
- The Average property price was £584 K in Ealing while Median was £430 K
- The sales value contributed by New Property was 10.56% and Not New Property 89.44%
Total Sales By Property Type
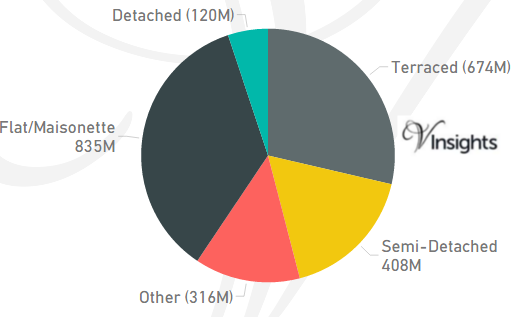
Ealing is one of the Boroughs of West London. It had total Property Sales of £2.35 billions which was 15.2% of West London Property Market 2015.
The split across the different property types are:
- Terraced: £674 millions (28.64%)
- Semi-Detached: £408 millions (17.32%)
- Other: £316 millions (13.45%)
- Flat/Maisonette: £835 millions (35.49%)
- Detached: £120 millions (5.1%).
Total No Of Properties Sold By Property Type
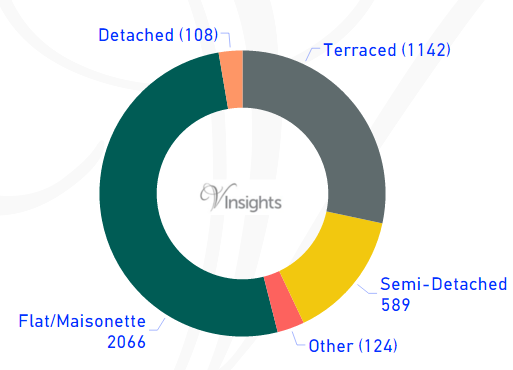
In Ealing the total number of properties sold in year 2015 was 4029. The breakdown by different property types are:
- Terraced: 1142 (28.34%)
- Semi-Detached: 589 (14.62%)
- Other: 124 (3.08%)
- Flat/Maisonette: 2066 (51.28%)
- Detached: 108 (2.68%).
Average & Median Sales Price
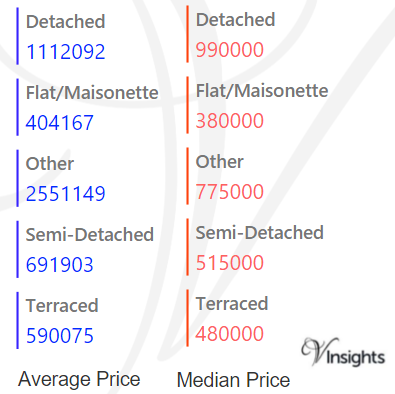
In 2015 the Average property price was £584 K in Ealing. The average property price for the different property types are:
- Detached: £1.1 millions
- Flat/Maisonette: £404 K
- Other: £2.55 millions
- Semi-Detached: £692 K
- Terraced: £590 K.
The Median property price was £430 K. The median property price for the different property types are:
- Detached: £990 K
- Flat/Maisonette: £380 K
- Other: £775 K
- Semi-Detached: £515 K
- Terraced: £480 K.
New Vs Not New Property Statistics
By Value Of Sales
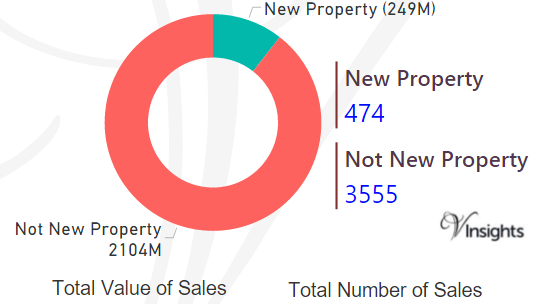
- The sales value contributed by New Property was £249 millions (10.56%)
- Not New Property contributed £2.1 billions (89.44 %) giving combined total of £2.35 billions.
By Number Of Sales
- New properties sold were 474 (11.76%)
- where as not new property sold were 3555 (88.24%) giving combined total of 4029.
All London Posts
f51f305c-2029-4a05-9d50-c6491f1e600a|0|.0|27604f05-86ad-47ef-9e05-950bb762570c
For 2016 details - Croydon Property Market 2016
Story Highlights
- Croydon had total Property Sales of £2.45 billions in 2015.
- The total number of properties sold in year 2015 was 6426.
- The Average property price was £379 K in Croydon while Median was £300 K.
- Not New Property Contributed 93.02% and New Property 6.98% by Sales value
Total Sales By Property Type
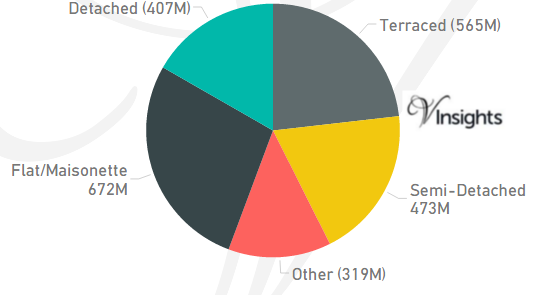
Croydon is one of the Boroughs of South London. It had total Property Sales of £2.45 billions which was 16.54% of South London Property Market 2015 Property Market 2015.
The split across the different property types are:
- Terraced £565 millions (23.19%)
- Semi-Detached £473 millions (19.41%)
- Other £319 millions (13.1%)
- Flat/Maisonette £672 millions (27.59%)
- Detached £407 millions (16.71%).
Total No Of Properties Sold By Property Type
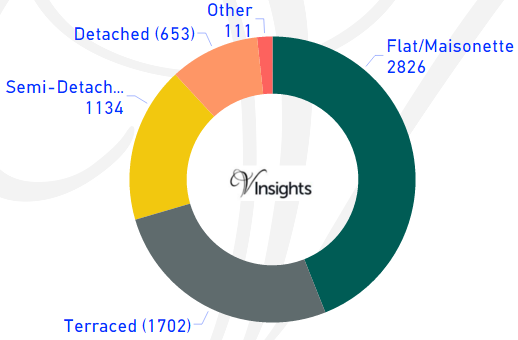
In Croydon the total number of properties sold in year 2015 was 6426. The breakdown by different property types are:
- Terraced 1702 (26.49%)
- Semi-Detached 1134 (17.65%)
- Other 111 (1.73%)
- Flat/Maisonette 2826 (43.98%)
- Detached 653 (10.16%)
Average & Median Sales Price
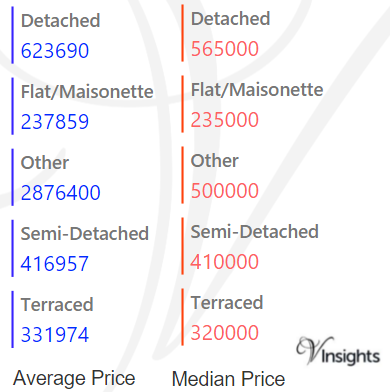
In 2015 the Average property price was £379 K in Croydon. The average property price for the different property types are:
- Detached £624 K
- Flat/Maisonette £238 K
- Other £2.88 millions
- Semi-Detached £417 K
- Terraced £332 K.
The Median Price was £300 K. The median property price for the different property types are:
- Detached £565 K
- Flat/Maisonette £235 K
- Other £500 K
- Semi-Detached £410 K
- Terraced £320 K
New Vs Not New Property Statistics
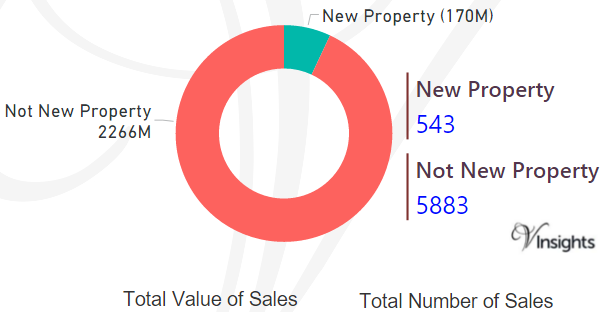
By Value Of Sales
- Not New Property contributed £2.27 billion (93.02%)
- New Property 170 millions (6.98%) giving combined total of £2.45 billions.
By Number Of Sales
- The number of Not New Property sold was 5883 (91.55%)
- The number of New Property sold was 543 (8.45%) giving combined total of 6426.
All London Posts
0a6fd8bf-0c4e-4382-a4bf-75cda58e15e2|0|.0|27604f05-86ad-47ef-9e05-950bb762570c
For 2016 details - City of Westminster Property Market 2016
Story Highlights
- City of Westminster had total Property Sales of £8.72 billions in 2015.
- The total number of properties sold in year 2015 was 3937.
- The Average property price was £2.21 millions in City of Westminster while Median was £925 K.
-
Not New Property contributed £8.03 billion (92.13%) and New Property 686 millions (7.87%) giving combined total of £8.72 billions.
-
The number of Not New Property sold was 3516 (89.31%), whereas the number of New Property sold was 421 (10.69%) giving combined total of 3937.
Total Sales By Property Type
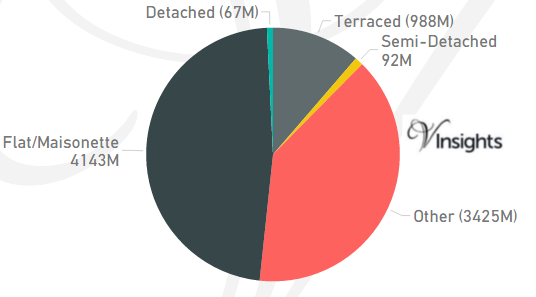
City of Westminster is one of the Boroughs of Central London. It had total Property Sales of £8.72 billions which was 31.15% of Central London Property Market 2015.
The split across the different property types are:
- Terraced £988 millions (11.33%)
- Semi-Detached £92 millions (1.06%)
- Other £3.43 billions (39.3%)
- Flat/Maisonette £4.14 billions (47.54%)
Total No Of Properties Sold By Property Type
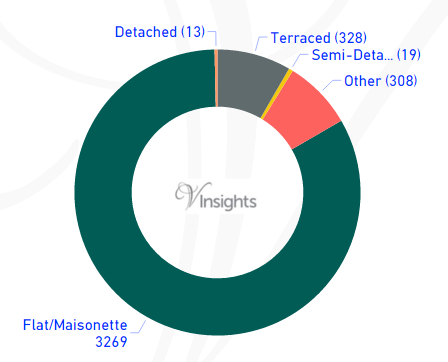
In City of Westminster the total number of properties sold in year 2015 was 3937. The breakdown by different property types are:
- Terraced 328 (8.33%)
- Semi-Detached 19 (0.48%)
- Other 308 (7.82%)
- Flat/Maisonette 3269 (83.03%)
- Detached 13 (0.33%)
Average & Median Sales Price
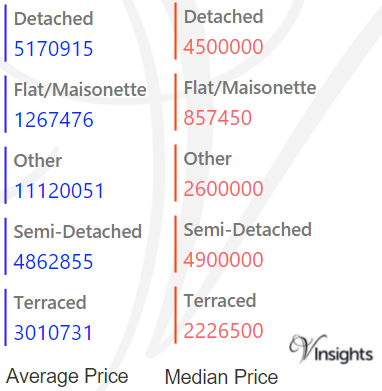
In 2015 the Average property price was £2.21 millions in City of Westminster. The average price for the different property types are:
- Detached £5.17 millions
- Flat/Maisonette £1.27 millions
- Other £11.12 millions
- Semi-Detached £4.86 millions
- Terraced £3.01 millions
The Median Price was £925 K. The median property price for the different property types are:
- Detached £4.5 millions
- Flat/Maisonette £857 K
- Other £2.6 millions
- Semi-Detached £4.9 millions
- Terraced £2.23 millions
New Vs Not New Property Statistics
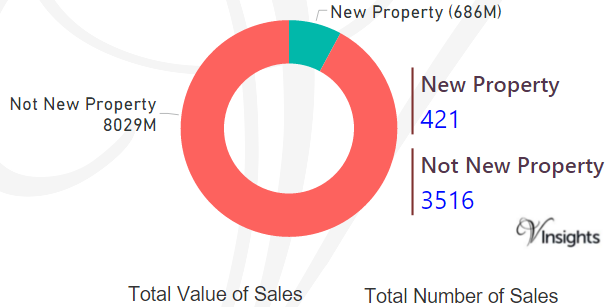
By Value Of Sales
- Not New Property contributed £8.03 billion (92.13%)
- New Property 686 millions (7.87%) giving combined total of £8.72 billions.
By Number Of Sales
- The number of Not New Property sold was 3516 (89.31%)
- The number of New Property sold was 421 (10.69%) giving combined total of 3937.
All London Posts
b6126749-eb6c-40de-8c4c-e9569360b208|0|.0|27604f05-86ad-47ef-9e05-950bb762570c
For 2016 details - City of London Property Market 2016
Story Highlights
- City of London had total Property Sales of £1.3 billions in 2015.
- The total number of properties sold in year 2015 was 385.
- The Average property price was £3.44 millions in City of London while Median was £800 K.
- Not New Property Contributed £1.21 billion (91.37%) and New Property 114 millions (8.63%) giving combined total of £3.88 billions.
- The number of Not New Property sold was 291 (75.58%), whereas the number of New Property sold was 94 (24.42%) giving combined total of 385.
Total Sales By Property Type
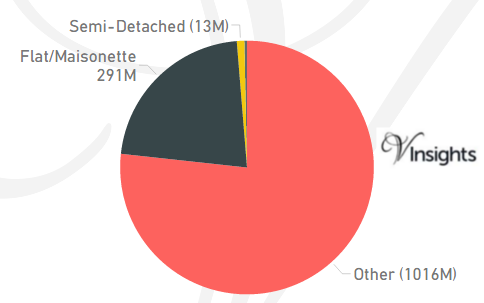
City of London is one of the Boroughs of Central London. It had total Property Sales of £1.3 billions which was 4.73% of Central London Property Market 2015.
The split across the different property types are:
- Terraced £4.43 millions (0.33%)
- Semi-Detached £12.7 millions (0.96%)
- Other £1 billions (76.73%)
- Flat/Maisonette £291 millions (21.98%)
Total No Of Properties Sold By Property Type
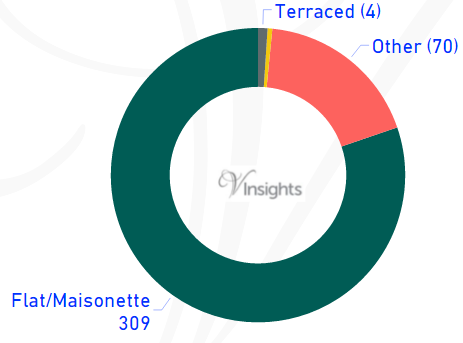
In City of London the total number of properties sold in year 2015 was 385. The breakdown by different property types are:
- Terraced 4 (1.04%)
- Semi-Detached 2 (0.52%)
- Other 70 (18.18%)
- Flat/Maisonette 309 (80.26%)
Average & Median Sales Price
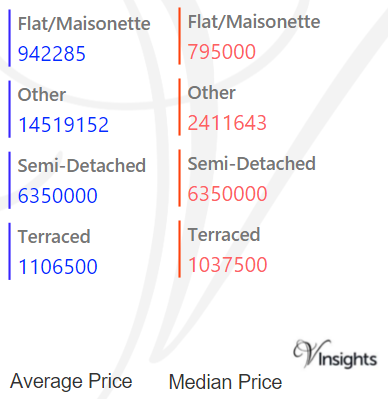
In 2015 the Average property price was £3.44 millions in City of London. The average price for the different property types:
- Flat/Maisonette £942 K
- Other £14.52 millions
- Semi-Detached £6.35 millions
- Terraced £1.1 millions
The Median Price was £800 K. The median property price for the different property types are:
- Flat/Maisonette £795 K
- Other £2.411 millions
- Semi-Detached £6.35 millions
- Terraced £1.03 millions
New Vs Not New Property Statistics
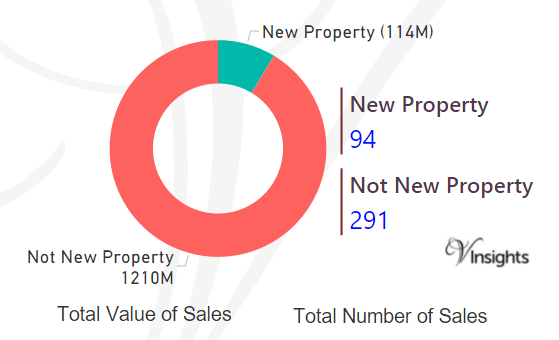
By Value Of Sales
- Not New Property contributed £1.21 billion (91.37%)
- New Property 114 millions (8.63%) giving combined total of £3.88 billions.
By Number Of Sales
- The number of Not New Property sold was 291 (75.58%)
- The number of New Property sold was 94 (24.42%) giving combined total of 385.
All London Posts
524b9035-ebb8-4a4c-8fca-20fe39ed1a1d|0|.0|27604f05-86ad-47ef-9e05-950bb762570c
For 2016 details - Camden Property Market 2016
Story Highlights
- Camden had total Property Sales of £3.88 billions in 2015.
- The total number of properties sold in year 2015 was 2882.
- The Average property price was £1.35 millions in Camden while Median was £709 K.
- Not New Property contributed £3.55 billion (91.35%) and New Property 336 millions (8.65%) giving combined total of £3.88 billions.
- The number of Not New Property sold was 2677 (92.89%), whereas the number of New Property sold was 205 (7.11%) giving combined total of 2882.
Total Sales By Property Type
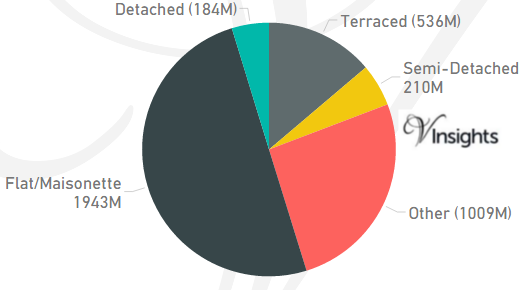
Camden is one of the Boroughs of Central London. It had total Property Sales of £3.88 billions which was 13.88% of Central London Property Market 2015.
The split across the different property types are:
- Terraced £536 millions (13.81%)
- Semi-Detached £210 millions (5.41%)
- Other £1 billion (26%)
- Flat/Maisonette £1.943 billions (50.05%)
- Detached £184 millions (4.74%)
Total No Of Properties Sold By Property Type
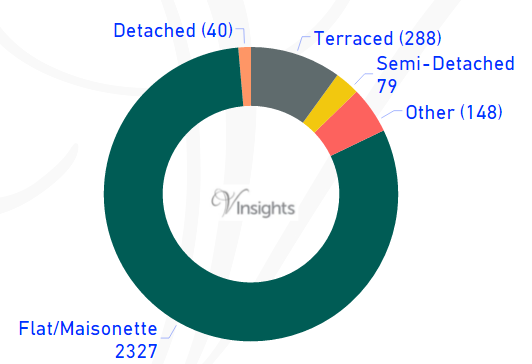
In Camden the total number of properties sold in year 2015 was 2882. The breakdown by different property types are:
- Terraced 288 (9.99%)
- Semi-Detached 79 (2.74%)
- Other 148 (5.14%)
- Flat/Maisonette 2327 (80.74%)
- Detached 40 (1.39%)
Average & Median Sales Price
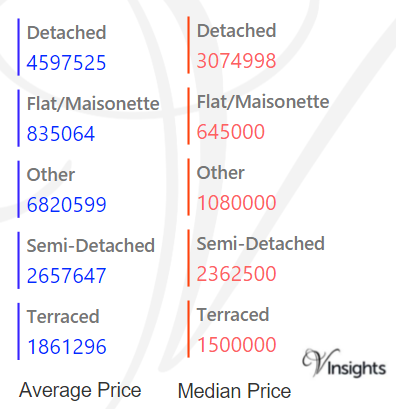
In 2015 the Average property price was £1.35 millions in Camden. The average price for the different property types are:
- Detached £4.6 millions
- Flat/Maisonette £835 K
- Other £6.82 millions
- Semi-Detached £2.66 millions
- Terraced £1.86 millions
The Median Price was £709 K. The median property price for the different property types are:
- Detached £3.07 millions
- Flat/Maisonette £645 K
- Other £1.08 millions
- Semi-Detached £2.36 millions
- Terraced £1.5 millions.
New Vs Not New Property Statistics
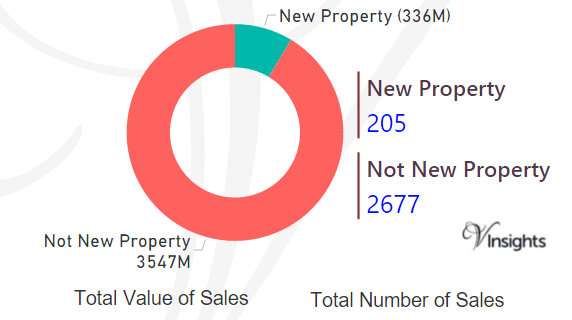
By Value Of Sales
- Not New Property contributed £3.55 billion (91.35%)
- New Property 336 millions (8.65%) giving combined total of £3.88 billions.
By Number Of Sales
- The number of Not New Property sold was 2677 (92.89%)
- The number of New Property sold was 205 (7.11%) giving combined total of 2882.
All London Posts
5ad45350-66c0-4cc8-9675-9bac248c9ace|0|.0|27604f05-86ad-47ef-9e05-950bb762570c