Story Highlights
- Hampshire had total property sales of £9.07 Billions in 2016
- The total number of properties sold in 2016 was 24,776 properties
- The average sales price in Hampshire was £366 K
- Across its districts average sales price was maximum for Winchester at £461 K
- New Property sales were 8.29% by value, where as Not New 91.71%
- Stamp duty hike caused monthly spike in March
- Brexit coupled with Stamp Duty Hike arrested the sharp growth in Hampshire Property Market in 2016, there was modest growth of 2.14 % over 2015
Hampshire is one of the counties of South East England. The districts of Hampshire are New Forest, Basingstoke and Deane, Winchester, East Hampshire, Test Valley, Fareham, Hart, Eastleigh, Rushmoor, Havant, Gosport
Total Sales By Districts
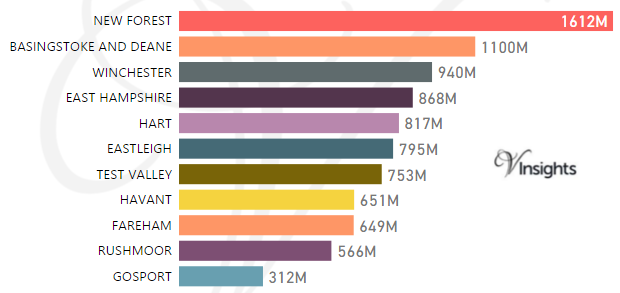
Hampshire had total property sales of £9.07 Billions, which was 14.65% of the total South East property Market in 2016
The split of the sales across the different districts was:
Year on Year Comparison : Compared to Hampshire Property Market 2015 in 2016
Total Sales By Property Type
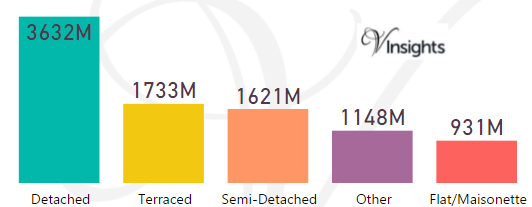
Hampshire had total property sales of £9.07 Billions. The split across the different property types are:
- Detached £3.6 Billions (40.07%)
- Terraced £1.7 Billions (19.12%)
- Semi-Detached £1.6 Billions (17.88%)
- Other £1.15 billions (12.67%)
- Flat/Maisonette £931 millions (10.27%)
Year on Year Comparison : Compared to Hampshire Property Market 2015 in 2016
- All the property types sales have shown growth except Detached
- Other have shown significant growth of 37% over 2015
Month-wise Break-up of Total Sales
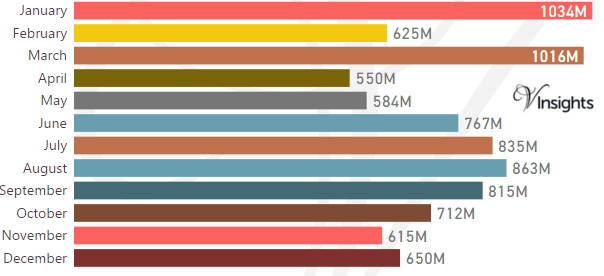
Some of the insights based on the £9.07 Billions month-wise break-down :
Stamp Duty Hike Impact
- March had property sale spike of £1.02 billions compared to £625 millions in Feb
- The impetus for it was to avoid the extra 3% in Stamp Duty Tax applicable on buying an additional home, being applicable from April 1 2016
Brexit Impact
- Brexit took place on 23rd June 2016.
- As can be observed from the month-wise break-up there does not seem to have been dip in property sales in the immediate aftermath of Brexit
- Year on Year growth has been 2.14%
- So Brexit and Stamp Duty changes have not had negative impact on Hampshire Property Market in 2016
Total No Of Properties Sold By Property Type
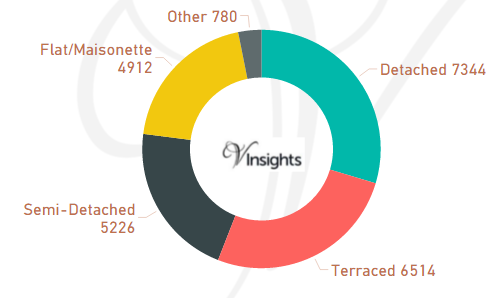
The total property sales of £9.07 Billions in 2016 was spread over 24,776 properties.
- Detached 7344 (29.64%)
- Terraced 6514 (26.29%)
- Semi-Detached 5226 (21.09%)
- Flat/Maisonette 4912 (19.83%)
- Others 780 (3.15%)
Year on Year Comparison : Compared to Hampshire Property Market 2015 in 2016
- Total number of property sales in 2016 has decreased by 6.34%.
- All property types have shown decline in number of properties sold except property type Other.
- Other has shown significant increase of 91%
Average & Median Sales Price
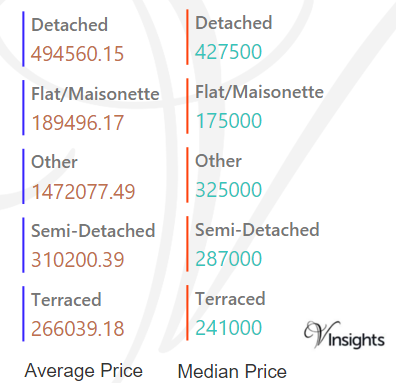
The average sales price in Hampshire was £366 K and for the different property types it was:
- Detached £495 K
- Semi-Detached £310 K
- Terraced £266 K
- Flat/Maisonette £190 K
- Other £1.47 million
Similarly median sales price in Hampshire was £283 K and for the different property types it was:
- Detached £428 K
- Semi-Detached £287 K
- Terraced £241 K
- Flat/Maisonette £175 K
- Other £325 K
Year on Year Comparison : Compared to Hampshire Property Market 2015 in 2016
- The average and median property prices have gone up except for property type Other
- Other has had decline in average and median property price
Average & Median Sales Price By Districts
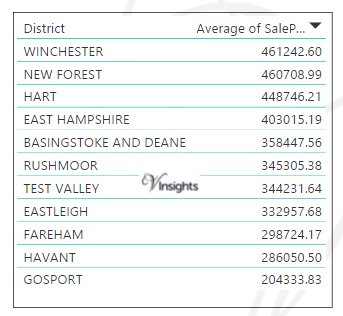
Across the Hampshire districts the average price is as above.
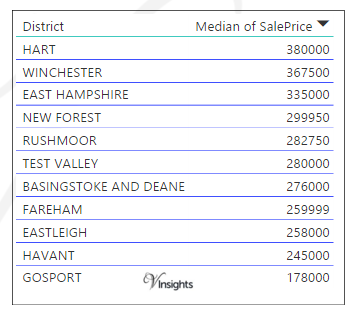 Across the Hampshire districts the median price is as above.
Year on Year Comparison : Compared to Hampshire Property Market 2015 in 2016
- The average sales price across all the counties have gone up except for Rushmoor, Fareham
- The median sales price across all the counties have gone up
New Vs Not New Property Statistics
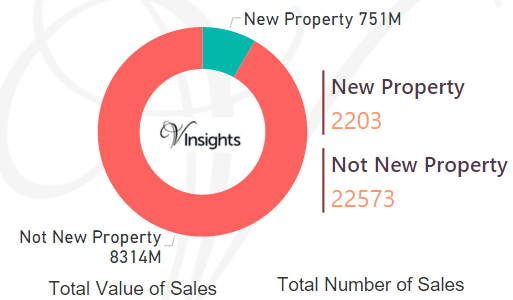
By Sales Values the split is as follows:
- New Property contributed £751 millions (8.29%)
- Not New Property contributed £8.3 billions (91.71%)
By Total Number the split is as follows:
- New properties sold were 2,203 (8.89%)
- Not new property sold were 22,573 (91.11%)
Year on Year Comparison : Compared to Hampshire Property Market 2015 in 2016
- New property market share by value has slightly gone down in 2016 over 2015
All Hampshire Posts

44027576-6e66-448e-9a43-3debff8518ff|0|.0|27604f05-86ad-47ef-9e05-950bb762570c