Please click here for the updated version of this post
This Post covers
- Coverage Area of Postcode UB1 to UB6
- Total Sales By Postcode UB1 to UB6
- Average & Median Sales Price By Postcode UB1 to UB6
- Total Number of Sales By Postcode UB1 to UB6
- Multi Year Property Trend Analysis By Postcode UB1 to UB6
- Schools for Postcode Area UB
- Posts for Postcode Area UB
Coverage Area of Postcode UB1 to UB6
Total Sales By Postcode UB1 to UB6 in 2016
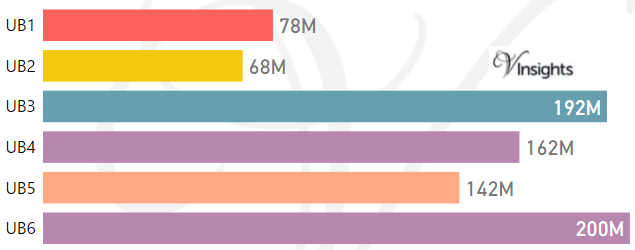
The Total Sales by the Postcodes are:
- UB1 £78 millions, UB2 £68 millions , UB3 £192 millions
- UB4 £162 millions, UB5 £142 millions , UB6 £200 millions
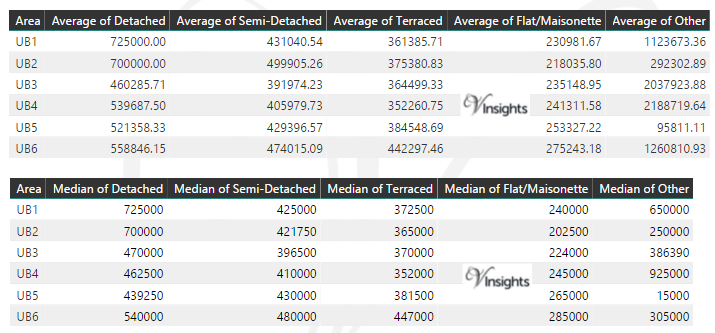
Average & Median Sales Price By Postcode in 2016
Total Number Of Sales By Postcode in 2016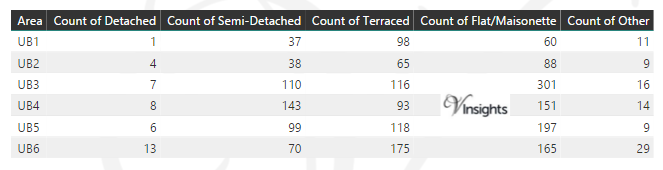
Multi Year Property Trend Analysis By Postcode
Schools for Postcode Area UB
Posts for Postcode Area UB
All Postcode Area Posts

Reference
UB Postcode Area As Per Wikipedia
9607f20d-d039-47bc-99c2-1a9e6057c8c6|0|.0|27604f05-86ad-47ef-9e05-950bb762570c
Story Highlights
- Wokingham had total property sales of £1.25 billions in 2016
- The total number of properties sold in 2016 was 2,676 properties
- The average sales price in Wokingham was £465 K, whereas median was £414 K
- New Property sales were 14.67% by value, where as Not New Property contributed 85.33%
- Stamp duty changes caused monthly spike in March
- Brexit coupled with Stamp Duty Hike has caused significant decline of 17.6% in 2016 over 2015
Wokingham is one of the districts of Berkshire.
Total Sales By Property Type
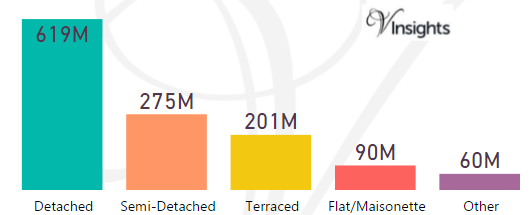
Wokingham had total property sales of £1.25 billions, which was 18.98% of Berkshire Property Market 2016
The split across the different property types in Bracknell Forest are:
- Detached £619 millions (49.72%)
- Semi-Detached £275 millions (22.1%)
- Terraced £201 millions (16.13%)
- Flat/Maisonette £90 millions (7.24%)
- Other £60 millions (4.81%)
Wokingham Property Market at Postcode level
| Postcode |
Coverage Area |
School |
Local Authority Area |
| RG2 |
Madejski Stadium,Whitley |
Details |
Reading, Wokingham |
| RG4 |
Caversham,Sonning,Sonning Common,Kidmore End,Sonni ng Eye,Dunsden Green,Mapledurham |
Details |
Reading,South Oxfordshire, Wokingham |
| RG5 |
Woodley |
Details |
Wokingham |
| RG6 |
Earley |
Details |
Wokingham, Reading |
| RG7 |
Aldermaston,Bradfield,Burghfield Common,Riseley,Si lchester,Mortimer,Swallowfield,Theale,Woolhampton |
Details |
West Berkshire,Basingstoke and Deane, Wokingham |
| RG10 |
Charvil,Hurst,Ruscombe,Twyford,Wargrave,Waltham St Lawrence |
Details |
Wokingham,Windsor and Maidenhead |
| RG40 |
Wokingham(east and town centre),Finchampstead,Bark ham(south), Wick Hill |
Details |
Wokingham, Bracknell Forest |
| RG41 |
Wokingham(west),Winnersh,Woosehill,Barkham(north), Sindlesham,Emmbrook, Eastheath |
Details |
Wokingham |
Month-wise Break-up of Total Sales
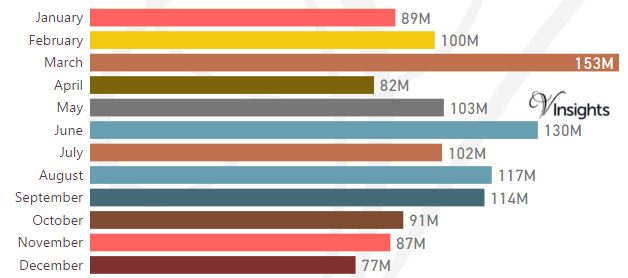
Stamp Duty Hike Impact
- March had property sale spike of £153 millions compared to £100 millions in Feb
- The impetus for it was to avoid the extra 3% in Stamp Duty Tax applicable on buying an additional home, being applicable from April 1 2016
Brexit Impact
- Brexit took place on 23rd June 2016.
- As can be observed from the month-wise break-up there has been dip in property sales in the immediate after-math of Brexit
- Year on Year property market in Wokingham has shown significant decline of 17.6%
Total No Of Properties Sold By Property Type
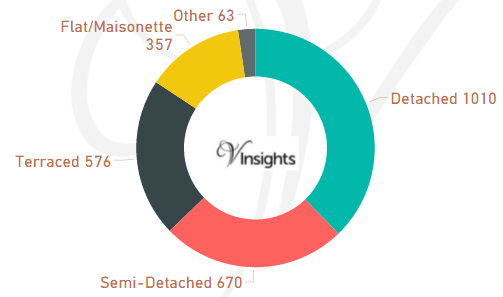
Wokingham had total property sales of 2,676. The split across the different property types are:
- Detached 1010 (37.74%)
- Semi-Detached 670 (25.04%)
- Terraced 576 (21.52%)
- Flat/Maisonette 357 (13.34%)
- Other 63 (2.35%)
Average & Median Sales Price
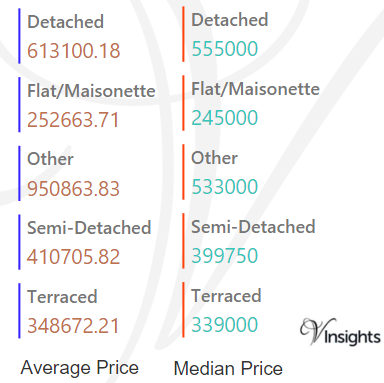
The average sales price in Wokingham was £465 K and for the different property types it was:
- Detached £613 K
- Semi-Detached £411 K
- Terraced £349 K
- Flat/Maisonette £253 K
- Other it is £951 K
Similarly median sales price in Wokingham was £414 K and for different property types are:
- Detached £555 K
- Semi-Detached £400 K
- Terraced £339 K
- Flat/Maisonette £245 K
- Other it is £533 k
New Vs Not New Property Statistics
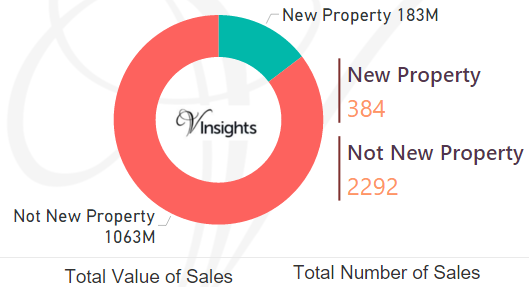
By Sales Values the split is as follows:
- New Property contributed £183 millions (14.67%)
- Not New Property contributed £1.06 billions (85.33%)
By Total Number the split is as follows:
- New properties sold were 384 (14.35%)
- Not new property sold were 2,292 (85.65%)
All Berkshire Posts
Reference
RG Postcode Area As Per Wikipedia
7779fefb-4ca8-4721-9d86-bc0549d33544|0|.0|27604f05-86ad-47ef-9e05-950bb762570c
Story Highlights
- West Berkshire had total property sales of £1.14 billions in 2016
- The total number of properties sold in 2016 was 2,542 properties
- The average sales price in West Berkshire was £448 K, whereas median was £327 K
- New Property sales were 4.9% by value, where as Not New Property contributed 95.1%
- Stamp duty changes caused monthly spike in March
- Brexit coupled with Stamp Duty Hike did not have impact as West Berkshire property market had growth of 3.6% in 2016 over 2015
West Berkshire is one of the districts of Berkshire.
Total Sales By Property Type
West Berkshire had total property sales of £1.14 billions, which was 17.35% of Berkshire Property Market 2016
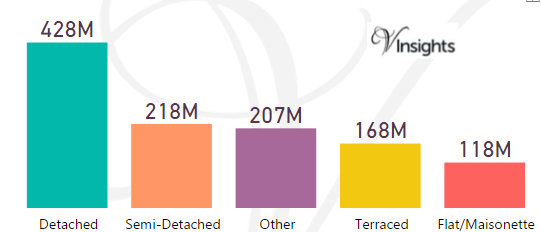
The split across the different property types in West Berkshire are:
- Detached £428 millions (37.6%)
- Semi-Detached £218 millions (19.14%)
- Other £207 millions (18.15%)
- Terraced £168 millions (14.71%)
- Flat/Maisonette £118 millions (10.4%)
West Berkshire Property Market at Postcode level
| Postcode |
Coverage Area |
School |
Local Authority Area |
| OX12 |
Wantage,Grove,Ardington,Charney Bassett,Childrey, Challow (East&West),Denchworth,Farnborough (Be rks),Fawley, Ginge (East & West),Hanney(East&a mp;West), Hendred (East&West),Kingston Lisle,L etcombe Bassett,Letcombe Regis,Lockinge(East&W est),Lyford,Sparsholt |
Details |
Vale Of White Horse, South Oxfordshire, West Berkshire |
| RG7 |
Aldermaston,Bradfield,Burghfield Common,Riseley,Si lchester,Mortimer,Swallowfield,Theale,Woolhampton |
Details |
West Berkshire,Basingstoke and Deane, Wokingham |
| RG8 |
Goring,Streatley,Pangbourne,Whitchurch-on-Thames |
Details |
South Oxfordshire, West Berkshire |
| RG14 |
Newbury(whole town area) |
Details |
West Berkshire |
| RG17 |
Chilton Foliat,Eastbury,Eddington,Kintbury,Hungerf ord,Inkpen,Lambourn, North Wessex Downs AONB area |
Details |
West Berkshire,Wiltshire |
| RG18 |
Hampstead Norreys,Hermitage,Thatcham(north),Yatten don |
Details |
West Berkshire |
| RG19 |
Ashford Hill with Headley,Bishops Green,Greenham, Thatcham (south) |
Details |
West Berkshire, Basingstoke and Deane |
| RG20 |
Ashmansworth,Chieveley,Compton,Ecchinswell,Leckham pstead,Highclere,Kingsclere,Sydmonton |
Details |
West Berkshire, Basingstoke and Deane |
| RG26 |
Baughurst,Bramley,Brimpton Common,Hannington,Pambe r End,Pamber Heath,Tadley |
Details |
Basingstoke and Deane, West Berkshire |
| RG30 |
Tilehurst, Prospect Park,Purley-on-Thames, Reading (west),Southcote |
Details |
Reading, West Berkshire |
| RG31 |
Calcot Row,Tilehurst |
Details |
Reading, West Berkshire |
Month-wise Break-up of Total Sales
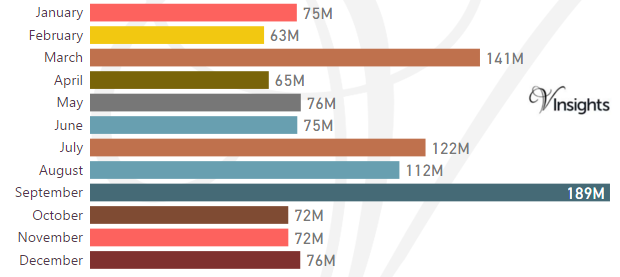
Stamp Duty Hike Impact
- March had property sale spike of £141 millions compared to £63 millions in Feb
- The impetus for it was to avoid the extra 3% in Stamp Duty Tax applicable on buying an additional home, being applicable from April 1 2016
Brexit Impact
- Brexit took place on 23rd June 2016.
- As can be observed from the month-wise break-up there does not seem to have been dip in property sales in the immediate after-math of Brexit
- Year on Year property market in West Berkshire has had growth of 3.6%
Total No Of Properties Sold By Property Type
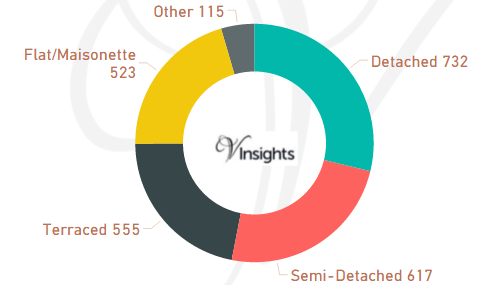
West Berkshire had total property sales of 2,542. The split across the different property types are:
- Detached 732 (28.8%)
- Semi-Detached 617 (24.27%)
- Terraced 555 (21.83%)
- Flat/Maisonette 523 (20.57%)
- Other 115 (4.52%)
Average & Median Sales Price
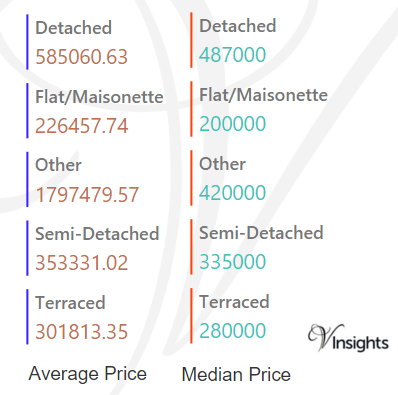
The average sales price in West Berkshire was £448 K and for the different property types it was:
- Detached £585 K
- Semi-Detached £353 K
- Terraced £302 K
- Flat/Maisonette £227 K
- Other it is £1.8 million
Similarly median sales price in West Berkshire was £327 K and for the different property types are:
- Detached £487 K
- Semi-Detached £335 K
- Terraced £280 K
- Flat/Maisonette £200 K
- Other it is £420 K
New Vs Not New Property Statistics
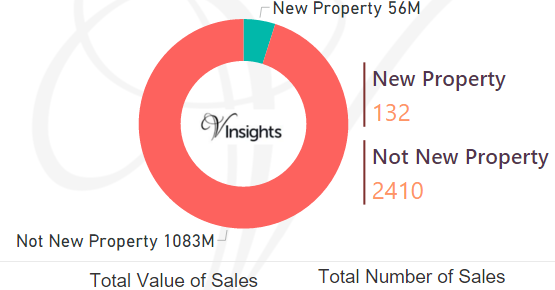
By Sales Values the split is as follows:
- New Property contributed £56 millions (4.9%)
- Not New Property contributed £1.08 billions (95.1%)
By Total Number the split is as follows:
- New properties sold were 132 (5.19%)
- Not new property sold were 2,410 (94.81%)
All Berkshire Posts
Reference
RG Postcode Area As Per Wikipedia
a658a332-9e07-46fa-94ea-d93dc98553d6|0|.0|27604f05-86ad-47ef-9e05-950bb762570c
Story Highlights
- Reading had total property sales of £1.01 billions in 2016
- The total number of properties sold in 2016 was 2,983 properties
- The average sales price in Bracknell Forest was £340 K, whereas median was £280 K
- New Property sales were 10.43% by value, where as Not New Property contributed 89.57%
- Stamp duty changes caused monthly spike in March
- Brexit coupled with Stamp Duty changes caused significant decline of 17.55% in 2016 over 2015
Reading is one of the districts of Berkshire.
Total Sales By Property Type
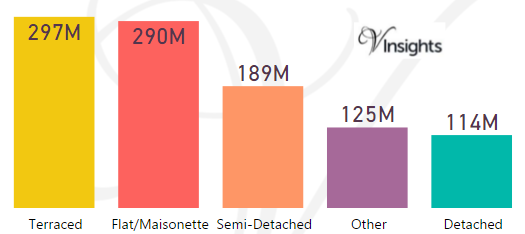
Reading had total property sales of £1.01 billions, which was 15.47% of Berkshire Property Market 2016
The split across the different property types in Reading are:
- Terraced £297 millions (29.23%)
- Flat/Maisonette £290 millions (28.58%)
- Semi-Detached £189 millions (18.65%)
- Other £125 millions (12.35%)
- Detached £114 millions (11.19%)
Reading Property Market at Postcode level
| Postcode |
Coverage Area |
School |
Local Authority Area |
| RG1 |
Katesgrove,Newtown,Reading(central) |
Details |
Reading |
| RG2 |
Madejski Stadium,Whitley |
Details |
Reading,Wokingham |
| RG4 |
Caversham,Sonning,Sonning Common,Kidmore End,Sonning Eye,Dunsden Green,Mapledurham |
Details |
Reading,South Oxfordshire, Wokingham |
| RG6 |
Earley |
Details |
Wokingham, Reading |
| RG30 |
Tilehurst, Prospect Park,Purley-on-Thames, Reading (west),Southcote |
Details |
Reading, West Berkshire |
| RG31 |
Calcot Row,Tilehurst |
Details |
Reading, West Berkshire |
Month-wise Break-up of Total Sales
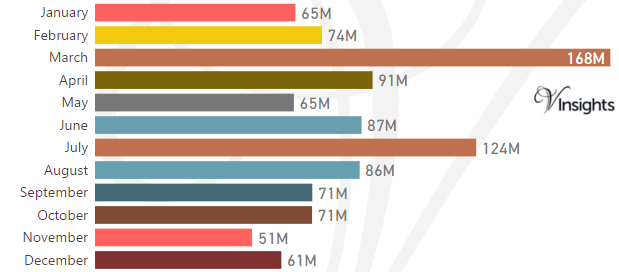
Stamp Duty Hike Impact
- March had property sale spike of £168 millions compared to £74 millions in Feb
- The impetus for it was to avoid the extra 3% in Stamp Duty Tax applicable on buying an additional home, being applicable from April 1 2016
Brexit Impact
- Brexit took place on 23rd June 2016.
- As can be observed from the month-wise break-up there seem to have been significant dip in property sales after March
- Year on Year property market in Reading has shown significant decline of 17.55% in 2016 over 2015
Total No Of Properties Sold By Property Type
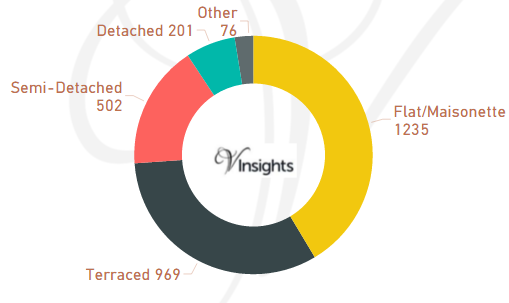
Reading had total property sales of 2,983. The split across the different property types are:
- Flat/Maisonette 1235 (41.4%)
- Terraced 969 (32.48%)
- Semi-Detached 502 (16.83%)
- Detached 201 (6.74%)
- Other 76 (2.55%)
Average & Median Sales Price
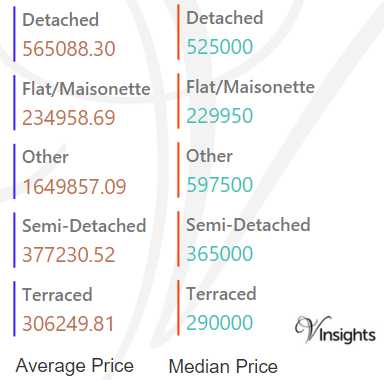
The average sales price in Reading was £340 K. For the different property types it was:
- Detached £565 K
- Semi-Detached £377 K
- Terraced £306 K
- Flat/Maisonette £235 K
- Other it is £1.65 million
Similarly median sales price in Reading was £280 K and for the different property types are:
- Detached £525 K
- Semi-Detached £365 K
- Terraced £290 K
- Flat/Maisonette £230 K
- Other it is £598 K
New Vs Not New Property Statistics
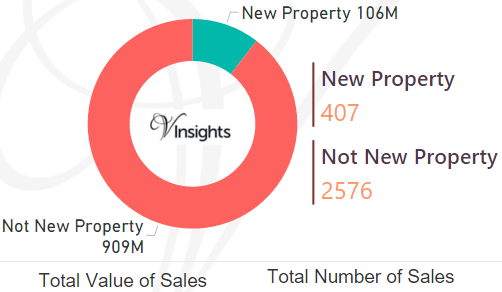
By Sales Values the split is as follows:
- New Property contributed £106 millions (10.43%)
- Not New Property contributed £909 millions (89.57%)
By Total Number the split is as follows:
- New properties sold were 407 (13.64%)
- Not new property sold were 2,576 (86.36%)
All Berkshire Posts
Reference
RG Postcode Area As Per Wikipedia
368d14ad-8273-4de8-a878-0f98031e1a3d|0|.0|27604f05-86ad-47ef-9e05-950bb762570c
Please click here for the updated version of this post
This Post covers
- Coverage Area of Postcode RG26 to RG45
- Total Sales By Postcode RG26 to RG45
- Average & Median Sales Price By Postcode RG26 to RG45
- Total Number of Sales By Postcode RG26 to RG45
- Multi Year Property Trend Analysis By Postcode RG26 to RG45
- Schools for Postcode Area RG
- Posts for Postcode Area RG
Coverage Area of Postcode RG26 to RG45
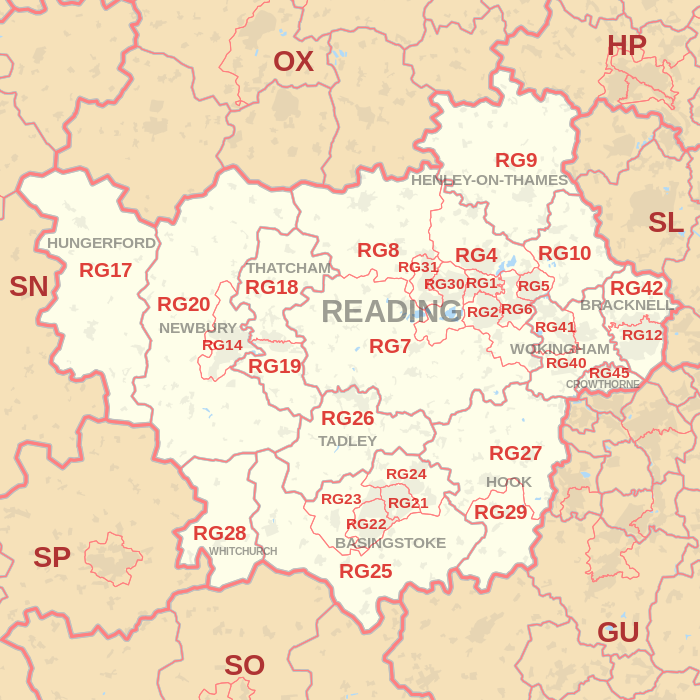 |
| Postcode |
Coverage Area |
Local Authority Area |
| RG26 |
Baughurst, Bramley, Brimpton Common, Hannington, Pamber End, Pamber Heath, Tadley |
Basingstoke and Deane, West Berkshire |
| RG27 |
Hook, Sherfield-on-Loddon, Stratfield Turgis, Turgis Green |
Basingstoke and Deane, Hart |
| RG28 |
Laverstoke, Litchfield, Hurstbourne Priors, Whitchurch (Hants) |
Basingstoke and Deane, Test Valley |
| RG29 |
Long Sutton, Odiham, North Warnborough, South Warnborough |
Hart |
| RG30 |
Tilehurst, Prospect Park, Purley-on-Thames, Reading (west), Southcote |
Reading, West Berkshire |
| RG31 |
Calcot Row, Tilehurst |
Reading, West Berkshire |
| RG40 |
Wokingham (east and town centre), Finchampstead, Barkham (south), Wick Hill |
Wokingham, Bracknell Forest |
| RG41 |
Wokingham (west), Winnersh, Woosehill, Barkham (north), Sindlesham, Emmbrook, Eastheath |
Wokingham |
| RG42 |
Bracknell (north), Binfield, Warfield, Newell Green, Popeswood, Priestwood, Winkfield Row, Jealott's Hill |
Bracknell Forest |
| RG45 |
Crowthorne, Ravenswood |
Bracknell Forest, Wokingham |
Total Sales By Postcode in 2016
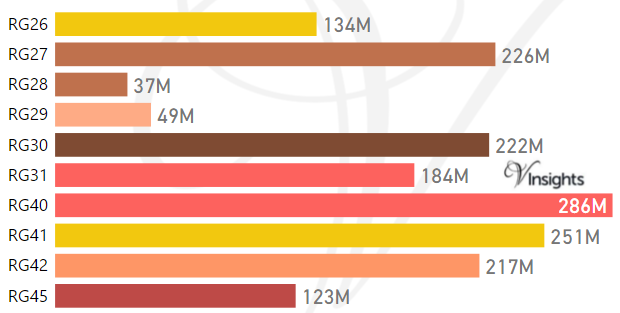
The Total Sales by the Postcodes are:
- RG26 £134 millions, RG27 £226 millions, RG28 £37 millions
- RG29 £49 millions, RG30 £222 millions, RG31 £184 millions
- RG40 £286 millions, RG40 £251 millions, RG42 £217 millions,
- RG45 £123 millions
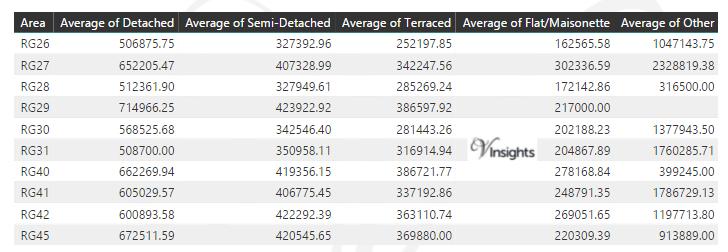
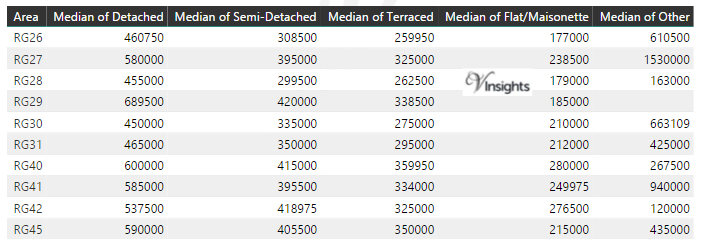
Average & Median Sales Price By Postcode in 2016
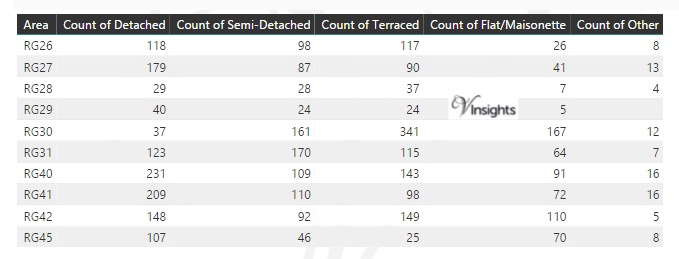
Total Number Of Sales By Postcode in 2016
Multi Year Property Trend Analysis By Postcode
Schools for Postcode Area RG
- RG Postcode Area - RG1, RG2, RG4, RG5, RG6, RG7, RG8, RG9 School Details
- RG Postcode Area - RG10, RG12, RG14, RG17, RG18, RG19, RG20, RG21, RG22, RG23,RG24, RG25 School Details
- RG Postcode Area - RG26, RG27, RG28, RG29, RG30, RG31, RG40, RG41, RG42, RG45 School Details
Posts for Postcode Area RG
All RG Postcodes Yearly & Trend Analysis Posts
Reference
RG Postcode Area As Per Wikipedia
efbd46b5-5779-4203-9619-e3cd14b9eb40|0|.0|27604f05-86ad-47ef-9e05-950bb762570c