Story Highlights
- Isle of Wight had total Property Sales of £726 millions in 2016
- The total number of properties sold in year 2016 was 3253
- The Average property price was £223 K in Isle of Wight while Median was £190 K
- The sales value contributed by New Property was 3.9% where as Not New Property 96.1%
- Stamp duty changes caused monthly spike in March
- Brexit coupled with Stamp Duty changes did not cause decline and there was growth of 1%
Isle of Wight has unitary authority status in South East England.
Total Sales By Property Type
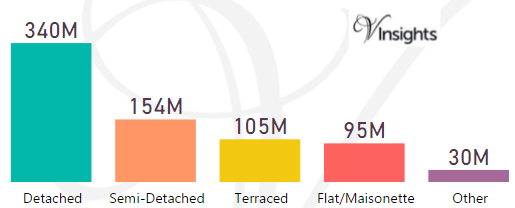
Isle of Wight had total property sales of £726 million which was 1.17% of the total South East property Market in 2016.
The split of £726 millions in Isle of Wight across the different property types are:
- Detached £340 millions (46.92%)
- Semi-Detached £154 millions (21.21%)
- Terraced £105 millions (14.52%)
- Flat/Maisonette £95 millions (13.15%)
- Other £30 millions (4.19%)
Year on Year Comparison : Compared to Isle of Wight Property Market 2015 in 2016
- All the property types sales have shown decline except Detached
Isle of Wight Property Market at Postcode Level
Month-wise Break-up of Total Sales
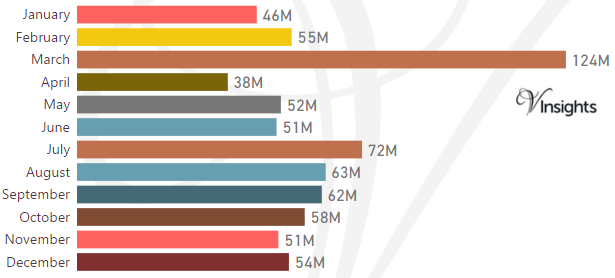
Some of the insights based on the £726 millions month-wise break-down :
Stamp Duty Hike Impact
- March had property sale spike of £124 millions compared to £55 millions in Feb
- The impetus for it was to avoid the extra 3% in Stamp Duty Tax applicable on buying an additional home, being applicable from April 1 2016
Brexit Impact
- Brexit took place on 23rd June 2016.
- Year on Year growth (compared to 2015) has been 1.12% in 2016
- Brexit coupled with Stamp Duty Hike have not had negative impact on Isle of Wight Property Market in 2016
Total No Of Properties Sold By Property Type
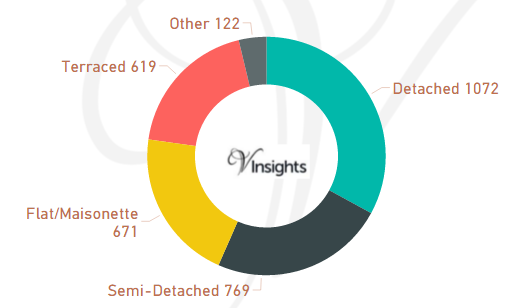
Isle of Wight had total property sales of 3253. The split across different property types are:
- Detached 1,072 (32.95%)
- Semi-Detached 769 (23.64%)
- Flat/Maisonette 671 (20.63%)
- Terraced 619 (19.03%)
- Other 122 (3.75%)
Year on Year Comparison : Compared to Isle of Wight Property Market 2015 in 2016
- Total number of property sales in 2016 has decreased by 1%.
- All property types have shown growth in number of properties sold except property type Semi-Detached, Other.
- Other has shown growth of 130%
Average & Median Sales Price
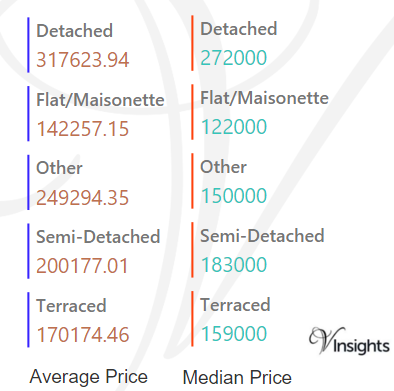
The average sales price in Isle of Wight was £223 K. For the different property types it was
- Detached at £318 K
- Semi-Detached at £200 K
- Terraced at £170 K
- Flat/Maisonette at £142 K
- Other it is at £249 K
Similarly median sales price in Isle of Wight was £190 K. For different property types it was
- Detached at £272 K
- Semi-Detached at £183 K
- Terraced at £159 K
- Flat/Maisonette at £122 K
- Other it is at £150 K
Year on Year Comparison : Compared to Isle of Wight Property Market 2015 in 2016
- The average and median property prices have gone down except for property type Detached, Semi-Detached.
- Other had massive decline in average and median property price
New Vs Not New Property Statistics
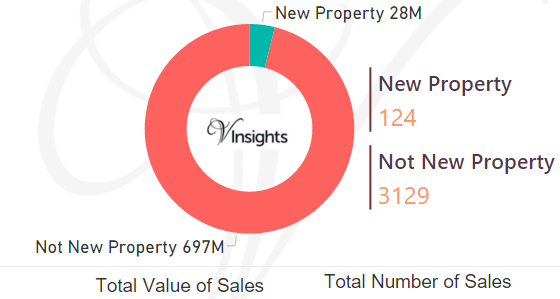
By Sales Value the split is as follows:
- New Property contributed £28 millions (3.9%)
- Not New Property contributed £697 millions (96.1%)
By Total Number the split is as follows:
- New properties sold were 124 (3.81%)
- Not new property sold were 3129 (96.19%)
Year on Year Comparison : Compared to Isle of Wight Property Market 2015 in 2016
- New property market share in property market has gone down
All South East England Post

22cb3d7b-2194-49d4-bfd1-6d973e79442c|0|.0|27604f05-86ad-47ef-9e05-950bb762570c
Story Highlights
- Winchester had total property sales of £940 millions in 2016
- The total number of properties sold in 2016 was 2,038 properties
- The average sales price in Winchester was £461 K
- New Property sales were 12.38% by value, where as Not New 87.62%
- Stamp duty hike caused monthly spike in March
- Brexit coupled with Stamp Duty hike have had negative impact on Winchester Property Market in 2016, there was growth of 2.59% over 2015
Winchester is one of the districts in Hampshire
Total Sales By Property Type
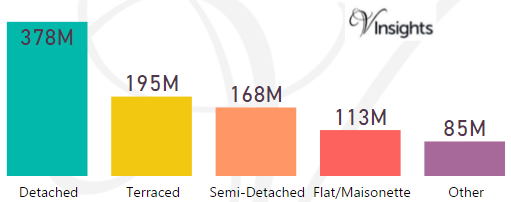
Winchester had total property sales of £940 millions, which was 10.37% of the total Hampshire property Market in 2016
The split across the different property types are:
- Detached £378 millions (40.19%)
- Terraced £195 millions (20.75%)
- Semi-Detached £168 millions (17.92%)
- Flat/Maisonette £113 millions (12.05%)
- Other £85 millions (9.09%)
Winchester Property Market at Postcode Level
| Postcode |
Coverage Area |
School |
Local Authority Area |
| PO7 |
Waterlooville,Denmead,Purbrook |
Details |
Havant, Winchester |
| SO21 |
Compton,Colden Common,Easton,Hursley,Itchen Abbas, Martyr Worthy,Micheldever,Owslebury,Shawford,South Wonston,Sutton Scotney,Sparsholt,Twyford |
Details |
Winchester |
| SO22 |
Badger Farm, Fulflood,Hursley,Littleton and Harest ock,Olivers Battery, Pitt, St Cross (W), Stanmore, Weeke |
Details |
Winchester |
| SO23 |
City Centre,Abbotts Barton,Bar End, Highcliffe, Hy de, St Cross (E),Winnall |
Details |
Winchester |
| SO24 |
New Alresford,Old Alresford,Cheriton,Tichborne,Rop ley |
Details |
Winchester |
| SO32 |
Bishops Waltham,Corhampton,Droxford,Durley,Exton,M eonstoke,Shedfield,Soberton,Swanmore,Upham,Warnfor d,Wickham |
Details |
Eastleigh,Winchester |
Month-wise Break-up of Total Sales
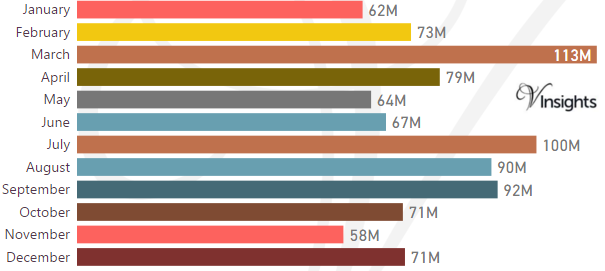
Some of the insights based on the £940 millions month-wise break-down :
Stamp Duty Hike Impact
- March had property sale spike of £113 millions compared to £73 millions in Feb
- The impetus for it was to avoid the extra 3% in Stamp Duty Tax applicable on buying an additional home, being applicable from April 1 2016
Brexit Impact
- Brexit took place on 23rd June 2016.
- Year on Year decline has been 2.59%
- So Brexit and Stamp Duty changes have had negative impact on Winchester Property Market in 2016
Total No Of Properties Sold By Property Type
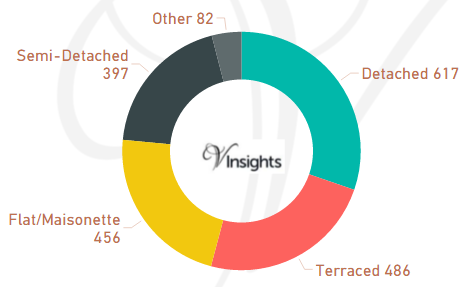
The total property sales of £940 millions in 2016 was spread over 2,038 properties.
- Detached 617 (30.27%)
- Terraced 486 (23.85%)
- Flat/Maisonette 456 (22.37%)
- Semi-Detached 397 (19.48%)
- Others 82 (4.02%)
Average & Median Sales Price
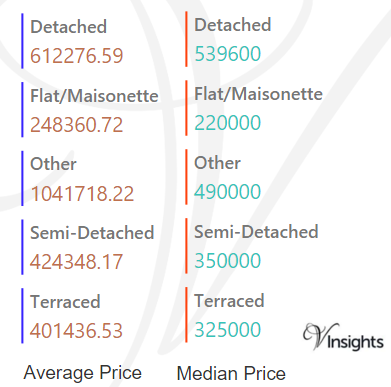
The average sales price in Winchester was £461 K and for the different property types it was:
- Detached £612 K
- Semi-Detached £424 K
- Terraced £401 K
- Flat/Maisonette £248 K
- Other £1.04 million
Similarly median sales price in Winchester was £368 K and for the different property types it was:
- Detached £540 K
- Semi-Detached £350 K
- Terraced £325 K
- Flat/Maisonette £220 K
- Other £490 K
New Vs Not New Property Statistics
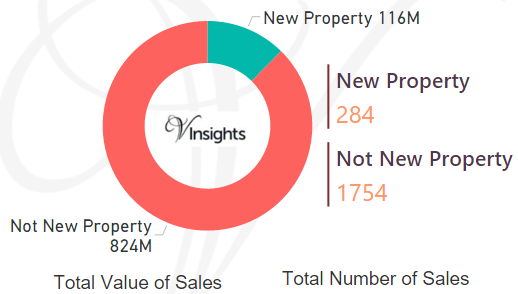
By Sales Values the split is as follows:
- New Property contributed £116 millions (12.38%)
- Not New Property contributed £824 millions (87.62%)
By Total Number the split is as follows:
- New properties sold were 284 (13.94%)
- Not new property sold were 1754 (86.06%).
All Hampshire Posts
6d7b9745-42bf-4a20-acac-c6c0e97699a1|0|.0|27604f05-86ad-47ef-9e05-950bb762570c
Story Highlights
- Test Valley had total property sales of £753 millions in 2016
- The total number of properties sold in 2016 was 2,188 properties
- The average sales price in Test Valley was £344 K
- New Property sales were 12.49% by value, where as Not New 87.51%
- Stamp duty hike caused monthly spike in March
- Brexit coupled with Stamp Duty Hike have had significant negative impact on Test Valley Property Market in 2016, there was decline of 10.14% over 2015
Test Valley is one of the districts in Hampshire
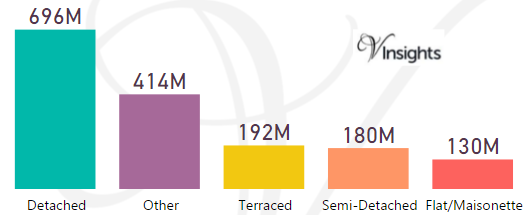
Total Sales By Property Type
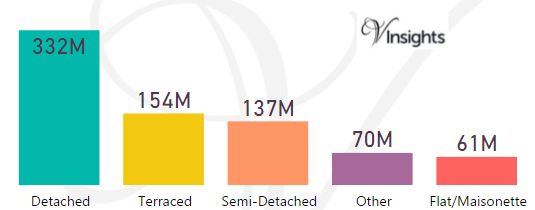
Test Valley had total property sales of £753 millions, which was 12.14% of the total Hampshire property Market in 2016
The split across the different property types are:
- Detached £332 millions (44.04%)
- Terraced £154 millions (20.42%)
- Semi-Detached £137 millions (18.19%)
- Other £70 millions (9.24%)
- Flat/Maisonette £61 millions (8.11%)
Test Valley Property Market at Postcode Level
| Postcode |
Coverage Area |
School |
Local Authority Area |
| RG28 |
Laverstoke,Litchfield,Hurstbourne Priors,Whitchurc h (Hants) |
Details |
Basingstoke and Deane, Test Valley |
| SO16 |
Bassett,Lordswood,Redbridge,Rownhams,Nursling,Chil worth |
Details |
Southampton, Test Valley |
| SO20 |
Stockbridge,Kings Somborne,Middle Wallop |
Details |
Test Valley |
| SO51 |
Romsey,Ampfield,Lockerley,Mottisfont,Wellow |
Details |
Test Valley |
| SO52 |
North Baddesley |
Details |
Test Valley |
| SO53 |
Chandlers Ford |
Details |
Eastleigh, Test Valley |
| SP9 |
Tidworth,Shipton Bellinger |
Details |
Wiltshire, Test Valley |
| SP10 |
Andover |
Details |
Test Valley |
| SP11 |
Outskirts of Andover and surrounding villages |
Details |
Test Valley,Basingstoke and Deane, Wiltshire |
Month-wise Break-up of Total Sales
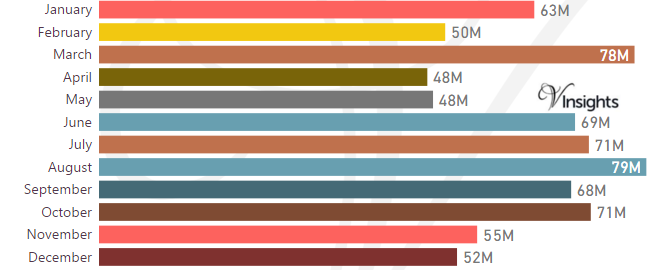
Some of the insights based on the £753 millions month-wise break-down :
Stamp Duty Hike Impact
- March had property sale spike of £78 millions compared to £50 millions in Feb
- The impetus for it was to avoid the extra 3% in Stamp Duty Tax applicable on buying an additional home, being applicable from April 1 2016
Brexit Impact
- Brexit took place on 23rd June 2016.
- Year on Year decline has been 10.14%
- So Brexit and Stamp Duty changes have had significant negative impact on Test Valley Property Market in 2016
Total No Of Properties Sold By Property Type
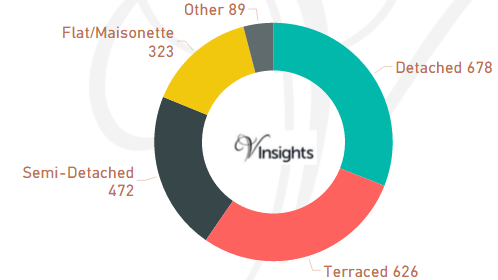
The total property sales of £753 millions in 2016 was spread over 2,188 properties.
- Detached 678 (30.99%)
- Terraced 626 (28.61%)
- Semi-Detached 472 (21.57%)
- Flat/Maisonette 322 (14.76%)
- Other 89 (4.07%)
Average & Median Sales Price
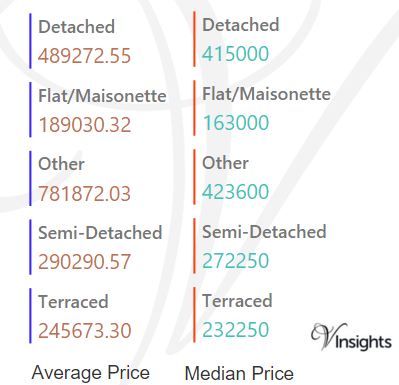
The average sales price in Hampshire was £344 K and for the different property types it was:
- Detached £489 K
- Semi-Detached £290 K
- Terraced £246 K
- Flat/Maisonette £189 K
- Other it is £782 K
Similarly median sales price in Hampshire was £280 K and for different property types are:
- Detached £415 K
- Semi-Detached £272 K
- Terraced £232 K
- Flat/Maisonette £163 K
- Other £424 K
New Vs Not New Property Statistics
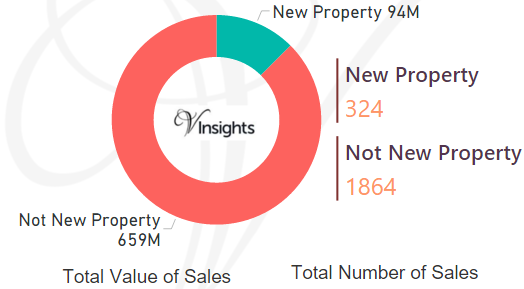
By Sales Value the split is as follows:
- New Property contributed £94 millions (12.49%)
- Not New Property contributed £659 millions (87.51%)
By Total Number the split is as follows:
- New properties sold were 324 (14.81%)
- Not new property sold were 1864 (85.19%).
All Hampshire Posts
36198e57-db2b-4a8c-aa1d-8affd42439a1|0|.0|27604f05-86ad-47ef-9e05-950bb762570c
Story Highlights
- Rushmoor had total property sales of £566 millions in 2016
- The total number of properties sold in 2016 was 1,640 properties
- The average sales price in Rushmoor was £345 K
- New Property sales were 9.65% by value, where as Not New 90.35%
- Stamp duty hike caused monthly spike in March
- Brexit coupled with Stamp Duty Hike have had significant negative impact on Rushmoor Property Market in 2016, there was decline of 15.27% over 2015
Rushmoor is one of the districts in Hampshire
Total Sales By Property Type

Rushmoor had total property sales of £566 millions, which was 6.25% of the total Hampshire property Market in 2016
The split across the different property types are:
- Semi-Detached £141 millions (24.86%)
- Terraced £138 millions (24.37%)
- Other £104 millions (18.35%)
- Flat/Maisonette £97 millions (17.1%)
- Detached £87 millions (15.33%)
Rushmoor Property Market at Postcode Level
Month-wise Break-up of Total Sales

Some of the insights based on the £566 millions month-wise break-down :
Stamp Duty Hike Impact
- March had property sale spike of £65 millions compared to £31 millions in Feb
- The impetus for it was to avoid the extra 3% in Stamp Duty Tax applicable on buying an additional home, being applicable from April 1 2016
Brexit Impact
- Brexit took place on 23rd June 2016.
- Year on Year growth decline has been 15.27%
- So Brexit and Stamp Duty changes have had significant negative impact on Rushmoor Property Market in 2016
Total No Of Properties Sold By Property Type

The total property sales of £566 millions in 2016 was spread over 1,640 properties.
- Flat/Maisonette 509 (31.04%)
- Terraced 477 (29.09%)
- Semi-Detached 422 (25.73%)
- Detached 190 (11.59%)
- Other 42 (2.56%)
Average & Median Sales Price

The average sales price in Rushmoor was £345 K and for the different property types it was:
- Detached £457 K
- Semi-Detached £334 K
- Terraced £289 K
- Flat/Maisonette £190 K
- Other £2.48 million
Similarly median sales price in Rushmoor was £283 K and for the different property types it was:
- Detached £449 K
- Semi-Detached £330 K
- Terraced £283 K
- Flat/Maisonette £190 K
- Other £565 K
New Vs Not New Property Statistics

By Sales Value the split is as follows:
- New Property contributed £55 millions (9.65%)
- Not New Property contributed £512 millions (90.35%)
By Total Number the split is as follows:
- New properties sold were 154 (9.39%)
- Not new property sold were 1486 (90.61%).
All Hampshire Posts
c2921bdb-bf4d-412b-b23c-091ece713b0f|0|.0|27604f05-86ad-47ef-9e05-950bb762570c
Story Highlights
- New Forest had total property sales of £1.6 Billions in 2016
- The total number of properties sold in 2016 was 3,499 properties
- The average sales price in New Forest was £461 K
- New Property sales were 2.1% by value, where as Not New 97.9%
- Stamp duty hike caused monthly spike in March
- Brexit coupled with Stamp Duty Hike have not had negative impact on New Forest Property Market in 2016, there was growth of 27.43% over 2015
New Forest is one of the districts in Hampshire
Total Sales By Property Type
New Forest had total property sales of £1.6 Billions, which was 17.78% of the total Hampshire property Market in 2016
The split across the different property types are:
- Detached £696 millions (43.17%)
- Other £414 millions (25.69%)
- Terraced £192 millions (11.88%)
- Semi-Detached £180 millions (11.17%)
- Flat/Maisonette £130 millions (8.09%)
New Forest Property Market at Postcode level
| Postcode |
Coverage Area |
School |
Local Authority Area |
| BH24 |
Ringwood,St Leonards,Ashley Heath |
Details |
New Forest |
| BH25 |
New Milton,Barton on Sea,Bashley,Wootton,Ossemsley |
Details |
New Forest |
| SO40 |
Totton,Lyndhurst,Cadnam,Marchwood |
Details |
New Forest |
| SO41 |
Lymington,Milford-on-Sea,Pennington,Boldre,Hordle, Sway |
Details |
New Forest |
| SO42 |
Beaulieu,Brockenhurst,East Boldre |
Details |
New Forest |
| SO43 |
Lyndhurst,Minstead,Bramshaw |
Details |
New Forest |
| SO45 |
Hythe,Fawley,Blackfield,Calshot,Hardley |
Details |
New Forest |
| SP6 |
Fordingbridge |
Details |
New Forest |
Month-wise Break-up of Total Sales
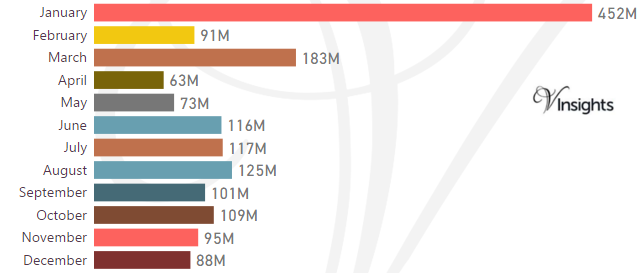
Some of the insights based on the £1.6 Billions month-wise break-down :
Stamp Duty Hike Impact
- March had property sale spike of £183 millions compared to £91 millions in Feb
- The impetus for it was to avoid the extra 3% in Stamp Duty Tax applicable on buying an additional home, being applicable from April 1 2016
Brexit Impact
- Brexit took place on 23rd June 2016.
- Year on Year growth has been 27.43%
- So Brexit and Stamp Duty changes have not had negative impact on New Forest Property Market in 2016
Total No Of Properties Sold By Property Type
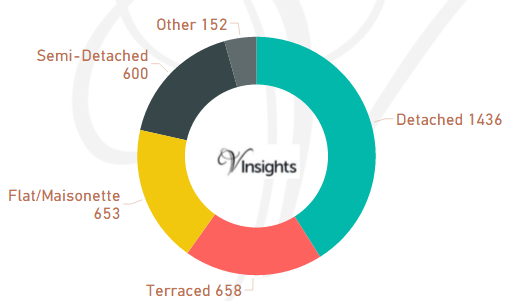
The total property sales of £1.6 Billions in 2016 was spread over 3,499 properties.
- Detached 1436 (41.04%)
- Terraced 658 (18.81%)
- Flat/Maisonette 653 (18.66%)
- Semi-Detached 600 (17.15%)
- Others 152 (4.34%)
Average & Median Sales Price
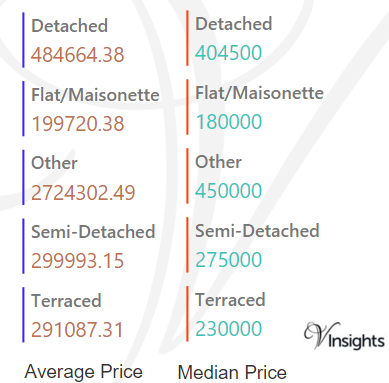
The average sales price in New Forest was £461 K and for the different property types it was:
- Detached £485 K
- Semi-Detached £300 K
- Terraced £291 K
- Flat/Maisonette £200 K
- Other £2.7 million
Similarly median sales price in New Forest was £300 K and for the different property types it was:
- Detached £405 K
- Semi-Detached £275 K
- Terraced £230 K
- Flat/Maisonette £180 K
- Other £450 K
New Vs Not New Property Statistics

By Sales Values the split is as follows:
- New Property contributed £34 millions (2.1%)
- Not New Property contributed £1.58 billions (97.9%)
By Total Number the split is as follows:
- New properties sold were 114 (3.26%)
- Not new property sold were 3,385 (96.74%)
All Hampshire Posts
5c6d0bec-b037-4222-9607-9e526233d17f|0|.0|27604f05-86ad-47ef-9e05-950bb762570c