Basingstoke and Deane Property Market in 2016 had Robust Growth of 12.71%

Story Highlights

  • Basingstoke and Deane had total property sales of £1.1 Billions in 2016
  • The total number of properties sold in 2016 was 3,070 properties
  • The average sales price in Basingstoke and Deane was £359 K
  • New Property sales were 4.88% by value, where as Not New 95.12%
  • Stamp duty hike caused monthly spike in March
  • Brexit coupled with Stamp Duty Hike have not had negative impact on Basingstoke and Deane Property Market in 2016, there was growth of 12.71 % over 2015


Basingstoke and Deane is one of the districts in Hampshire

Total Sales By Property Type
Basingstoke and Deane - Total Sales By Property Type

Basingstoke and Deane had total property sales of £1.1 Billions, which was 12.14% of the total Hampshire property Market in 2016

The split across the different property types are:

  • Detached £378 millions (34.34%)
  • Terraced £255 millions (23.15%)
  • Semi-Detached £202 millions (18.36%)
  • Other £153 millions (13.9%)
  • Flat/Maisonette £113 millions (10.25%)


Basingstoke and Deane Property Market at Postcode Level

Postcode Coverage Area School Local Authority Area
RG7 Aldermaston,Bradfield,Burghfield Common,Riseley,Si lchester,Mortimer,Swallowfield,Theale,Woolhampton Details West Berkshire, Basingstoke and Deane, Wokingham
RG19 Ashford Hill with Headley,Bishops Green,Greenham, Thatcham (south) Details West Berkshire, Basingstoke and Deane
RG20 Ashmansworth,Chieveley,Compton,Ecchinswell,Leckham pstead,Highclere,Kingsclere,Sydmonton Details West Berkshire, Basingstoke and Deane
RG21 Town Centre, Eastrop, Black Dam,Oakridge, South Vi ew Details Basingstoke and Deane
RG22 South Ham,Brighton Hill,Kempshott, Buckskin,Beggar wood Details Basingstoke and Deane
RG23 Winklebury,Rooksdown,Oakley Details Basingstoke and Deane
RG24 Popley,Chineham,Sherborne St John Details Basingstoke and Deane
RG25 Cliddesden,Dummer,Overton,North Waltham Details Basingstoke and Deane
RG26 Baughurst,Bramley,Brimpton Common,Hannington,Pambe r End,Pamber Heath,Tadley Details Basingstoke and Deane, West Berkshire
RG27 Hook,Sherfield-on-Loddon,Stratfield Turgis,Turgis Green Details Basingstoke and Deane,Hart
RG28 Laverstoke,Litchfield,Hurstbourne Priors,Whitchurc h (Hants) Details Basingstoke and Deane,Test Valley
SP11 Outskirts of Andover and surrounding villages Details Test Valley, Basingstoke and Deane, Wiltshire


Month-wise Break-up of Total Sales
Basingstoke and Deane - Month-wise Break-up of Total Sales

Some of the insights based on the £1.1 Billions month-wise break-down :

Stamp Duty Hike Impact

  • March had property sale spike of £109 millions compared to £75 millions in Feb
  • The impetus for it was to avoid the extra 3% in Stamp Duty Tax applicable on buying an additional home, being applicable from April 1 2016

Brexit Impact

  • Brexit took place on 23rd June 2016.
  • As can be observed from the month-wise break-up there does not seem to have been dip in property sales in the immediate aftermath of Brexit 
  • Year on Year growth has been 12.71% 
  • So Brexit and Stamp Duty changes have not had negative impact on Basingstoke and Deane Property Market in 2016


Total No Of Properties Sold By Property Type
Basingstoke and Deane - Total No Of Properties Sold By Property Type

The total property sales of £1.1 Billions in 2016 was spread over 3,070 properties.

  • Terraced 980 (31.92%)
  • Detached  744 (24.23%)
  • Flat/Maisonette 638 (20.78%)
  • Semi-Detached 624 (20.33%)
  • Others 84 (2.74%)


Average & Median Sales Price
Basingstoke and Deane - Average & Median Sales Price

 The average sales price in Basingstoke and Deane was £359 K and for the different property types it was:

  • Detached £508 K
  • Semi-Detached £324 K
  • Terraced £260 K
  • Flat/Maisonette £177 K
  • Other £1.82 million

Similarly median sales price in Basingstoke and Deane was £276 K and for the different property types it was:

  • Detached £445 K
  • Semi-Detached £306 K
  • Terraced £250 K
  • Flat/Maisonette £180 K
  • Other £594 K


New Vs Not New Property Statistics
Basingstoke  and Deane - New Vs Not New Property Statistics

By Sales Values the split is as follows:

  • New Property contributed £54 millions (4.88%)
  • Not New Property contributed £1.047 billions (95.12%)

By Total Number the split is as follows:

  • New properties sold were 187 (6.09%)
  • Not new property sold were 2,883 (93.91%).


All Hampshire Posts


RG Postcode Area - RG10, RG12, RG14, RG17, RG18, RG19, RG20, RG21,RG22,RG23,RG24, RG25 Property Market 2016

Please click here for the updated version of this post

This Post covers 

  • Coverage Area of Postcode RG10 to RG25
  • Total Sales By Postcode RG10 to RG25
  • Average & Median Sales Price By Postcode RG10 to RG25
  • Total Number of Sales By Postcode RG10 to RG25
  • Multi Year Property Trend Analysis By Postcode RG10 to RG25
  • Schools for Postcode Area RG
  • Posts for Postcode Area RG


Coverage Area of Postcode RG10 to RG25

Postcode                 Coverage Area           Local Authority Area
RG10 Charvil, Hurst, Ruscombe, Twyford, Wargrave, Waltham St Lawrence Wokingham, Windsor and Maidenhead
RG12 Bracknell (south and town centre), Easthampstead, Bullbrook Bracknell Forest
RG14 Newbury (whole town area) West Berkshire
RG17 Chilton Foliat, Eastbury, Eddington, Kintbury, Hungerford, Inkpen, Lambourn, North Wessex Downs AONB area West Berkshire, Wiltshire
RG18 Hampstead Norreys, Hermitage, Thatcham (north), Yattendon West Berkshire
RG19 Ashford Hill with Headley, Bishop's Green, Greenham, Thatcham (south) West Berkshire, Basingstoke and Deane
RG20 Ashmansworth, Chieveley, Compton, Ecchinswell, Leckhampstead, Highclere, Kingsclere, Sydmonton West Berkshire, Basingstoke and Deane
RG21 Town Centre, Eastrop, Black Dam, Oakridge, South View Basingstoke and Deane
RG22 South Ham, Brighton Hill, Kempshott, Buckskin, Beggarwood Basingstoke and Deane
RG23 Winklebury, Rooksdown, Oakley Basingstoke and Deane
RG24 Popley, Chineham, Sherborne St John Basingstoke and Deane
RG25 Cliddesden, Dummer, Overton, North Waltham Basingstoke and Deane


Total Sales By Postcode in 2016

RG Property Market - Total Sales By Postcode

The Total Sales by the Postcodes are:

  • RG10  £173 millions, RG12  £377 millions, RG14  £323 millions
  • RG17  £110 millions, RG18  £98 millions,   RG19  £152 millions
  • RG20  £154 millions, RG21  £174 millions, RG22  £242 millions
  • RG23  £65 millions,  RG24  £239 millions,  RG25  £52  millions


Average & Median Sales Price By Postcode in 2016

RG Property Market - Average Sales Price By Postcode

RG Property Market - Median Sales Price By Postcode      


Total Number Of Sales By Postcode in 2016

RG Property Market - Total Number Of Sales By Postcode    


Multi Year Property Trend Analysis By Postcode

Postcode Post
RG10 Trend Analysis Details
RG12 Trend Analysis Details
RG14 Trend Analysis Details
RG17 Trend Analysis Details
RG18 Trend Analysis Details
RG19 Trend Analysis Details
RG20 Trend Analysis Details
RG21 Trend Analysis Details
RG22 Trend Analysis Details
RG23 Trend Analysis Details
RG24 Trend Analysis Details
RG25 Trend Analysis Details


Schools for Postcode Area RG


Posts for Postcode Area RG


All RG Postcodes Yearly & Trend Analysis Posts


 Reference

RG Postcode Area As Per Wikipedia

RG Postcode Area - RG1, RG2, RG4, RG5, RG6, RG7, RG8, RG9 Property Market 2016

Please click here for the updated version of this post

This Post covers 

  • Coverage Area of Postcode RG1 to RG9
  • Total Sales By Postcode RG1 to RG9
  • Average & Median Sales Price By Postcode RG1 to RG9
  • Total Number of Sales By Postcode RG1 to RG9
  • Multi Year Property Trend Analysis By Postcode RG1 to RG9
  • Schools for Postcode Area RG
  • Posts for Postcode Area RG


Coverage Area of Postcode RG1 to RG9

Postcode                 Coverage Area          Local Authority Area
RG1 Katesgrove, Newtown, Reading (central) Reading
RG2 Madejski Stadium, Whitley Reading, Wokingham
 RG4 Caversham, Sonning, Sonning Common, Kidmore End, Sonning Eye, Dunsden Green, Mapledurham Reading, South Oxfordshire, Wokingham
RG5 Woodley Wokingham
RG6 Earley Reading, Wokingham
RG7 Aldermaston, Bradfield, Burghfield Common, Riseley, Silchester, Mortimer, Swallowfield, Theale, Woolhampton West Berkshire, Basingstoke and Deane, Wokingham
RG8 Goring, Streatley, Pangbourne, Whitchurch-on-Thames South Oxfordshire, West Berkshire
RG9 Hambleden, Rotherfield Peppard, Turville, Turville Heath, Skirmett, Rockwell End, Mill End, Fawley, Fingest, Frieth, Greenlands, Nettlebed, Shiplake, Henley-on-Thames South Oxfordshire, Wycombe


Total Sales By Postcode in 2016

RG Property Market - Total Sales By Postcode

The Total Sales by the Postcodes are:

  • RG1  £406 millions, RG2  £185 millions,  RG4  £270 millions
  • RG5  £143 millions, RG6  £221 millions,  RG7  £237 millions
  • RG8  £171 millions, RG9  £317 million


Average & Median Sales Price By Postcode in 2016

RG Property Market - Average & Median Sales Price 


Total Number Of Sales By Postcode in 2016

RG Property Market - Total Number Of Sales By Postcode 


Multi Year Property Trend Analysis By Postcode

Postcode Post
RG1 Trend Analysis Details
RG2 Trend Analysis Details
RG4 Trend Analysis Details
RG5 Trend Analysis Details
RG6 Trend Analysis Details
RG7 Trend Analysis Details
RG8 Trend Analysis Details
RG9 Trend Analysis Details


Schools for Postcode Area RG


Property Posts for Postcode Area RG


All RG Postcodes Yearly & Trend Analysis Posts


 Reference

RG Postcode Area As Per Wikipedia


Buckinghamshire Property Market Impacted By Brexit, Declines By 3% in 2016

Story Highlights

  • Buckinghamshire had total property sales of £4.4 Billions in 2016
  • The total number of properties sold in 2016 was 9,568 properties
  • The average sales price in Buckinghamshire was £460 K, whereas median was £350 K
  • Across its districts average sales price was maximum for South Bucks £760 K
  • New Property sales were 9.52% by value, where as Not New Property contributed 90.48%
  • Stamp duty hike caused monthly spike in March
  • Brexit coupled with Stamp Duty Hike had negative impact on Buckinghamshire Property Market in 2016, causing decline of 3.3% over 2015


Buckinghamshire is one of the counties of South East England. The districts of Buckinghamshire are Aylesbury Vale, Wycombe, Chiltern, South Bucks


Let us look at the Buckinghamshire  Property Market for 2016 in detail.


Total Sales By Districts

Buckinghamshire - Total Sales By Districts

Buckinghamshire had total property sales of £4.4 Billions which was 7.11% of the total South East property Market in 2016

The split of the sales across the different districts was:

Year on Year Comparison : Compared to Buckinghamshire Property Market 2015 in 2016


Total Sales By Property Type
Buckinghamshire - Total Sales By Property Type

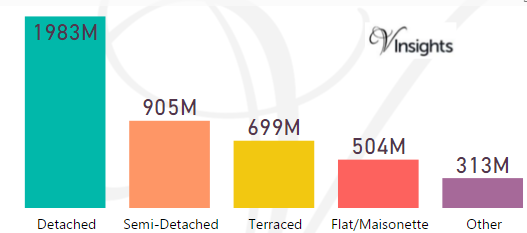
The split of £4.4 Billions in Buckinghamshire across the different property types are:

  • Detached £1.98 billions (45.02%)
  • Semi-Detached £905 millions (20.55%)
  • Terraced £699 millions (15.88%)
  • Flat/Maisonette £504 millions (11.44%
  • Other £313 millions (7.11%)

Year on Year Comparison : Compared to Buckinghamshire Property Market 2015 in 2016

  • All the property types sales have shown decline except Semi-Detached, Flat/Maisonette


Month-wise Break-up of Total Sales
Buskinghamshire - Month-wise Break-up of Total Sales

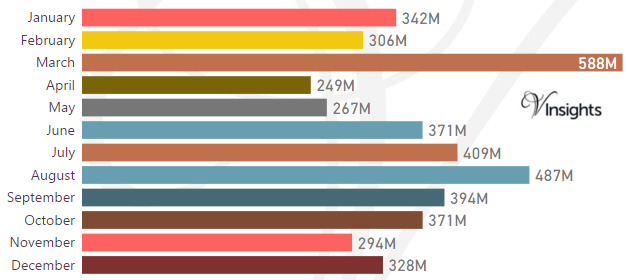
Some of the insights based on the £4.4 Billions month-wise break-down :

Stamp Duty Hike Impact

  1. March had property sale spike of £588 millions compared to £306 millions in Feb
  2. The impetus for it was to avoid the extra 3% in Stamp Duty Tax applicable on buying an additional home, being applicable from April 1 2016

Brexit Impact

  1. Brexit took place on 23rd June 2016.
  2. As can be observed from the month-wise break-up there does not seem to have been dip in property sales in the immediate aftermath of Brexit 
  3. Year on Year decline (compared to 2015) has been 3.30% in 2016
  4. Brexit coupled with Stamp Duty Hike had negative impact on Buckinghamshire Property Market in 2016


Total No Of Properties Sold By Property Type
Buckinghamshire - Total No Of Properties Sold By Property Type

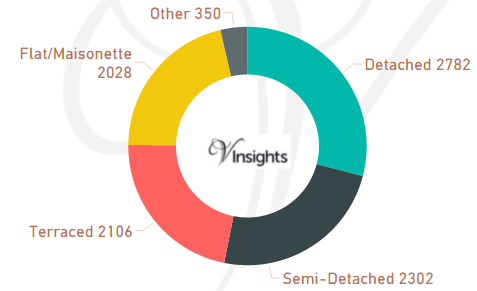
Buckinghamshire had total property sales of 9,568.  The split across different property types are:

  • Detached  2,782 (29.08%)
  • Semi-Detached 2,302 (24.06%)
  • Terraced  2,106 (22.01%)
  • Flat/Maisonette 2,028 (21.2%)
  • Other  350 (3.66%)

Year on Year Comparison :  Compared to Buckinghamshire Property Market 2015 in 2016

  • Total number of property sales in 2016 has decreased by  5.53%.
  • All property types have shown decline in number of properties sold except property type Flat/Maisonette, Other
  • Other has shown significant increase  of 103.5% 


Average & Median Sales PriceBuckinghamshire - Average & Median Sales Price
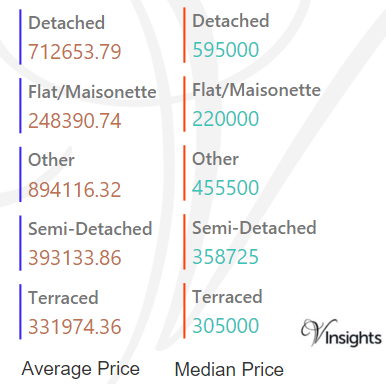
The average sales price in Buckinghamshire was £460 K. For the different property types it was

  • Detached at £713 K
  • Semi-Detached at £393 K
  • Terraced at £332 K
  • Flat/Maisonette at £248 K
  • Other it is at £894 K

Similarly median sales price in Buckinghamshire was £350 K. For different property types it was

  • Detached at £595 K
  • Semi-Detached at £359 K
  • Terraced at £305 K
  • Flat/Maisonette at £220 K
  • Other it is at £456 K

Year on Year Comparison : Compared to Buckinghamshire Property Market 2015 in 2016

  • The average and median property prices have gone up except for property type Other
  • Other has had decline in average and median property price


Average & Median Sales Price By Districts
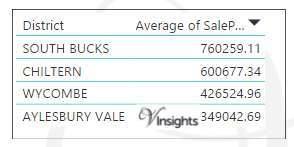
Buckinghamshire - Average Sales Price By Districts

Across districts the average sales price is as above.
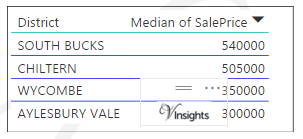
 

Buckinghamshire - Median Sales Price By Districts

Across districts the median sales price is as above.

 Year on Year Comparison : Compared to Buckinghamshire Property Market 2015 in 2016

  • The average sales price across all the counties have gone up except for Chiltern
  • The median sales price across all the counties have gone up


New Vs Not New Property Statistics
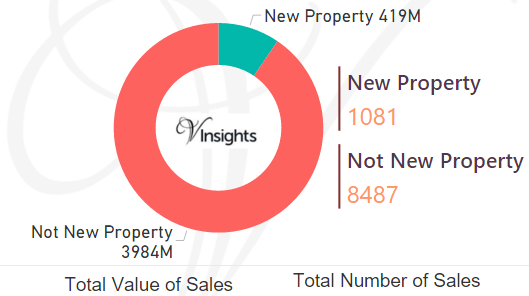
Buckinghamshire - New Vs Not New Property Statistics

By Sales Value the split is as follows:

  • New Property contributed £419 millions (9.52%)
  • Not New Property contributed £3.98 billions (90.48%)

By Total Number the split is as follows:

  • New properties sold were 1,081 (11.3%)
  • Not new property sold were 8,487 (88.7%)

Year on Year Comparison : Compared to Buckinghamshire Property Market 2015 in 2016

  • New property market share in property market has gone down


All Buckinghamshire Posts 


Brighton and Hove Property Market Grows 3.95% in 2016, Not Impacted By Stamp Duty Hike and Brexit

Story Highlights

  • Brighton And Hove had total property sales of £2.16 Billions in 2016
  • The total number of properties sold in 2016 was 5,392 properties
  • The average sales price in Brighton And Hove was £401 K, whereas median was £325 K
  • New Property sales were 5.24% by value and Not New contributed 94.76%
  • Stamp duty hike caused monthly spike in March
  • Year on Year growth over 2015 has been 3.95% so there has been no negative impact of Brexit and Stamp Duty Hike


Brighton and Hove is an unitary authority area in South East England.

Total Sales By Property TypeBrighton and Hove - Total Sales By Property Type

Brighton and Hove had total property sales of  £2.16 Billions which was 3.5% of the  South East England property Market in 2016

The split across the different property types in Brighton And Hove are:

  • Flat/Maisonette £802 millions (37.08%)
  • Terraced £562 millions (25.97%)
  • Semi-Detached £327 millions (15.13%)
  • Detached £292 millions (13.51%)
  • Other £180 millions (8.3%)

Year on Year Comparison : Compared to Brighton And Hove Property Market 2015 in 2016

  • All the property types total sales have shown growth except Detached


Brighton And Hove Property Market at Postcode level

Postcode Coverage Area School Local Authority Area
BN1 Brighton,Coldean,Falmer,Hollingbury,Patcham,Presto n,Stanmer,Withdean Details Brighton and Hove,Lewes
BN2 Brighton,Bevendean,Brighton Marina,Kemptown,Moulse coomb,Ovingdean,Rottingdean,Saltdean,Woodingdean Details Brighton and Hove, Lewes
BN3 Hove,Aldrington,Hangleton,West Blatchington Details Brighton and Hove
BN41 Fishersgate,Portslade Details Adur, Brighton and Hove 


Month-wise Break-up of Total Sales

Brighton and Hove - Month-wise Break-up of Total Sales

Some of the insights based on the £2.16 Billions month-wise break-down :

Stamp Duty Hike Impact

  1. March had property sale spike of £374 millions compared to £156 millions in Feb
  2. The impetus for it was to avoid the extra 3% in Stamp Duty Tax applicable on buying an additional home, being applicable from April 1 2016

Brexit Impact

  1. Brexit took place on 23rd June 2016.
  2. As can be observed from the month-wise break-up there does not seem to have been dip in property sales in the immediate aftermath of Brexit 
  3. Year on Year growth has been 3.95% so there does not seem to have been negative impact of Brexit and Stamp Duty Hike


Total No Of Properties Sold By Property Type

Brighton and Hove - Total No Of Properties Sold By Property Type

Brighton And Hove had total property sales of 5,392.  The split across the different property types are:

  • Flat/Maisonette 2,759 (51.17%)
  • Terraced  1,230 (22.81%)
  • Semi-Detached 750 (%)
  • Detached 466 (13.91%)
  • Other 187 (3.47%)

Year on Year Comparison : Compared to Brighton And Hove Property Market 2015 in 2016

  • Total number of property sales in 2016 has decreased by  5.62%.
  • All property types have shown decline in number of properties sold except property type Other.
  • Other has shown significant increase  of 80% 


Average & Median Sales Price

Brighton and Hove - Average & Median Sales Price


The average sales price in Brighton And Hove was £401 K and for different property types it was:

  • Detached £627 K
  • Semi-Detached £437 K
  • Terraced £457 K
  • Flat/Maisonette £291 K
  • Other it is £961 K

Similarly median sales price in Brighton And Hove was £325 K and for different property types are:

  • Detached £508 K
  • Semi-Detached £370 K
  • Terraced £415 K
  • Flat/Maisonette £260 K
  • Other it is £300 K

Year on Year Comparison : Compared to Brighton And Hove Property Market 2015 in 2016

  • The average and median property prices have gone up except for property type Other
  • Other has had decline in average and median property price


New Vs Not New Property Statistics

Brighton and Hove - New Vs Not New Property Statistics

By Sales Values the split is as follows:

  • New Property contributed £113 millions (5.24%)
  • Not New Property contributed £2.05 billions (94.76%)

By Total Number the split is as follows:

  • New properties sold were 285 (5.29%)
  • Not new property sold were  5,107 (94.71%)

Year on Year Comparison : Compared to Brighton And Hove Property Market 2015 in 2016

  • New property market share in property market has gone up in 2016 over 2015

All South East England Post