Story Highlights
- Hastings had total property sales of £444 millions in 2016
- The total number of properties sold in 2016 was 2,021 properties
- The average sales price in Hastings was £220 K
- New Property sales were 1.39% by value, where as Not New 98.61%
- Stamp duty hike caused monthly spike in March
- Brexit coupled and Stamp Duty Hike did not have negative impact , there was growth of 10.72% in 2016 over 2015
Hastings is one of the districts of East of Sussex
Total Sales By Property Type
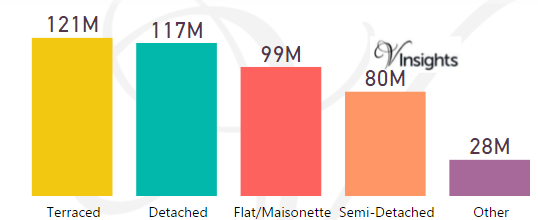
Hastings had total property sales of £444 millions which was 12.81% of the East of Sussex Property Market 2016
The split across the different property types are:
- Terraced £121 millions (27.21%)
- Detached £117 (26.33%)
- Flat/Maisonette £99 millions (22.21%)
- Semi-Detached £80 millions (17.97 %)
- Other £28 millions (6.28%)
Hastings Property Market at Postcode level
| Postcode |
Coverage Area |
School |
Local Authority Area |
| TN34 |
Hastingstown centre |
Details |
Hastings |
| TN35 |
Hastings,Pett,Guestling,Westfield |
Details |
Hastings, Rother |
| TN37 |
St Leonards-on-Sea |
Details |
Hastings |
| TN38 |
St Leonards-on-Sea,Silverhill, Wishing Tree,North Hastings,Bulverhythe |
Details |
Hastings |
Month-wise Break-up of Total Sales
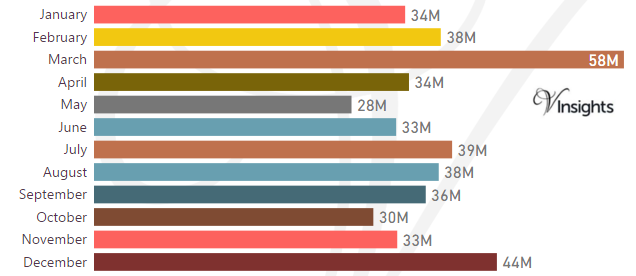
Some of the insights based on the £444 millions month-wise break-down :
Stamp Duty Hike Impact
- March had property sale spike of £58 millions compared to £38 millions in Feb
- The impetus for it was to avoid the extra 3% in Stamp Duty Tax applicable on buying an additional home, being applicable from April 1 2016
Brexit Impact
- Brexit took place on 23rd June 2016.
- As can be observed from the month-wise break-up there does not seem to have been dip in property sales in the immediate aftermath of Brexit
- Year on Year growth has been 10.72% in 2016 over 2015
- So Brexit and Stamp Duty changes did not have negative impact on the Wealden Property Market in 2016
Total No Of Properties Sold By Property Type
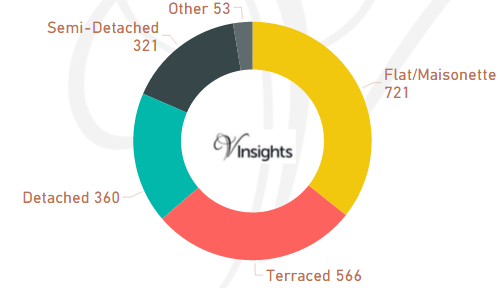
The total property sales of £444 millions in 2016 was spread over 2,021 properties.
- Flat/Maisonette 721(35.68%)
- Terraced properties was 566(28.01%)
- Detached 360(17.81%)
- Semi-Detached 321(15.88%)
- Others 53(2.62%)
Average & Median Sales Price
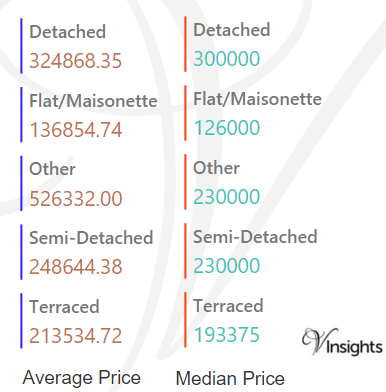
The average sales price in Hastings was £220 K and for the different property types it was:
- Detached £325 K
- Semi-Detached £249 K
- Terraced £214 K
- Flat/Maisonette £137 K
- Other £526 K
Similarly median sales price in Hastings was £192 K and for the different property types was:
- Detached £300 K
- Semi-Detached £230 K
- Terraced £193 K
- Flat/Maisonette £126 K
- Other £230 K
New Vs Not New Property Statistics
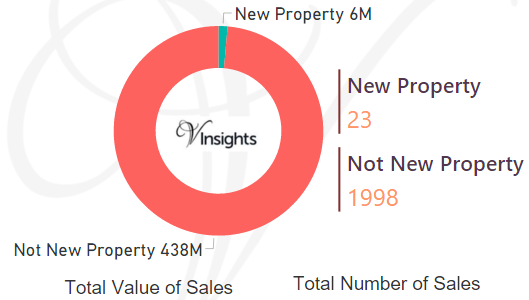
By Sales Values the split is as follows:
- New Property contributed £6 millions (1.39%)
- Not New Property contributed £438 millions (98.61%)
By Total Number the split is as follows:
- New properties sold were 23 (1.14%)
- Not new property sold were 1,998 (98.86%)
All East of Sussex Posts

4cfae898-c967-46ed-a30b-bc0e6a12569a|0|.0|27604f05-86ad-47ef-9e05-950bb762570c
Story Highlights
- Fareham had total property sales of £649 millions in 2016
- The total number of properties sold in 2016 was 2,173 properties
- The average sales price in Fareham was £299 K
- New Property sales were 6.26% by value, where as Not New 93.74%
- Stamp duty hike caused monthly spike in March
- Brexit coupled with Stamp Duty Hike have had significant negative impact on Fareham Property Market in 2016, there was decline of 22.6% over 2015
Fareham is one of the districts in Hampshire
Total Sales By Property Type
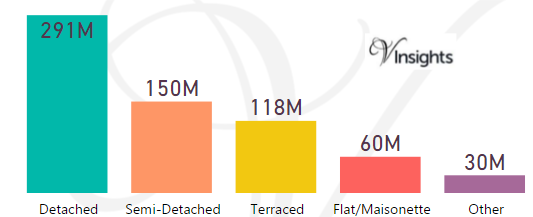
Fareham had total property sales of £649 millions, which was 7.16% of the total Hampshire property Market in 2016
The split across the different property types are:
- Detached £291 millions (44.85%)
- Semi-Detached £150 millions (23.12%)
- Terraced £118 millions (18.25%)
- Flat/Maisonette £60 millions (9.22%)
- Other £30 millions (4.56%)
Fareham Property Market at Postcode Level
Month-wise Break-up of Total Sales
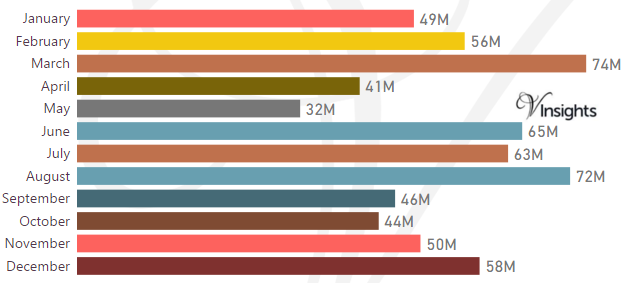
Some of the insights based on the £649 millions month-wise break-down :
Stamp Duty Hike Impact
- March had property sale spike of £74 millions compared to £56 millions in Feb
- The impetus for it was to avoid the extra 3% in Stamp Duty Tax applicable on buying an additional home, being applicable from April 1 2016
Brexit Impact
- Brexit took place on 23rd June 2016.
- Year on Year decline has been 22.6%
- So Brexit and Stamp Duty changes have had significant negative impact on Hampshire Property Market in 2016
Total No Of Properties Sold By Property Type
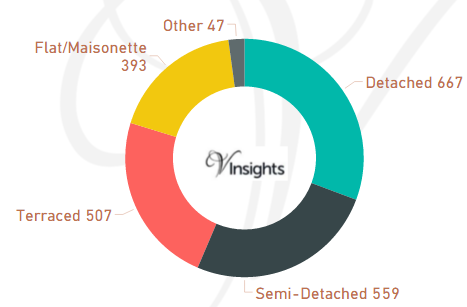
The total property sales of £649 millions in 2016 was spread over 2,173 properties.
- Detached 667 (30.69%)
- Semi-Detached 559 (25.72%)
- Terraced 507 (23.33%)
- Flat/Maisonette 393 (18.09%)
- Other 47 (2.16%)
Average & Median Sales Price
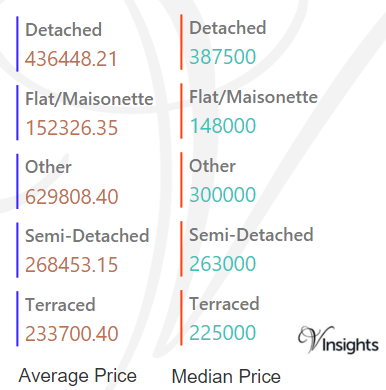
The average sales price in Fareham was £299 K and for the different property types it was:
- Detached £437 K
- Semi-Detached £269 K
- Terraced £234 K
- Flat/Maisonette £152 K
- Other £630 K
Similarly median sales price in Fareham was £260 K and for the different property types it was:
- Detached £388 K
- Semi-Detached £263 K
- Terraced £225 K
- Flat/Maisonette £148 K
- Other £300 K
New Vs Not New Property Statistics

By Sales Values the split is as follows:
- New Property contributed £41 millions (6.26%)
- Not New Property contributed £608 millions (93.74%)
By Total Number the split is as follows:
- New properties sold were 181 (8.33%)
- Not new property sold were 1,992 (91.67%)
All Hampshire Posts
fb77e8fa-0490-4d4a-954a-89f1f033989e|0|.0|27604f05-86ad-47ef-9e05-950bb762570c
Story Highlights
- Lewes had total property sales of £644 millions in 2016
- The total number of properties sold in 2016 was 1,821 properties
- The average sales price in Lewes was £354 K
- New Property sales were 5.36% by value, where as Not New 94.64%
- Stamp duty hike caused monthly spike in March
- Brexit coupled and Stamp Duty Hike did not have negative impact , there was growth of 5.4%in 2016 over 2015
Lewes is one of the districts of East of Sussex
Total Sales By Property Type
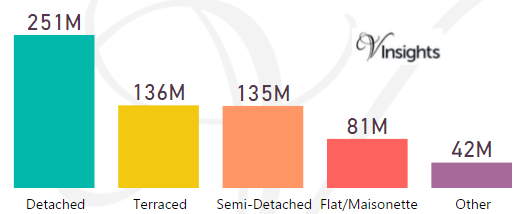
Wealden had total property sales of £644 millions which was 18.58% of the East of Sussex Property Market 2016
The split across the different property types are:
- Detached £251 millions (38.91%)
- Terraced £136 millions (21.06%)
- Semi-Detached £135 millions (20.92%)
- Flat/Maisonette £81 millions (12.55%)
- Other £42 millions (6.55%)
Lewes Property Market at Postcode level
| Postcode |
Coverage Area |
School |
Local Authority Area |
| BN1 |
Brighton,Coldean,Falmer,Hollingbury,Patcham,Presto n,Stanmer,Withdean |
Details |
Brighton and Hove, Lewes |
| BN2 |
Brighton,Bevendean,Brighton Marina,Kemptown,Moulse coomb,Ovingdean,Rottingdean,Saltdean,Woodingdean |
Details |
Brighton and Hove, Lewes |
| BN6 |
Hassocks,Albourne,Clayton,Ditchling,Goddards Green ,Hurstpierpoint,Keymer,Newtimber,Sayers Common,Str eat,Westmeston |
Details |
Lewes, Mid Sussex |
| BN7 |
Lewes,Cooksbridge,East Chiltington,Iford,Kingston, Offham,Plumpton,Plumpton Green,Rodmell,Southease, Swanborough,Telscombe |
Details |
Lewes |
| BN8 |
Barcombe,Barcombe Cross,Beddingham, Chailey Green, Chiddingly,East Hoathly,Firle,Glynde,Halland,Hamse y, Holmes Hill,Laughton,Newick,North Chailey,Ringm er,Ripe,Shortgate,South Chailey, Southerham, Stone ham, Whitesmith |
Details |
Lewes,Wealden |
| BN9 |
Newhaven,Piddinghoe,South Heighton,Tarring Neville |
Details |
Lewes |
| BN10 |
Peacehaven,Telscombe Cliffs |
Details |
Lewes |
| BN25 |
Seaford,Bishopstone,Cuckmere Haven,Exceat, Norton, Rookery Hill,Westdean |
Details |
Lewes, Wealden |
| RH15 |
Burgess Hill, Ditchling Common |
Details |
Mid Sussex, Lewes |
| RH17 |
Ansty,Ardingly,Balcombe,Bolney, Chelwood Gate,Cuck field,Danehill,Handcross,Hickstead,Horsted Keynes, Wivelsfield,Wivelsfield Green |
Details |
Mid Sussex, Lewes,Wealden |
Month-wise Break-up of Total Sales
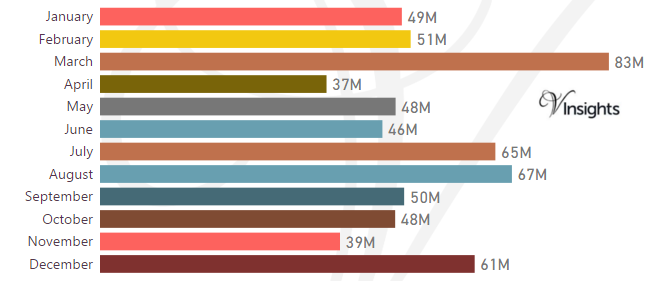 Some of the insights based on the £644 millions month-wise break-down :
Stamp Duty Hike Impact
- March had property sale spike of £83 millions compared to £51 millions in Feb
- The impetus for it was to avoid the extra 3% in Stamp Duty Tax applicable on buying an additional home, being applicable from April 1 2016
Brexit Impact
- Brexit took place on 23rd June 2016.
- As can be observed from the month-wise break-up there does not seem to have been dip in property sales in the immediate aftermath of Brexit
- Year on Year growth has been 5.4%in 2016 over 2015
- So Brexit and Stamp Duty changes did not have negative impact on the Lewes Property Market in 2016
Total No Of Properties Sold By Property Type
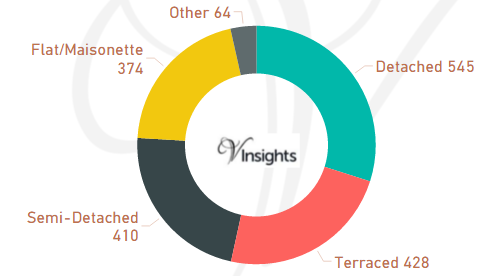
The total property sales of £644 millions in 2016 was spread over 1,821 properties.
- Detached 545 (29.93%)
- Terraced 428 (23.5%)
- Semi-Detached 410 (22.52%)
- Flat/Maisonette 374 (20.54%)
- Others 64 (3.51%)
Average & Median Sales Price
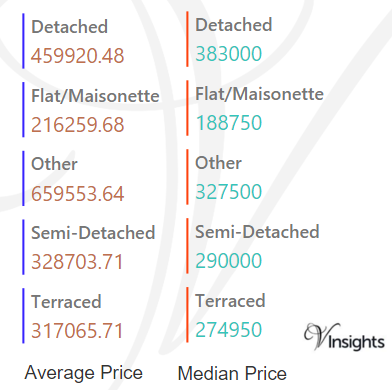
The average sales price in Lewes was £354 K and for the different property types it was:
- Detached £460 K
- Semi-Detached £329 K
- Terraced £317 K
- Flat/Maisonette £216 K
- Other it was £660 K
Similarly median sales price in Lewes was £295 K and for the different property types was:
- Detached £383 K
- Semi-Detached £290 K
- Terraced £275 K
- Flat/Maisonette £189 K
- Other it is £328 K
New Vs Not New Property Statistics
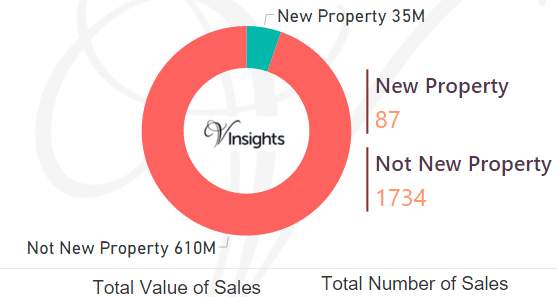
By Sales Values the split is as follows:
- New Property contributed £35 millions (5.36%)
- Not New Property contributed £610 millions (94.64%)
By Total Number the split is as follows:
- New properties sold were 87 (4.78%)
- Not new property sold were 1,734 (95.22%)
All East of Sussex Posts
257e6487-fe68-414a-8844-f692be2cffd0|0|.0|27604f05-86ad-47ef-9e05-950bb762570c
Story Highlights
- Eastleigh had total property sales of £795 millions in 2016
- The total number of properties sold in 2016 was 2,389 properties
- The average sales price in Eastleigh was £333 K
- New Property sales were 6.9% by value, where as Not New 93.1%
- Stamp duty hike caused monthly spike in March
- Brexit coupled with Stamp Duty Hike have not had negative impact on Eastleigh Property Market in 2016, there was growth of 10.26% over 2015
Eastleigh is one of the districts in Hampshire
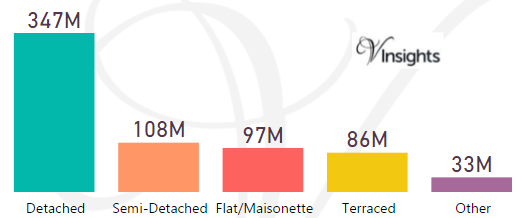
Total Sales By Property Type
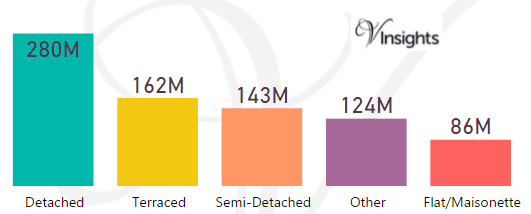
Eastleigh had total property sales of £795 millions, which was 8.77% of the total Hampshire property Market in 2016
The split across the different property types are:
- Detached £280 millions (35.23%)
- Terraced £162 millions (20.38%)
- Semi-Detached £143 millions (18.02%)
- Other £124 millions (15.62%)
- Flat/Maisonette £86 millions (10.75%)
Eastleigh Property Market at Postcode Level
| Postcode |
Coverage Area |
School |
Local Authority Area |
| SO18 |
Bitterne,Bitterne Park,Harefield,Townhill Park,Cha rtwell Green,Southampton Airport |
Details |
Southampton, Eastleigh |
| SO30 |
Botley,Hedge End,West End |
Details |
Eastleigh |
| SO31 |
Warsash,Hamble-le-Rice,Locks HeathNetley Abbey |
Details |
Eastleigh,Fareham |
| SO32 |
Bishops Waltham,Corhampton,Droxford,Durley,Exton,M eonstoke,Shedfield,Soberton,Swanmore,Upham,Warnfor d,Wickham |
Details |
Eastleigh,Winchester |
| SO50 |
Town Centre, Fair Oak, Bishopstoke, Horton Heath, |
Details |
Eastleigh |
| SO53 |
Chandlers Ford |
Details |
Eastleigh,Test Valley |
Month-wise Break-up of Total Sales
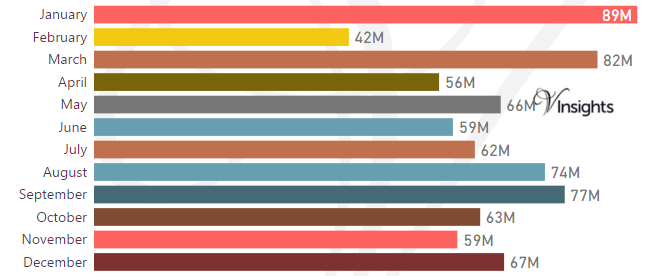
Some of the insights based on the £795 millions month-wise break-down :
Stamp Duty Hike Impact
- March had property sale spike of £82 millions compared to £42 millions in Feb
- The impetus for it was to avoid the extra 3% in Stamp Duty Tax applicable on buying an additional home, being applicable from April 1 2016
Brexit Impact
- Brexit took place on 23rd June 2016.
- As can be observed from the month-wise break-up there does not seem to have been dip in property sales in the immediate aftermath of Brexit
- Year on Year growth has been 10.26%
- So Brexit and Stamp Duty changes have not had negative impact on Basingstoke and Deane Property Market in 2016
Total No Of Properties Sold By Property Type
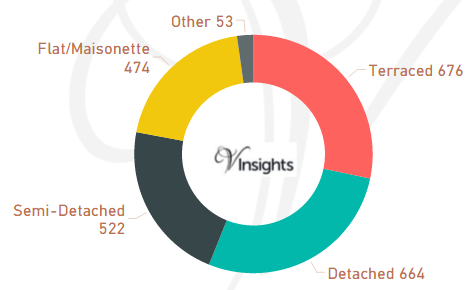
The total property sales of £795 millions in 2016 was spread over 2,389 properties.
- Terraced 676 (28.3%)
- Detached 664 (27.79%)
- Semi-Detached 522 (21.85%)
- Flat/Maisonette 474 (19.84%)
- Other 53 (2.22%)
Average & Median Sales Price
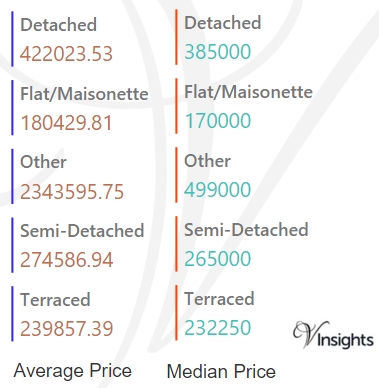
The average sales price in Eastleigh was £333 K and for the different property types it was:
- Detached £422 K
- Semi-Detached £275 K
- Terraced £240 K
- Flat/Maisonette £180 K
- Other £2.34 million
Similarly median sales price in Eastleigh was £258 K and for the different property types it was:
- Detached £385 K
- Semi-Detached £265 K
- Terraced £232 K
- Flat/Maisonette £170 K
- Other £499 K
New Vs Not New Property Statistics
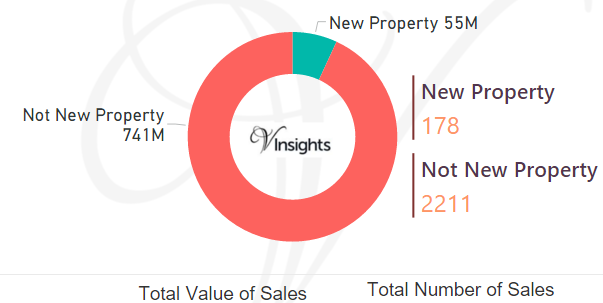
By Sales Value the split is as follows:
- New Property contributed £55 millions (6.9%)
- Not New Property contributed £741 millions (93.1%)
By Total Number the split is as follows:
- New properties sold were 178 (7.45%)
- Not new property sold were 2,211 (92.55%).
All Hampshire Posts
5ce79bda-aa84-40b0-82b6-5e96947e3ee4|0|.0|27604f05-86ad-47ef-9e05-950bb762570c
Story Highlights
- Rother had total property sales of £672 millions in 2016
- The total number of properties sold in 2016 was 2,233 properties
- The average sales price in Rother was £301 K
- New Property sales were 2.93% by value, where as Not New 97.07%
- Stamp duty hike caused monthly spike in March
- So Brexit and Stamp Duty changes have stagnated Rother property market and it suffered decline of 0.44% over 2015
Rother is one of the districts of East of Sussex
Total Sales By Property Type
Rother had total property sales of £672 millions which was 19.36% of the East of Sussex Property Market 2016
The split across the different property types are:
- Detached £347 (51.69%)
- Semi-Detached £108 millions (16.13%)
- Flat/Maisonette £97 millions (14.42%)
- Terraced £86 millions (12.88%)
- Other £33 millions (4.89%)
Rother Property Market at Postcode level
| Postcode |
Coverage Area |
School |
Local Authority Area |
| TN5 |
Wadhurst,Ticehurst, Tidebrook, Stonegate |
Details |
Rother,Wealden |
| TN19 |
Etchingham |
Details |
Rother |
| TN21 |
Heathfield,Broad Oak,Horam,Cross in Hand |
Details |
Rother, Wealden |
| TN31 |
Rye,Camber |
Details |
Rother |
| TN32 |
Robertsbridge,Mountfield,Bodiam,Brightling |
Details |
Rother |
| TN33 |
Battle |
Details |
Rother, Wealden |
| TN35 |
Hastings,Pett,Guestling,Westfield |
Details |
Hastings, Rother |
| TN36 |
Winchelsea,Icklesham |
Details |
Rother |
| TN39 |
Bexhill-on-Sea,Cooden |
Details |
Rother |
| TN40 |
Bexhill-on-Sea, Pebsham |
Details |
Rother |
Month-wise Break-up of Total Sales
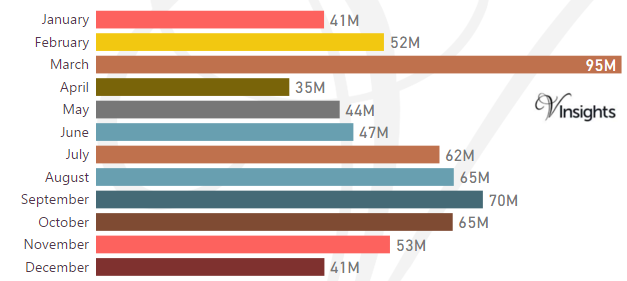
Some of the insights based on the £672 millions month-wise break-down :
Stamp Duty Hike Impact
- March had property sale spike of £95 millions compared to £52 millions in Feb
- The impetus for it was to avoid the extra 3% in Stamp Duty Tax applicable on buying an additional home, being applicable from April 1 2016
Brexit Impact
- Brexit took place on 23rd June 2016.
- As can be observed from the month-wise break-up there does not seem to have been dip in property sales in the immediate aftermath of Brexit
- Year on Year property sales has shown a decline of 0.44 % compared to 2015
- So Brexit and Stamp Duty changes have stagnated Rother property market and it suffered decline of 0.44%
Total No Of Properties Sold By Property Type
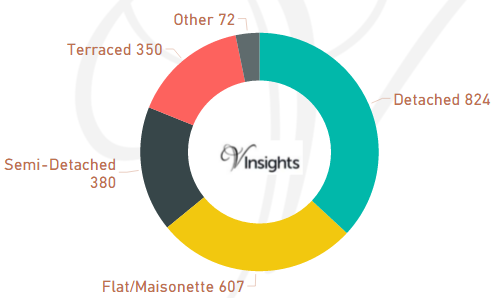
The total property sales of £672 millions in 2016 was spread over 2,233 properties.
- Detached 824 (36.9%)
- Flat/Maisonette 607 (27.18%)
- Semi-Detached 380 (17.02%)
- Terraced 350 (15.67%)
- Others 72 (3.22%)
Average & Median Sales Price
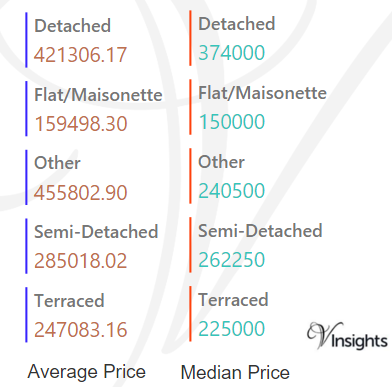
The average sales price in Rother was £301 K and for the different property types it was:
- Detached £421 K
- Semi-Detached £285 K
- Terraced £247 K
- Flat/Maisonette £160 K
- Other it was £456 K
Similarly median sales price in Rother was £263 K and for the different property types was:
- Detached £374 K
- Semi-Detached £263 K
- Terraced £225 K
- Flat/Maisonette £150 K
- Other it is £241 K
New Vs Not New Property Statistics

By Sales Values the split is as follows:
- New Property contributed £20 millions (2.93%)
- Not New Property contributed £652 millions (97.07%)
By Total Number the split is as follows:
- New properties sold were 64(2.87%)
- Not new property sold were 2169 (97.13%)
All East of Sussex Posts
76947a2e-f00d-47ad-98b0-bf5828982bbd|0|.0|27604f05-86ad-47ef-9e05-950bb762570c