Story Highlights
- Havant had total property sales of £651 millions in 2016
- The total number of properties sold in 2016 was 2,275 properties
- The average sales price in Havant was £286 K
- New Property sales were 16.03% by value, where as Not New 83.97%
- Stamp duty hike caused monthly spike in March
- Brexit coupled with Stamp Duty Hike have not had negative impact on Havant Property Market in 2016, there was growth of 9.96% over 2015
Havant is one of the districts in Hampshire
Total Sales By Property Type
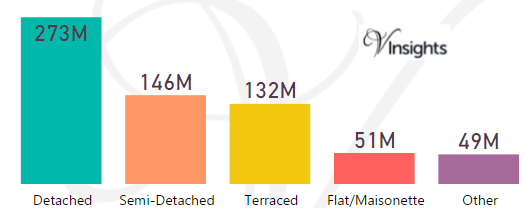
Havant had total property sales of £651 millions, which was 7.18% of the total Hampshire property Market in 2016
The split across the different property types are:
- Detached £273 millions (41.95%)
- Semi-Detached £146 millions (22.4%)
- Terraced £132 millions (20.22%)
- Flat/Maisonette £51 millions (7.89%)
- Other £49 millions (7.54%)
Havant Property Market at Postcode Level
| Postcode |
Coverage Area |
School |
Local Authority Area |
| PO7 |
Waterlooville,Denmead,Purbrook |
Details |
Havant, Winchester |
| PO8 |
Clanfield,Cowplain,Horndean |
Details |
Havant, East Hampshire |
| PO9 |
Havant |
Details |
Havant |
| PO9 |
Rowlands Castle |
Details |
East Hampshire, Havant |
| PO10 |
Emsworth,Southbourne,Westbourne |
Details |
Havant |
| PO11 |
Hayling Island |
Details |
Havant |
Month-wise Break-up of Total Sales
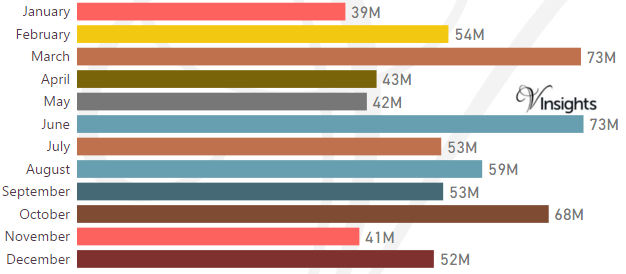
Some of the insights based on the £651 millions month-wise break-down :
Stamp Duty Hike Impact
- March had property sale spike of £73 millions compared to £54 millions in Feb
- The impetus for it was to avoid the extra 3% in Stamp Duty Tax applicable on buying an additional home, being applicable from April 1 2016
Brexit Impact
- Brexit took place on 23rd June 2016.
- Year on Year growth has been 9.96%
- So Brexit and Stamp Duty changes have not had negative impact on Havant Property Market in 2016
Total No Of Properties Sold By Property Type
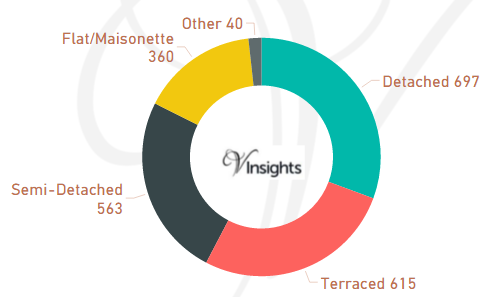
The total property sales of £651 millions in 2016 was spread over 2,275 properties.
- Detached 697 (30.64%)
- Terraced 615 (27.03%)
- Semi-Detached 563 (24.75%)
- Flat/Maisonette 360 (15.82%)
- Others 40 (1.76%)
Average & Median Sales Price
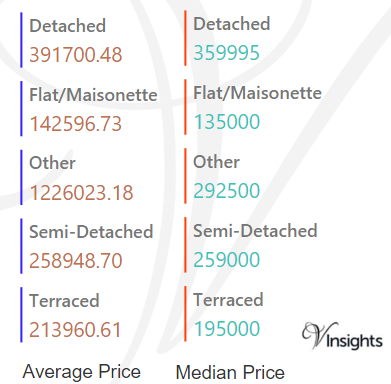
The average sales price in Havant was £286 K and for the different property types it was:
- Detached £392 K
- Semi-Detached £259 K
- Terraced £214 K
- Flat/Maisonette £143 K
- Other £1.23 million
Similarly median sales price in Havant was £245 K and for the different property types it was:
- Detached £360 K
- Semi-Detached £259 K
- Terraced £195 K
- Flat/Maisonette £135 K
- Other £293 K
New Vs Not New Property Statistics
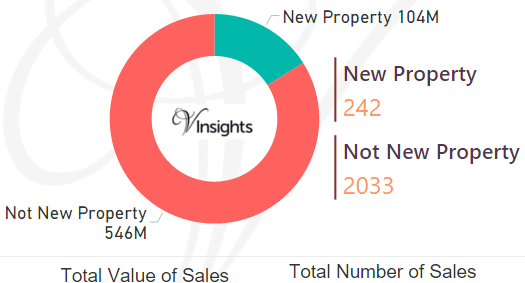
By Sales Values the split is as follows:
- New Property contributed £104 millions (16.03%)
- Not New Property contributed £546 millions (83.97%)
By Total Number the split is as follows:
- New properties sold were 242 (10.64%)
- Not new property sold were 2,033 (89.36%).
All Hampshire Posts

2dcef431-1028-4629-9a45-68cba1d109a3|0|.0|27604f05-86ad-47ef-9e05-950bb762570c
Story Highlights
- Hart had total property sales of £817 millions in 2016
- The total number of properties sold in 2016 was 1,821 properties
- The average sales price in Hart was £449 K
- New Property sales were 14.36% by value, where as Not New 85.64%
- Stamp duty hike caused monthly spike in March
- Brexit coupled with Stamp Duty Hike have not had negative impact on Hart Property Market in 2016, there was growth of 6.1 % over 2015
Hart is one of the districts in Hampshire
Total Sales By Property Type
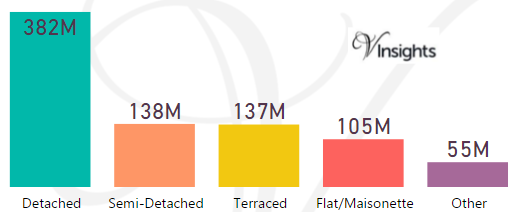
Hart had total property sales of £817 millions, which was 9.01% of the total Hampshire property Market in 2016
The split across the different property types are:
- Detached £382 millions (46.76%)
- Semi-Detached £138 millions (16.92%)
- Terraced £137 millions (16.76%)
- Flat/Maisonette £105 millions (12.84%)
- Other £55 millions (6.72%)
Hart Property Market at Postcode Level
| Postcode |
Coverage Area |
School |
Local Authority Area |
| GU10 |
Bentley,Frensham,Churt,Crondall,Tongham,Ewshot,Sea le,Tilford,Wrecclesham |
Details |
Waverley,East Hampshire, Guildford, Hart |
| GU17 |
Blackwater,Hawley, Minley,Darby Green,Frogmore,Bla ckbushe |
Details |
Hart |
| GU46 |
Yateley |
Details |
Hart |
| GU51 |
Fleet,Elvetham Heath |
Details |
Hart |
| GU52 |
Church Crookham,Crookham Village |
Details |
Hart |
| RG27 |
Hook,Sherfield-on-Loddon,Stratfield Turgis,Turgis Green |
Details |
Basingstoke and Deane, Hart |
| RG29 |
Long Sutton,Odiham, North Warnborough, South Warnb orough |
Details |
Hart |
Month-wise Break-up of Total Sales
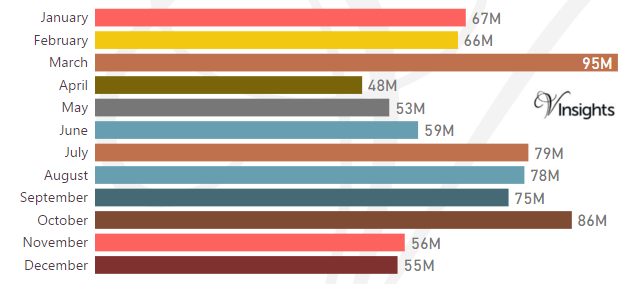
Some of the insights based on the £817 millions month-wise break-down :
Stamp Duty Hike Impact
- March had property sale spike of £95 millions compared to £66 millions in Feb
- The impetus for it was to avoid the extra 3% in Stamp Duty Tax applicable on buying an additional home, being applicable from April 1 2016
Brexit Impact
- Brexit took place on 23rd June 2016.
- Year on Year growth has been 6.1%
- So Brexit and Stamp Duty changes have not had negative impact on Hart Property Market in 2016
Total No Of Properties Sold By Property Type
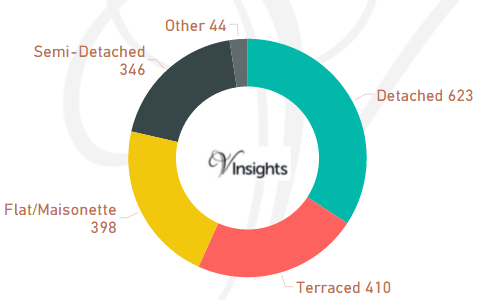
The total property sales of £817 millions in 2016 was spread over 1,821 properties.
- Detached 623 (34.21%)
- Terraced 410 (22.52%)
- Flat/Maisonette (21.86%)
- Semi-Detached 398 (19%)
- Other 44 (2.42%)
Average & Median Sales Price
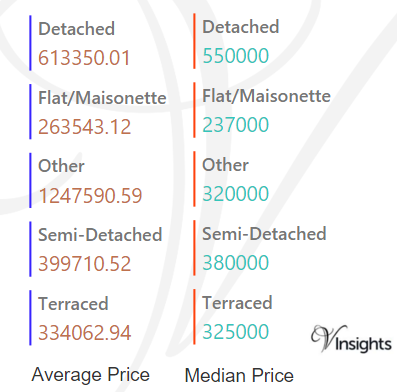
The average sales price in Hart was £449 K and for the different property types it was:
- Detached £613 K
- Semi-Detached £400 K
- Terraced £334 K
- Flat/Maisonette £264 K
- Other £1.25 million
Similarly median sales price in Hart was £380 K and for the different property types it was:
- Detached £550 K
- Semi-Detached £380 K
- Terraced £325 K
- Flat/Maisonette £237 K
- Other £320 K
New Vs Not New Property Statistics
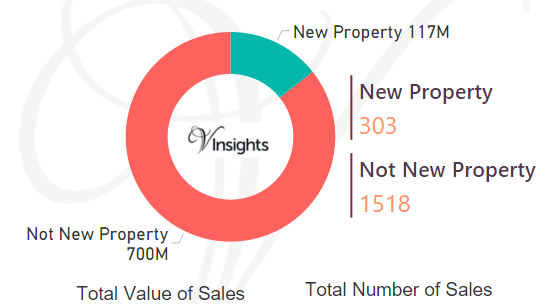
By Sales Value the split is as follows:
- New Property contributed £117 millions (14.36%)
- Not New Property contributed £700 millions (85.64%)
By Total Number the split is as follows:
- New properties sold were 303 (16.64%)
- Not new property sold were 1,518 (83.36%).
All Hampshire Posts
b0cf92ad-132b-415d-b997-1a3ba648fb9e|0|.0|27604f05-86ad-47ef-9e05-950bb762570c
Story Highlights
- Gosport had total property sales of £312 millions in 2016
- The total number of properties sold in 2016 was 1,528 properties
- The average sales price in Gosport was £204 K
- New Property sales were 2.32% by value, where as Not New 97.68%
- Stamp duty hike caused monthly spike in March
- Brexit coupled with Stamp Duty Hike have not had significant negative impact on Gosport Property Market in 2016, there was growth of 1.3% over 2015
Gosport is one of the districts of Hampshire
Total Sales By Property Type
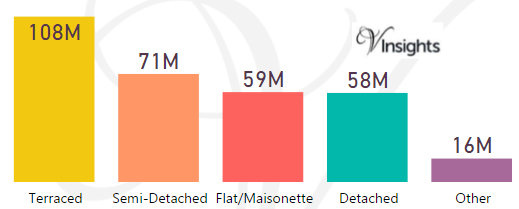
Gosport had total property sales of £312 millions, which was 3.44% of the total Hampshire property Market in 2016
The split across the different property types are:
- Terraced £108 millions (34.7%)
- Semi-Detached £71 millions (22.7%)
- Flat/Maisonette £59 millions (18.89%)
- Detached £58 millions (18.73%)
- Other £16 millions (4.99%)
Gosport Property Market at Postcode Level
| Postcode |
Coverage Area |
School |
Local Authority Area |
| PO12 |
Gosport,Alverstoke,Hardway |
Details |
Gosport |
| PO13 |
Gosport |
Details |
Gosport |
| PO13 |
Lee-on-the-Solent |
Details |
Gosport |
Month-wise Break-up of Total Sales
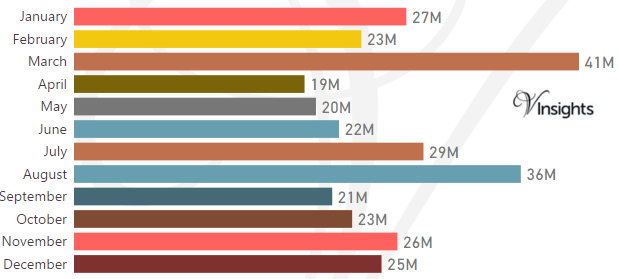
Some of the insights based on the £312 millions month-wise break-down :
Stamp Duty Hike Impact
- March had property sale spike of £41 millions compared to £23 millions in Feb
- The impetus for it was to avoid the extra 3% in Stamp Duty Tax applicable on buying an additional home, being applicable from April 1 2016
Brexit Impact
- Brexit took place on 23rd June 2016.
- Year on Year growth has been 1.3%
- So Brexit and Stamp Duty changes have not had negative impact on Gosport Property Market in 2016
Total No Of Properties Sold By Property Type
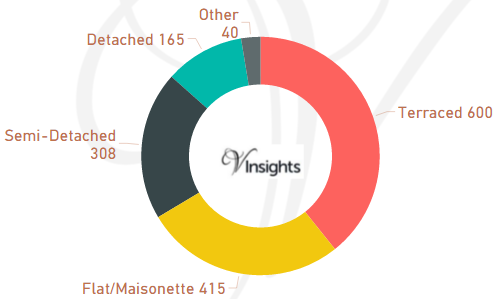
The total property sales of £312 millions, in 2016 was spread over 1,528 properties.
- Terraced 600 (39.27%)
- Flat/Maisonette 415 (27.16%)
- Semi-Detached 308 (20.16%)
- Detached 165 (10.8%)
- Others 40 (2.62%)
Average & Median Sales Price
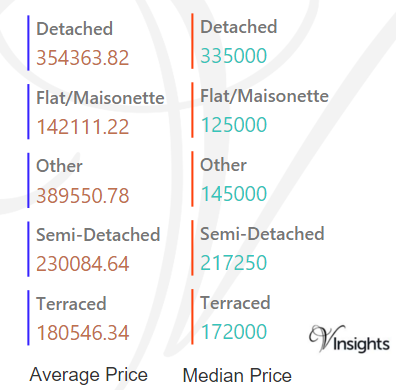
The average sales price in Gosport was £204 K and for the different property types it was:
- Detached £354 K
- Semi-Detached £230 K
- Terraced £181 K
- Flat/Maisonette £142 K
- Other £390 K
Similarly median sales price in Gosport was £178 K and for the different property types it was:
- Detached £335 K
- Semi-Detached £217 K
- Terraced £172 K
- Flat/Maisonette £125 K
- Other £145 K
New Vs Not New Property Statistics
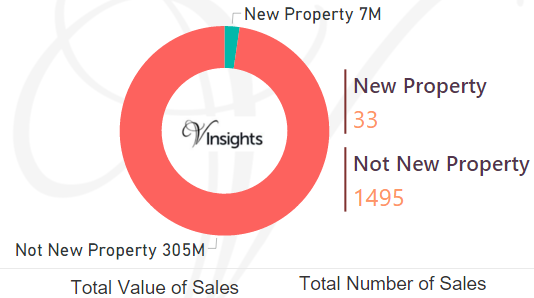
By Sales Values the split is as follows:
- New Property contributed £7 millions (2.32%)
- Not New Property contributed £305 millions (97.68%)
By Total Number the split is as follows:
- New properties sold were 33 (2.16%)
- Not new property sold were 1,495 (97.84%)
All Hampshire Posts
b8f3b5ab-b9a4-47ae-ae3a-cb2d72c0c0fb|0|.0|27604f05-86ad-47ef-9e05-950bb762570c

Story Highlights
- North East England had total property sales of £7 billions.
- The total number of properties sold in 2016 was 39,847
- The total sales at county level was maximum for Tyne And Wear at £2.94 Billions
- The average price in North East England was £168 K, while median price was £125 K
- The average sales price at county level was maximum for Darlington at £204 K
- The sales value contributed by New Property was 11.16%, for Not New 88.84%
- Stamp duty hike caused monthly spike in March
- Brexit coupled with Stamp Duty Hike has caused stagnation of North East England property market 2016 over 2015
North East England is one of the 9 principal areas of England. It consist of the counties Northumberland, Tyne and Wear, County Durham, Darlington, Hartlepool, Stockton-on-Tees, Redcar and Cleveland, Middlesbrough.
Total Sales By County
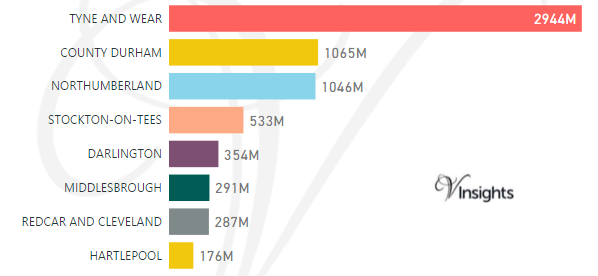
The total sales of £7 Billions in 2016 was split across its counties as above.
Year on Year Comparison : Compared to North East England Property Market 2015 in 2016
Total Value of Sales By Property Types
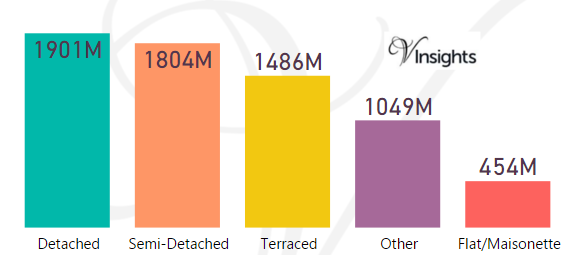
The split of £7 Billions across the different property types was:
- Detached at £1.9 billions (28.4%)
- Semi-Detached at £1.8 billions (26.95%)
- Terraced at £1.49 billions (22.19%)
- Other at £1.05 billions (15.67%)
- Flat/Maisonette at £454 millions (6.78%)
Year on Year Comparison : Compared to North East England Property Market 2015 in 2016
- Detached, Semi-Detached, Terraced had decline in total sales.
- Flat/Maisonette remained constant.
- Other has shown increase of 16.15%
Month-wise Break-up of Total Sales
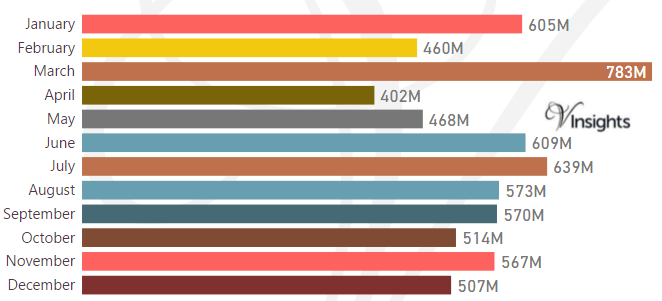
Stamp Duty Hike Impact
- March had property sale spike of £783 millions compared to £460 millions in Feb
- The impetus for it was to avoid the extra 3% in Stamp Duty Tax applicable on buying an additional home, being applicable from April 1 2016
Brexit Impact
- Brexit took place on 23rd June 2016.
- As can be observed from the month-wise break-up there does not seem to have been dip in property sales in the immediate aftermath of Brexit
- Year on Year there has been no growth in 2016 compared to 2015
- Brexit coupled with Stamp Duty seems to have stagnated the property market
Total Number of Sales By Property Types
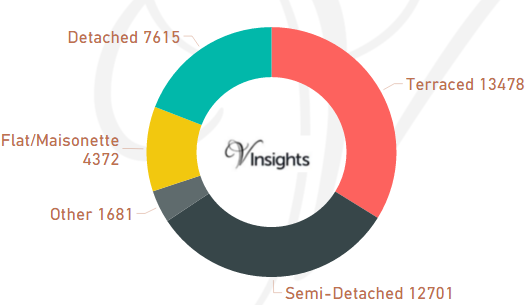
The total property sales of £7 Billions in 2016 was spread over 39,847 properties.
- Terraced properties at 13,478 (33.82%)
- Detached at 7,615 (19.11%)
- Semi-Detached at 12,701 (31.87%)
- Flat/Maisonette at 4,372 (10.97%)
- Others at 1,681 (4.22%)
Year on Year Comparison : Compared to North East England Property Market 2015 in 2016
- Except for property type Other all property types have shown decline in numbers
Average & Median Sales Price
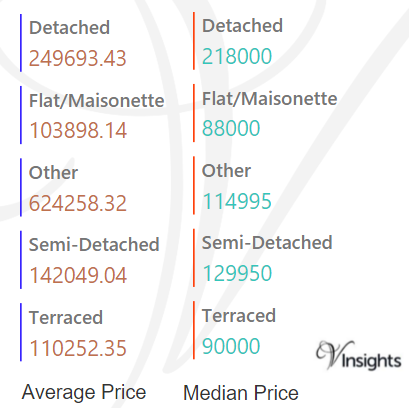
The average sales price in North East England was £168 K
For the different property types it was
- Detached at £250 K
- Semi-Detached at £142 K
- Terraced at £110 K
- Flat/Maisonette at £104 K
- Other at £624 K
Similarly median sales price in North East England was £125 K
For the different property types it was
- Detached at £218 K
- Semi-Detached at £130 K
- Terraced at £90 K
- Flat/Maisonette at £88 K
- Other at £115 k
Year on Year Comparison : Compared to North East England Property Market 2015 in 2016
- All property types have shown increase in average and median sales except property type Other
- Other has shown sharp decline in average and median sales
Average & Median Sales Price By County
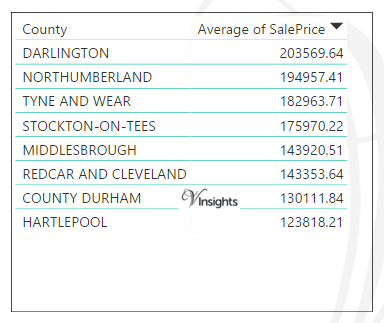
The average sales price in North East England in 2016 at county level is as above.
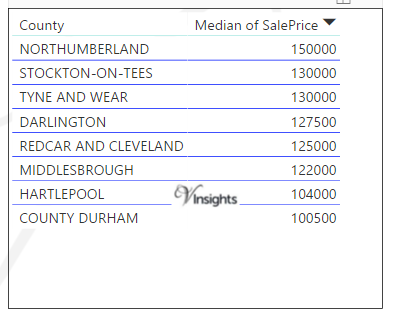
The median sales price in North East England in 2016 is as above.
Year on Year Comparison : Compared to North East England Property Market 2015 in 2016
New Vs Not New Property Statistics
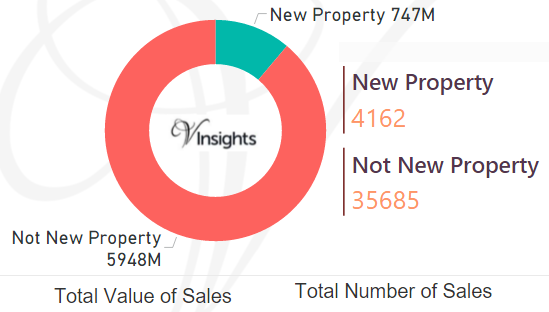
By Value of Sales
- The sales value contributed by New Property was £747 millions (11.16%)
- where as Not New Property contributed £5.95 billions (88.84%)
By Number of Sales
- New properties sold were 4,162(10.44%)
- where as not new property sold were 35,685 (89.56%).
Year on Year Comparison : Compared to North East England Property Market 2015 in 2016
- New property market share in property market has gone down in 2016 over 2015
All England Posts
53a15bab-a190-4ab2-9d51-edfb26ab3625|0|.0|27604f05-86ad-47ef-9e05-950bb762570c

Story Highlights
- Wales had total property sales of £8.67 Billions in 2016
- Total Sales By Principal Area was maximum in Cardiff at £1.5 Billions
- The total number of properties sold in 2016 was 47,959 properties
- The average sales price in Wales was £181 K, whereas median was £145 K
- The average sales price in Wales at Principal Area level was max for Monmouthshire £276 K
- New Property sales were 7.28% by value, whereas Not New Property contributed 92.72%
- Stamp duty hike caused monthly spike in March
- Brexit coupled with Stamp Duty Hike did not have negative impact on Wales property Market 2016.
Total Sales By County
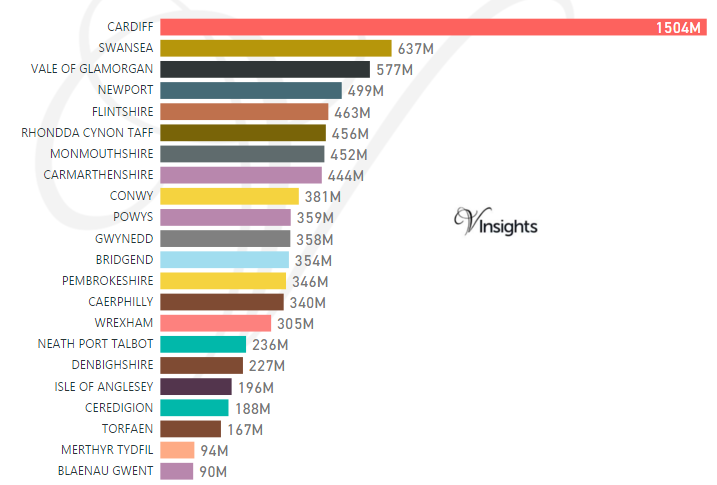
Wales had total property sales of £8.67 Billions. It contributed 2.92% of the England and Wales Property Market 2016.
The split of £8.67 Billions across its principal areas is as below :
- Cardiff £1.5 Billion (17.35%)
- Swansea £637 millions (7.34%)
- Vale Of Glamorgan £577 millions (6.65%)
- NewPort £499 millions (5.76%)
- Flintshire £463 millions (5.33%)
- Rhondda Cynon Taff £456 millions (5.25%)
- Monmouthshire £452 millions (5.21%)
- Carmarthenshire £444 millions (5.13%)
- Conwy £381 millions (4.4%)
- Powys £359 millions (4.14%)
- Gwynedd £358 millions (4.13%)
- Bridgend £354 millions (4.08%)
- Pembrokeshire £346 millions (3.99%)
- Caerphilly £340 millions (3.92%)
- Wrexham £305 millions (3.52%)
- Neath Port Talbot £236 millions (2.72%)
- Denbighshire £227 millions (2.62%)
- Isle Of Anglesey £196 millions (2.26%)
- Ceredigion £188 millions (2.16%)
- Torfaen £167 millions (1.92%)
- Merthyr Tydfil £94 millions (1.08%)
- Blaenau Gwent £90 millions (1.04%)
Year on Year Comparison : Compared to Wales Property Market All Principal Areas 2015 in 2016
Total Value of Sales By Property Types
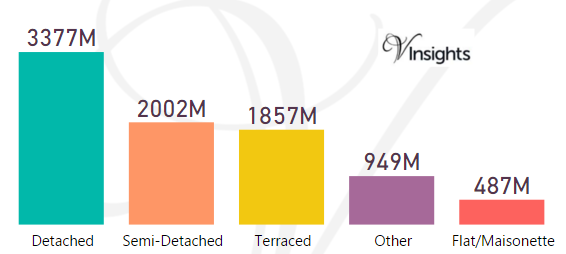
The total sales value of £8.67 billion split by property types in Wales 2016 was:
- Detached £3.38 billions (38.94%)
- Semi-Detached £2 billions (23.08%)
- Terraced £1.86 billions (21.42%)
- Other £949 millions (10.94%)
- Flat/Maisonette £487 millions (5.62%)
Year on Year Comparison : Compared to Wales Property Market 2015 in 2016
- All the property types sales have shown growth over 2015
Month-wise Break-up of Total Sales
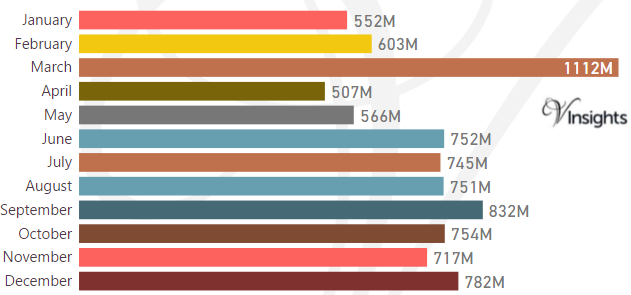
Some of the insights based on the £8.67 billion month-wise break-down :
Stamp Duty Hike Impact
- March had property sale spike of £1.11 billions compared to £603 millions in Feb
- The impetus for it was to avoid the extra 3% in Stamp Duty Tax applicable on buying an additional home, being applicable from April 1 2016
Brexit Impact
- Brexit took place on 23rd June 2016.
- As can be observed from the month-wise break-up there does not seem to have been dip in property sales in the immediate aftermath of Brexit
- Year on Year growth has been 3.58% so there was no negative Brexit Impact
Total Number of Sales By Property Types
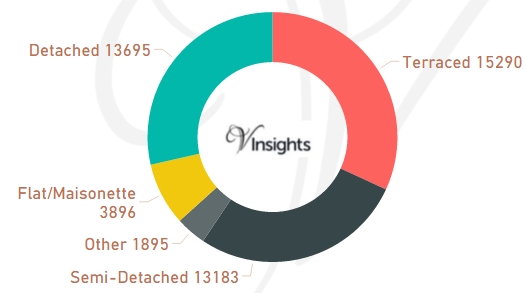
The total number of property transactions in Wales 2016 was 47,959
- Terraced 15,290 (31.88%)
- Detached 13,695 (28.56%)
- Semi-Detached 13,183 (27.49%)
- Flat/Maisonette 3,896 (8.12%)
- Other 1,895 (3.95%)
Year on Year Comparison : Compared to Wales Property Market 2015 in 2016
- All property types had growth in number of properties sold
- Other had significant growth of 139%
Average & Median Sales Price
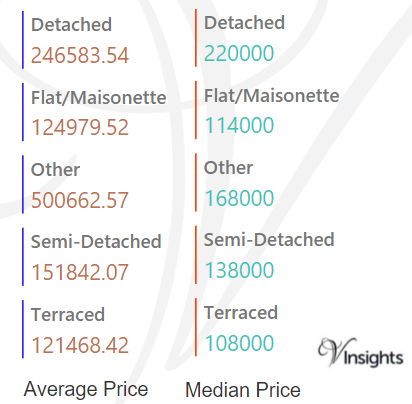
The average sales price in Wales was £181 K. For the different property types it was:
- Detached at £247 K
- Semi-Detached at £152 K
- Terraced at £122 K
- Flat/Maisonette at £125 K
- Other it is at £501 K
The median sales price in Wales was £145 K. For the different property types it was:
- Detached at £220 K
- Semi-Detached at £138 K
- Terraced at £108 K
- Flat/Maisonette at £114 K
- Other it is at £168 K
Year on Year Comparison : Compared to Wales Property Market 2015 in 2016
- All property type had increase in average and median sales price except Other
Average & Median Sales Price By County
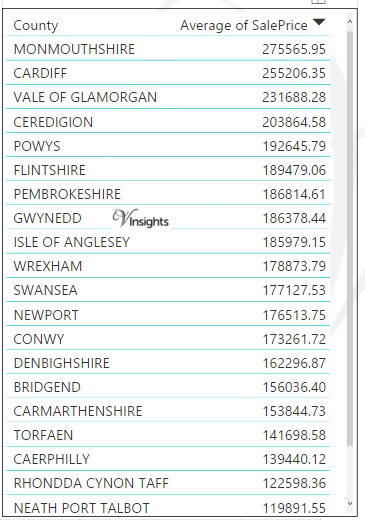
The average sales price by county in Wales by Principal Areas in 2016 was:
- Monmouthshire £276 K
- Cardiff £255 K
- Vale Of Glamorgan £232 K
- Ceredigion £204 K
- Powys £193 K
- Flintshire £190 K
- Pembrokeshire £187 K
- Gwynedd £186 K
- Isle Of Anglesey £186 K
- Wrexham £179 K
- Swansea £177 K
- NewPort £177 K
- Conwy £173 K
- Denbighshire £162 K
- Bridgend £156 K
- Carmarthenshire £154 K
- Torafen £142 K
- Caerphilly £139 K
- Rhondda Cynon Taff £123 K
- Neath Port Talbot £120 K
- Merthyr Tydfil £112 K
- Blaenau Gwent £105 K
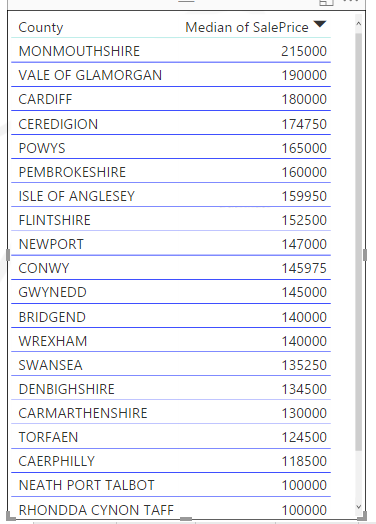
The median sales price by county in Wales by Principal Areas in 2016 was:
- Monmouthshire £215 K
- Vale Of Glamorgan £190 K
- Cardiff £180 K
- Ceredigion £175 K
- Powys £165 K
- Pembrokeshire £160 K
- Isle Of Anglesey £160 K
- Flintshire £153 K
- NewPort £147 K
- Conwy £146 K
- Gwynedd £145 K
- Bridgend £140 K
- Wrexham £140 K
- Swansea £135 K
- Denbighshire £135 K
- Carmarthenshire £130 K
- Torafen £125 K
- Caerphilly £119 K
- Neath Port Talbot £100 K
- Rhondda Cynon Taff £100 K
- Merthyr Tydfil £85 K
- Blaenau Gwent £79 K
Year on Year Comparison : Compared to Wales Property Market All Principal Areas 2015 in 2016
- Average Sales Price has gone up except for Vale Of Glamorgan, Pembrokeshire, Swansea,Neath Port Talbot,Merthyr Tydfil
- Median Sales price has gone up except for Pembrokeshire, Neath Port Talbot, Rhondda Cynon Taff, Merthyr Tydfil
New Vs Not New Property Statistics
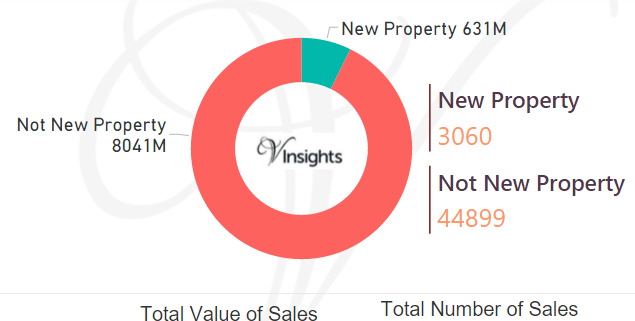
By Sales Value
- Sales value contributed by New Property was £631 millions (7.28%)
- Not New Property contributed £8.04 billions (92.72%).
By Number Of Sales
- New Properties sold were 3,060 (6.38%)
- Not New Properties sold were 44,899 (93.62%)
Year on Year Comparison : Compared to Wales Property Market 2015
- New property market share in property market has gone down in 2016 over 2015
All Wales Post
9957a7f9-04c6-433a-9e8b-44ef8342f308|0|.0|27604f05-86ad-47ef-9e05-950bb762570c