Story Highlights
- East of Sussex had total property sales of £3.47 billions in 2016
- Total Sales at district level was maximum for Wealden at £1.11 billions
- The total number of properties sold in 2016 was 11,498 properties
- The average sales price in East of Sussex was £302 K
- The average sales price at District level was maximum for Wealden £370 K
- New Property sales were 3.61% by value, where as Not New 96.39%
- Stamp duty hike caused monthly spike in March
- Brexit coupled and Stamp Duty Hike did not have negative impact , there was growth of 6.8% in 2016 over 2015
East of Sussex is one of the counties of South East England. The districts of East of Sussex are Wealden, Rother, Lewes, Eastbourne, Hastings
Total Sales By Districts
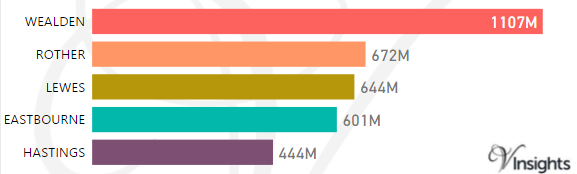
East of Sussex had total property sales of £3.47 Billions which was 5.6% of the total South East England property Market in 2016
The split of the sales across the different districts was:
Year on Year Comparison : Compared to East of Sussex Property Market 2015 in 2016
Total Sales By Property Type
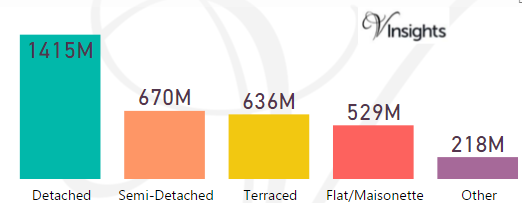
The split of £3.47 Billions across the different property types are:
- Detached £1.42 billions (40.8%)
- Semi-Detached £670 millions (19.32%)
- Terraced £636 millions (18.33%)
- Flat/Maisonette £529 millions (15.25%)
- Other £218 millions (6.29%)
Year on Year Comparison : Compared to East of Sussex Property Market 2015 in 2016
- Total Sales has increased for all property types except for nominal decrease for Detached
Month-wise Break-up of Total Sales
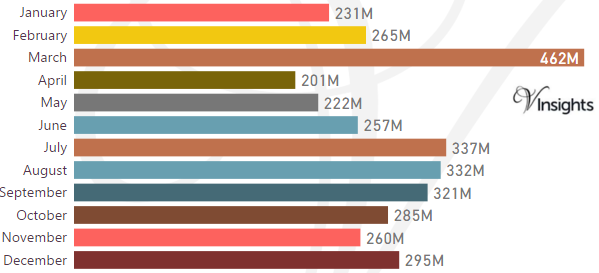
Some of the insights based on the £3.47 Billions month-wise break-down :
Stamp Duty Hike Impact
- March had property sale spike of £462 millions compared to £265 millions in Feb
- The impetus for it was to avoid the extra 3% in Stamp Duty Tax applicable on buying an additional home, being applicable from April 1 2016
Brexit Impact
- Brexit took place on 23rd June 2016.
- As can be observed from the month-wise break-up there does not seem to have been dip in property sales in the immediate aftermath of Brexit
- Year on Year growth has been 6.8%in 2016 over 2015
- So Brexit and Stamp Duty changes did not have impact on the East of Sussex Property Market in 2016
Total No Of Properties Sold By Property Type
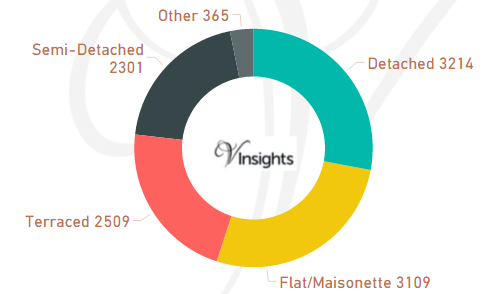
The total property sales of £3.47 Billions in 2016 was spread over 11,498 properties.
- Detached 3214 (27.95%)
- Flat/Maisonette 3109 (27.04%)
- Terraced 2509 (21.82%)
- Semi-Detached 2301 (%)
- Other 365 (3.17%)
Year on Year Comparison : Compared to East of Sussex Property Market 2015 in 2016
- Total Number of properties sold has decreased by 3.5 %
- All the property type have witnessed decrease in property sales except Other
Average & Median Sales Price
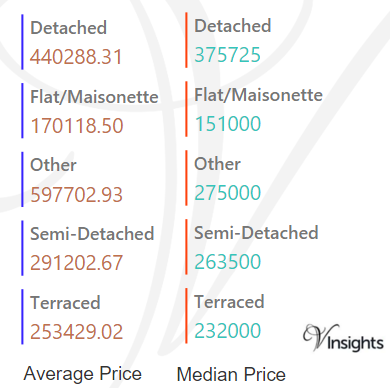
The average sales price in East of Sussex was £302 K and for the different property types it was:
- Detached £440 K
- Semi-Detached £291 K
- Terraced £253 K
- Flat/Maisonette £170 K
- Other it was £598 K
Similarly median sales price in East of Sussex was £253 K and for the different property types was:
- Detached £376 K
- Semi-Detached £264 K
- Terraced £232 K
- Flat/Maisonette £151 K
- Other it is £275 k
Year on Year Comparison : Compared to East of Sussex Property Market 2015 in 2016
- All property types have witnessed increase average and median sales price
Average & Median Sales Price By Districts
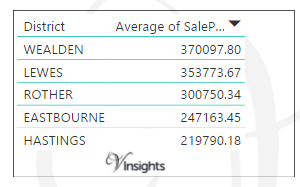
The average sales price at district level in East of Sussex in 2016 is as above.
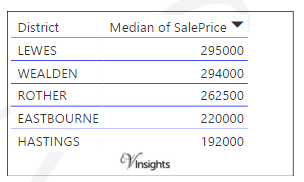
The median sales price at district level in East of Sussex in 2016 is as above.
Year on Year Comparison : Compared to East of Sussex Property Market 2015 in 20
- Average and median sales price across all districts have gone up
New Vs Not New Property Statistics
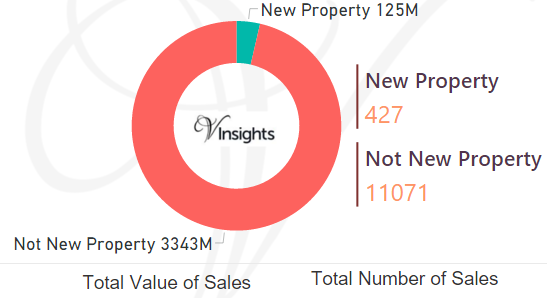
By Sales Values the split is as follows:
- New Property contributed £125 millions (3.61%)
- Not New Property contributed £3.34 billions (96.39%)
By Total Number the split is as follows:
- New properties sold were 427 (3.71%)
- Not new property sold were 11,071 (96.29%)
Year on Year Comparison : Compared to East of Sussex Property Market 2015 in 2016
- New property market share in property market has gone down in 2016 over 2015
All East of Sussex Posts

ac186da0-51f9-482e-993c-104bfe094430|0|.0|27604f05-86ad-47ef-9e05-950bb762570c