Story Highlights
- Lewes had total property sales of £644 millions in 2016
- The total number of properties sold in 2016 was 1,821 properties
- The average sales price in Lewes was £354 K
- New Property sales were 5.36% by value, where as Not New 94.64%
- Stamp duty hike caused monthly spike in March
- Brexit coupled and Stamp Duty Hike did not have negative impact , there was growth of 5.4%in 2016 over 2015
Lewes is one of the districts of East of Sussex
Total Sales By Property Type
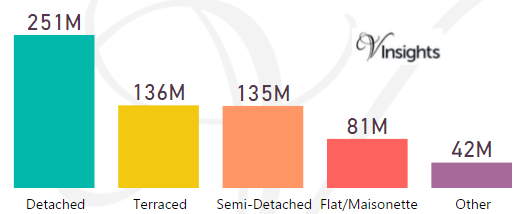
Wealden had total property sales of £644 millions which was 18.58% of the East of Sussex Property Market 2016
The split across the different property types are:
- Detached £251 millions (38.91%)
- Terraced £136 millions (21.06%)
- Semi-Detached £135 millions (20.92%)
- Flat/Maisonette £81 millions (12.55%)
- Other £42 millions (6.55%)
Lewes Property Market at Postcode level
| Postcode |
Coverage Area |
School |
Local Authority Area |
| BN1 |
Brighton,Coldean,Falmer,Hollingbury,Patcham,Presto n,Stanmer,Withdean |
Details |
Brighton and Hove, Lewes |
| BN2 |
Brighton,Bevendean,Brighton Marina,Kemptown,Moulse coomb,Ovingdean,Rottingdean,Saltdean,Woodingdean |
Details |
Brighton and Hove, Lewes |
| BN6 |
Hassocks,Albourne,Clayton,Ditchling,Goddards Green ,Hurstpierpoint,Keymer,Newtimber,Sayers Common,Str eat,Westmeston |
Details |
Lewes, Mid Sussex |
| BN7 |
Lewes,Cooksbridge,East Chiltington,Iford,Kingston, Offham,Plumpton,Plumpton Green,Rodmell,Southease, Swanborough,Telscombe |
Details |
Lewes |
| BN8 |
Barcombe,Barcombe Cross,Beddingham, Chailey Green, Chiddingly,East Hoathly,Firle,Glynde,Halland,Hamse y, Holmes Hill,Laughton,Newick,North Chailey,Ringm er,Ripe,Shortgate,South Chailey, Southerham, Stone ham, Whitesmith |
Details |
Lewes,Wealden |
| BN9 |
Newhaven,Piddinghoe,South Heighton,Tarring Neville |
Details |
Lewes |
| BN10 |
Peacehaven,Telscombe Cliffs |
Details |
Lewes |
| BN25 |
Seaford,Bishopstone,Cuckmere Haven,Exceat, Norton, Rookery Hill,Westdean |
Details |
Lewes, Wealden |
| RH15 |
Burgess Hill, Ditchling Common |
Details |
Mid Sussex, Lewes |
| RH17 |
Ansty,Ardingly,Balcombe,Bolney, Chelwood Gate,Cuck field,Danehill,Handcross,Hickstead,Horsted Keynes, Wivelsfield,Wivelsfield Green |
Details |
Mid Sussex, Lewes,Wealden |
Month-wise Break-up of Total Sales
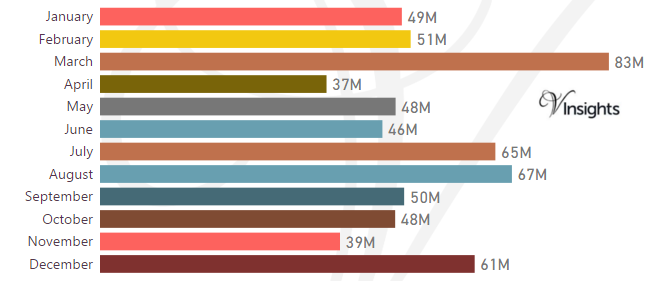 Some of the insights based on the £644 millions month-wise break-down :
Stamp Duty Hike Impact
- March had property sale spike of £83 millions compared to £51 millions in Feb
- The impetus for it was to avoid the extra 3% in Stamp Duty Tax applicable on buying an additional home, being applicable from April 1 2016
Brexit Impact
- Brexit took place on 23rd June 2016.
- As can be observed from the month-wise break-up there does not seem to have been dip in property sales in the immediate aftermath of Brexit
- Year on Year growth has been 5.4%in 2016 over 2015
- So Brexit and Stamp Duty changes did not have negative impact on the Lewes Property Market in 2016
Total No Of Properties Sold By Property Type
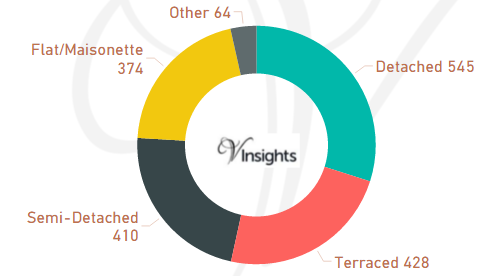
The total property sales of £644 millions in 2016 was spread over 1,821 properties.
- Detached 545 (29.93%)
- Terraced 428 (23.5%)
- Semi-Detached 410 (22.52%)
- Flat/Maisonette 374 (20.54%)
- Others 64 (3.51%)
Average & Median Sales Price
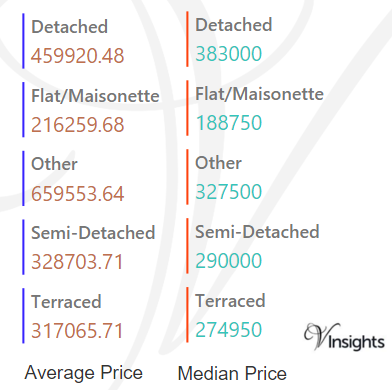
The average sales price in Lewes was £354 K and for the different property types it was:
- Detached £460 K
- Semi-Detached £329 K
- Terraced £317 K
- Flat/Maisonette £216 K
- Other it was £660 K
Similarly median sales price in Lewes was £295 K and for the different property types was:
- Detached £383 K
- Semi-Detached £290 K
- Terraced £275 K
- Flat/Maisonette £189 K
- Other it is £328 K
New Vs Not New Property Statistics
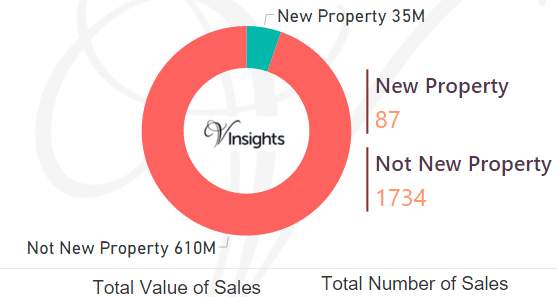
By Sales Values the split is as follows:
- New Property contributed £35 millions (5.36%)
- Not New Property contributed £610 millions (94.64%)
By Total Number the split is as follows:
- New properties sold were 87 (4.78%)
- Not new property sold were 1,734 (95.22%)
All East of Sussex Posts

257e6487-fe68-414a-8844-f692be2cffd0|0|.0|27604f05-86ad-47ef-9e05-950bb762570c