Story Highlights
- East Hampshire had total property sales of £868 millions in 2016
- The total number of properties sold in 2016 was 2,155 properties
- The average sales price in East Hampshire was £403 K
- New Property sales were 8.52% by value, where as Not New 91.48%
- Stamp duty hike caused monthly spike in March
- Brexit coupled with Stamp Duty changes have had negative impact on East Hampshire Property Market in 2016, there was decline of 7.4% compared to 2015
East Hampshire is one of the districts in Hampshire
Total Sales By Property Type
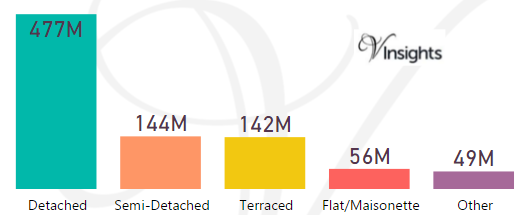
East Hampshire had total property sales of £868 millions, which was 9.58% of the total Hampshire property Market in 2016
The split across the different property types are:
- Detached £477 millions (54.92%)
- Semi-Detached £144 millions (16.63%)
- Terraced £142 millions (16.38%)
- Flat/Maisonette £56 millions (6.44%)
- Other £49 millions (5.63%)
East Hampshire Property Market at Postcode Level
| Postcode |
Coverage Area |
School |
Local Authority Area |
| GU10 |
Bentley,Frensham,Churt,Crondall,Tongham,Ewshot,Sea le,Tilford,Wrecclesham |
Details |
Waverley, East Hampshire, Guildford,Hart |
| GU30 |
Liphook,Bramshott,Conford,Linch,Milland,Passfield |
Details |
East Hampshire, Chichester |
| GU31 |
Petersfield,Buriton,East Harting,South Harting,Els ted,Rogate |
Details |
East Hampshire, Chichester |
| GU32 |
East Meon,West Meon,Sheet,Steep |
Details |
East Hampshire |
| GU33 |
Liss,Greatham,Selborne,Rake |
Details |
East Hampshire, Chichester |
| GU34 |
Alton,Beech,Bentworth,Medstead,Four Marks,Golden P ot,Lasham |
Details |
East Hampshire |
| GU35 |
Bordon,Headley,Headley Down,Lindford,Oakhanger,Kin gsley,Arford,Whitehill |
Details |
East Hampshire |
| PO8 |
Clanfield,Cowplain,Horndean |
Details |
Havant, East Hampshire |
| PO9 |
Rowlands Castle |
Details |
East Hampshire, Havant |
Month-wise Break-up of Total Sales
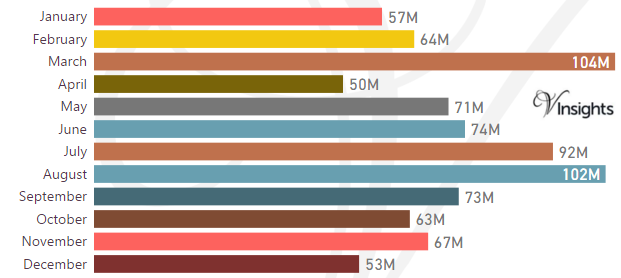
Some of the insights based on the £868 millions month-wise break-down :
Stamp Duty Hike Impact
- March had property sale spike of £104 millions compared to £64 millions in Feb
- The impetus for it was to avoid the extra 3% in Stamp Duty Tax applicable on buying an additional home, being applicable from April 1 2016
Brexit Impact
- Brexit took place on 23rd June 2016.
- Year on Year decline has been 7.4% compared to 2015
- So Brexit and Stamp Duty changes have had negative impact on East Hampshire Property Market in 2016
Total No Of Properties Sold By Property Type
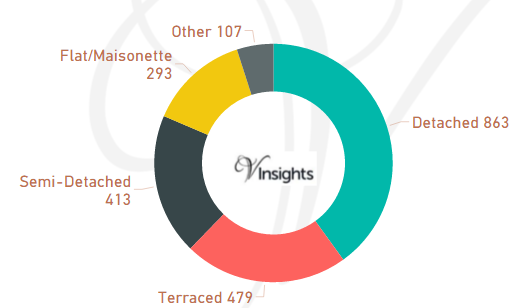
The total property sales of £868 millions in 2016 was spread over 2,155 properties.
- Detached 863 (40.05%)
- Terraced 479 (22.23%)
- Semi-Detached 413 (19.16%)
- Flat/Maisonette 293 (13.6%)
- Others 107 (4.97%)
Average & Median Sales Price
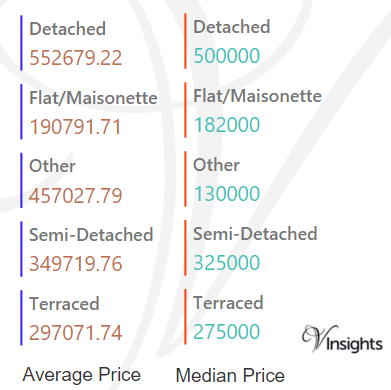
The average sales price in East Hampshire was £403 K and for the different property types it was:
- Detached £553 K
- Semi-Detached £350 K
- Terraced £297 K
- Flat/Maisonette £191 K
- Other £457 K
Similarly median sales price in East Hampshire was £335 K and for the different property types it was:
- Detached £500 K
- Semi-Detached £325 K
- Terraced £275 K
- Flat/Maisonette £182 K
- Other £130 K
New Vs Not New Property Statistics
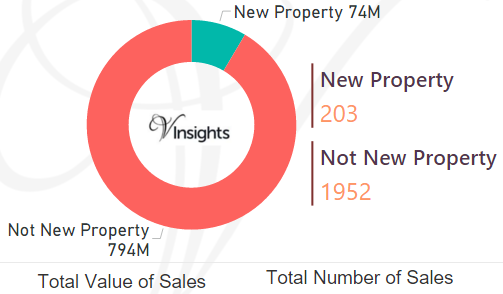
By Sales Values the split is as follows:
- New Property contributed £74 millions (8.52%)
- Not New Property contributed £794 millions (91.48%)
By Total Number the split is as follows:
- New properties sold were 203 (9.42%)
- Not new property sold were 1,952 (90.58%)
All Hampshire Posts

7dc8bb6e-0c23-4647-af6f-9c9f374681ce|0|.0|27604f05-86ad-47ef-9e05-950bb762570c