Story Highlights
- South Bucks had total property sales of £833 millions in 2016
- The total number of properties sold in 2016 was 1,096 properties
- The average sales price in South Bucks was £760 K, whereas median was £540 K
- New Property sales were 3.98% by value, where as Not New 96.02%
- Stamp duty hike caused monthly spike in March
- Brexit coupled with Stamp Duty Hike did not have negative impact on South Bucks Property Market in 2016, there was growth of 7.48% over 2015
South Bucks is one of the districts of Buckinghamshire
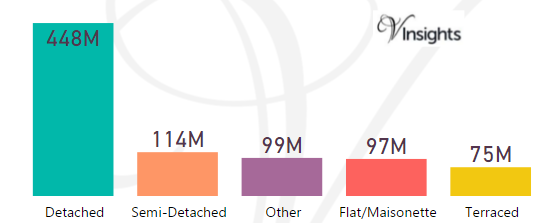
Total Sales By Property Type
South Bucks had total property sales of £833 millions which was 18.92% of the total Buckinghamshire Property Market 2016
The split £833 millions across the different property types are:
- Detached £448 millions (53.71%)
- Semi-Detached £114 millions (13.7%)
- Other £99 millions (11.93%)
- Flat/Maisonette £97 millions (11.61%)
- Terraced £75 millions (9.04%)
South Bucks Property Market at Postcode level
| Postcode |
Coverage Area |
School |
Local Authority Area |
| HP9 |
Beaconsfield,Forty Green,Holtspur,Jordans,Knotty G reen,Seer Green |
Details |
South Bucks, Chiltern |
| SL0 |
Iver,Iver Heath,Richings Park,Thorney |
Details |
South Bucks |
| SL1 |
Slough,Burnham,Cippenham,Chalvey,Upton,Littleworth ,Salt Hill |
Details |
Slough, South Bucks |
| SL2 |
Britwell,Farnham Common,Farnham Royal,Stoke Poges, Egypt,Hedgerley |
Details |
South Bucks, Slough |
| SL3 |
Langley,Datchet,Colnbrook,Poyle,Horton,Fulmer,Geor ge Green,Wexham, part ofRichings Park |
Details |
Slough, South Bucks,Windsor and Maidenhead |
| SL4 |
Windsor,Old Windsor,Eton,Eton Wick,Clewer,Dedworth ,Cranbourne,Winkfield,Dorney, Spital,Oakley Green, Woodside,Boveney, part ofFifield |
Details |
Windsor and Maidenhead,Bracknell Forest, South Bucks, Slough |
| SL6 |
Maidenhead,Burnham,Taplow,Bray,Bray Wick,Cookham,C ookham Dean, Cookham Rise,White Waltham,Hurley, Hu rley Bottom,Holyport,Pinkneys Green, Woodlands Par k, Furze Platt,Hitcham,Littlewick Green,Burchetts Green,Paley Street, Stud Green,Touchen End, part o fFifield, parts of Cippenham,Slough |
Details |
Windsor and Maidenhead, South Bucks |
| SL9 |
Gerrards Cross,Chalfont St Peter,Chalfont Common, Horn Hill |
Details |
South Bucks,Chiltern |
| UB9 |
Denham,Harefield |
Details |
South Bucks, Hillingdon |
Month-wise Break-up of Total Sales
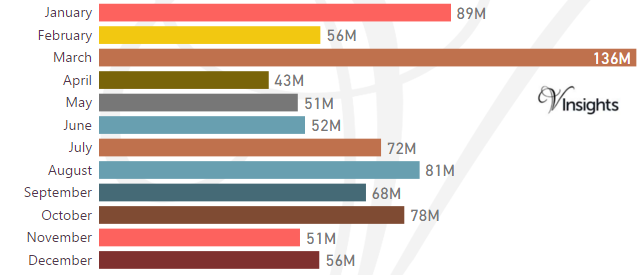
Some of the insights based on the £833 millions month-wise break-down :
Stamp Duty Hike Impact
- March had property sale spike of £136 millions compared to £56 millions in Feb
- The impetus for it was to avoid the extra 3% in Stamp Duty Tax applicable on buying an additional home, being applicable from April 1 2016
Brexit Impact
- Brexit took place on 23rd June 2016.
- Year on Year growth (compared to 2015) has been 7.48% in 2016
- Brexit coupled with Stamp Duty Hike did not have negative impact on South Bucks Property Market in 2016
Total No Of Properties Sold By Property Type
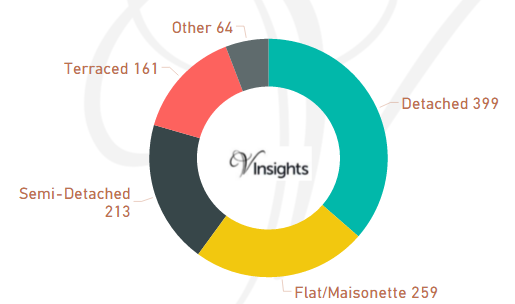
South Bucks had total property sales of 1096. The split across different property types are:
- Detached 399 (36.41%)
- Flat/Maisonette 259 (23.63%)
- Semi-Detached 213 (19.43%)
- Terraced 161 (14.69%)
- Other 64 (5.84%)
Average & Median Sales Price
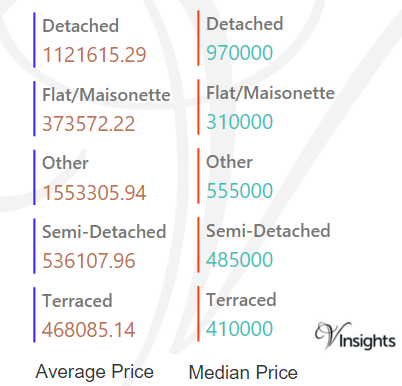
The average sales price in South Bucks was £760 K and for different property types it was:
- Detached £1.12 millions
- Semi-Detached £536 K
- Terraced £468 K
- Flat/Maisonette £374 K
- Other it is £1.55 millions
Similarly median sales price in South Bucks was £540 K and for different property types are:
- Detached £970 K
- Semi-Detached £485 K
- Terraced £410 K
- Flat/Maisonette £310 K
- Other it is £555 K
New Vs Not New Property Statistics
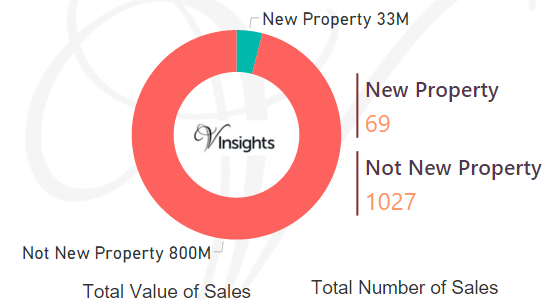
By Sales Values the split is as follows:
- New Property contributed £33 millions (3.98%)
- Not New Property contributed £800 millions (96.02%)
By Total Number the split is as follows:
- New properties sold were 69 6.3%)
- Not new property sold were 1027 (93.7%)
All Buckinghamshire Posts

7408be67-17de-40af-a03d-4e95c8f6ccc3|0|.0|27604f05-86ad-47ef-9e05-950bb762570c