Story Highlights
- Waverley had total property sales of £1.1 billions in 2016
- The total number of properties sold in 2016 was 2082
- The average sales price was £533 K, whereas the median was £425 K
- New Property sales were 5.3% by value, whereas Not New Property contributed 94.7%
- Stamp duty changes caused monthly spike in March
- Brexit coupled with Stamp Duty changes had negative impact and it declined by 8.2%
Waverley is one of the districts of Surrey.
Total Sales By Property Type
Waverley had total property sales of £1.1 billions which was 10.34% of the total Surrey Property Market 2016
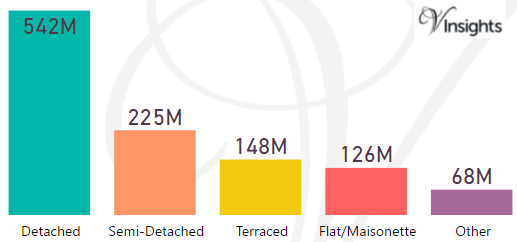
The split of £1.1 billions across the different property types are:
- Detached £542 millions (48.86%)
- Semi-Detached £225 millions (20.31%)
- Terraced £148 millions (13.34%)
- Flat/Maisonette £126 millions (11.34%)
- Other £68 millions (6.15%)
Waverley Property Market at Postcode Level
| Postcode |
Coverage Area |
School |
Local Authority Area |
| GU5 |
Albury, Bramley, Shere |
Details |
Guildford, Waverley |
| GU6 |
Cranleigh, Ewhurst, Alfold |
Details |
Waverley |
| GU7 |
Farncombe, Godalming |
Details |
Waverley |
| GU8 |
Chiddingfold, Dunsfold, Elstead, Hascombe, Milford, Thursley, Witley |
Details |
Waverley |
| GU9 |
Farnham, Badshot Lea, Hale, Heath End |
Details |
Waverley |
| GU10 |
Bentley, Frensham, Churt, Crondall, Tongham, Ewshot, Seale, Tilford, Wrecclesham |
Details |
Waverley, East Hampshire, Guildford, Hart |
| GU26 |
Hindhead, Bramshott Chase, Grayshott |
Details |
Waverley |
| GU27 |
Haslemere, Fernhurst, Shottermill, Grayswood |
Details |
Waverley, Chichester |
Month-wise Break-up of Total Sales
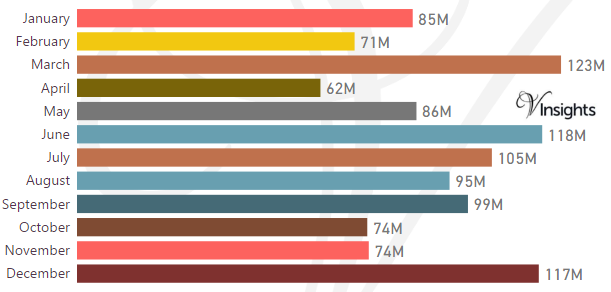
Some of the insights based on the £1.1 billions month-wise break-down :
Stamp Duty Hike Impact
- March had property sale spike of £123 millions compared to £71 millions in Feb and then sales sharply drop
- The impetus for it was to avoid the extra 3% in Stamp Duty Tax applicable on buying an additional home, being applicable from April 1 2016
Brexit Impact
- Brexit took place on 23rd June 2016.
- Year on Year decline has been 8.2% in 2016 over 2015
- Brexit coupled with Stamp Duty Hike had negative impact on Waverley Property Market in 2016
Total No Of Properties Sold By Property Type
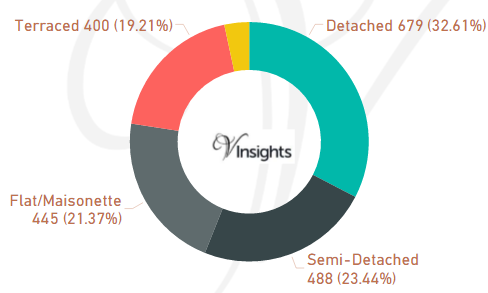
Waverley had total property sales of 2082. The split across the different property types are:
- Detached 679 (32.61%)
- Semi-Detached 488 (23.44%)
- Flat/Maisonette 445 (21.37%)
- Terraced 400 (19.21%)
- Other 70 (3.36%)
Average & Median Sales Price
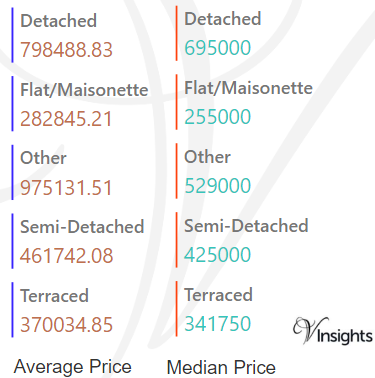
The average sales price in Waverley was £533 K and for different property types it was:
- Detached £798 K
- Semi-Detached £462 K
- Terraced £370 K
- Flat/Maisonette £283 K
- Other it is £ 975 K
Similarly median sales price in Waverley was £425 K and for different property types are:
- Detached £695 K
- Semi-Detached £425 K
- Terraced £342 K
- Flat/Maisonette £255 K
- Other it is £529 K
New Vs Not New Property Statistics
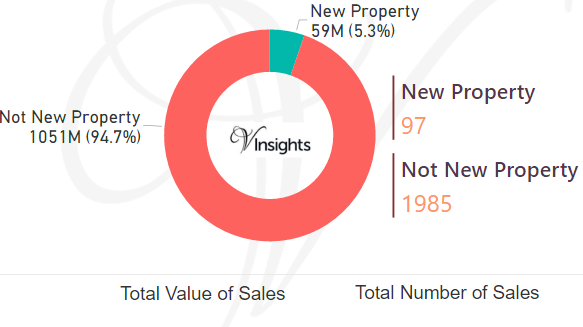
By Sales Value the split is as follows:
- New Property contributed £59 millions (5.3%)
- Not New Property contributed £1.1 billions (94.7%)
By Total Number the split is as follows:
- New properties sold were 97 (4.66%)
- Not new property sold were 1,985 (95.34%)
All Surrey Posts

65e97fb4-3f6c-40b5-bb54-12e88e1c41da|0|.0|27604f05-86ad-47ef-9e05-950bb762570c