Story Highlights
- Surrey had total property sales of £11.16 Billions in 2015
- The total number of properties sold in 2015 was 22,170.
- The average sales price in Surrey was £503.67 K, whereas median was £375 K
- Across its districts average sales price in Surrey was maximum for Elmbridge at £748 K and was minimum for Spelthrone £385 K
- Similarly the median sales price in Surrey was maximum for Elmbridge £501 K and was minimum for Woking £340 K
- New Property sales were 6.69% by value, where as Not New Property contributed 93.31%
Surrey is one of the counties of South East England. The districts of Surrey are Elmbridge, Reigate and Banstead, Guildford, Waverley, Working, Mole Valley, Tandridge, Runnymede, Surrey Heath, Spelthorne, Epsom and Ewell. Let us look at the Surrey Property Market in 2015 in detail.
Total Sales By Districts
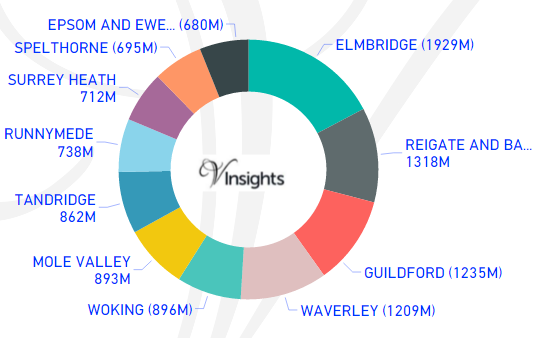
Surrey had total property sales of £11.16 Billions which was 18.23% of the total South East property Market in 2015.
The split of the sales across the different districts was:
- Elmbridge £1.93 billions (17.28%)
- Reigate and Banstead £1.32 billions (11.8%)
- Guildford £1.24 billions (11.06%)
- Waverley £1.21 billions (10.83%)
- Woking £896 millions (8.03%)
- Mole Valley £893 millions (7.99%)
- Tandridge £862 millions (7.72%)
- Runnymede £738 millions (6.61%)
- Surrey Heath £712 millions (6.37%)
- Spelthorne £695 millions (6.22%)
- Epsom and Ewell £680 millions (6.09%)
Total Sales By Property Type
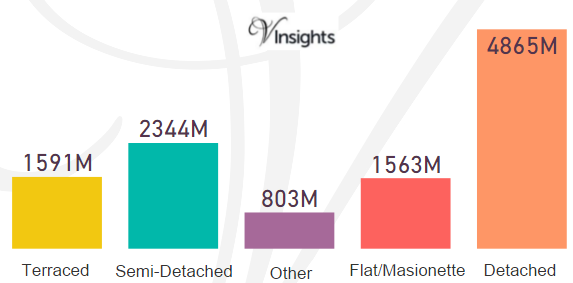
The split across the different property types in Surrey are:
- Terraced £1.59 billions (14.25%)
- Semi-Detached £2.34 billions (20.99%)
- Other £803 millions (7.19%)
- Flat/Maisonette £1.56 billions (14%)
- Detached £4.87 billions (43.57%)
Total No Of Properties Sold By Property Type
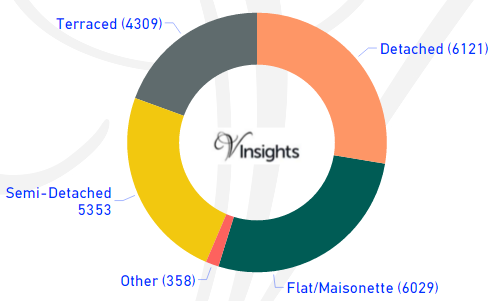
Surrey had total property sales of 22,170. The split across the different property types are:
- Detached 6121 (27.61%)
- Flat/Maisonette 6029 (27.19%)
- Other 358 (1.61%)
- Semi-Detached 5353 (24.15%)
- Terraced 4309 (19.44%)
Average & Median Sales Price
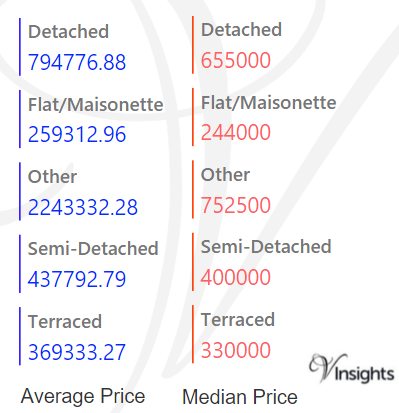
The average sales price in Surrey was £503.67 K and for the different property types it was:
- Detached £795 K
- Semi-Detached £438 K
- Terraced £369 K
- Flat/Maisonette £259 K
- Other it is £2.24 million
Similarly median sales price in Surrey was £375 K and for different property types are:
- Detached £655 K
- Semi-Detached £400 K
- Terraced £330 K
- Flat/Maisonette £244 K
- Other it is £753 k
Average & Median Sales Price By Districts
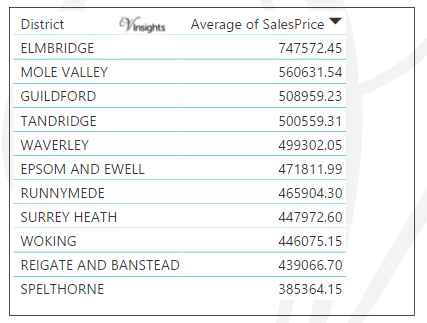
Across districts the average price is as above.
- Elmbridge £748 K
- Mole Valley £561 K
- Guildford £509 K
- Tandridge 501 K
- Waverley £499 K
- Epsom and Ewell £472 K
- Runnymede £466 K
- Surrey Heath £448 K
- Woking £446 K
- Reigate And Banstead £439 K
- Spelthorne £385 K
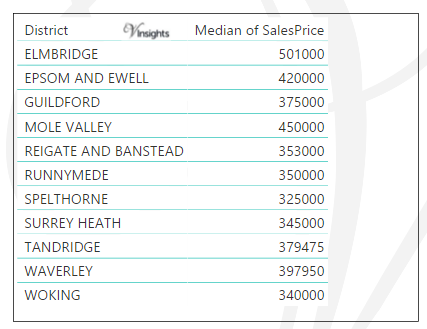
Across districts the median price is as above.
- Elmbridge £501 K
- Mole Valley £450 K
- Epsom and Ewell £420 K
- Guildford £375 K
- Reigate And Banstead £353 K
- Runnymede £350 K
- Spelthorne £325 K
- Surrey Heath £345 K
- Tandridge £380 K
- Waverley £398 K
- Woking £340 K
New Vs Not New Property Statistics
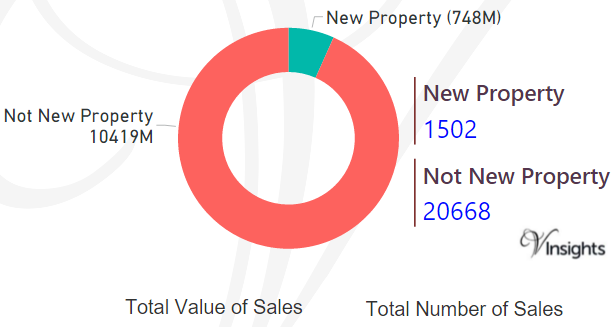
By Sales Values the split is as follows:
- New Property contributed £748 millions (6.69%)
- Not New Property contributed £10.42 billions (93.31 %)
By Total Number the split is as follows:
- New properties sold were 1,502 (6.77%)
- Not new property sold were 20,668 (93.23%)
All Surrey Posts

83057dc6-7f3b-42e9-8d48-6cda691ded8c|0|.0|27604f05-86ad-47ef-9e05-950bb762570c