Story Highlights
- Warwickshire had total property sales of £2.86 billions in 2015.
- The total number of properties sold in 2015 in Warwickshire was 10,903
- The total volume of sales at district level was maximum for Stratford-On-Avon at £882 millions
- The average sales price in Warwickshire was £262 K, whereas median was £210 K
- The average sales price at district level was maximum for Stratford-On-Avon at £343 K
- The median sales price at district level was also maximum for Stratford-On-Avon at £273 K
- New Property sales in Warwickshire contributed 14.49% and Not New Property contributed 85.51%
Warwickshire is one of the counties of West Midland. The districts of Warwickshire are Stratford-on-Avon, Warwick, Rugby, Nuneaton and Bedworth , North Warwickshire.
Total Sales By Districts
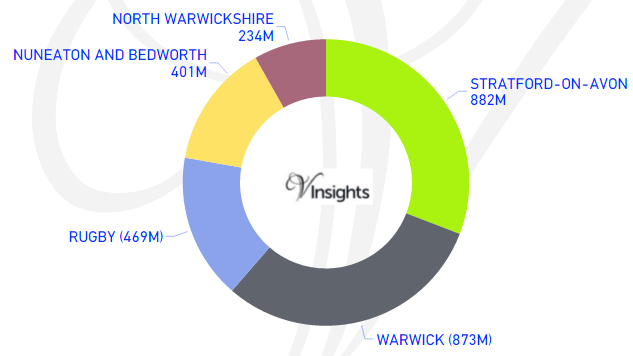
Warwickshire had total property sales of £2.86 billions, which was 15.38% of the West Midlands Property Market 2015.
The split across its districts is as follow:
- Stratford-on-Avon at £882 millions (30.84%)
- Warwick at £873 millions (30.55%)
- Rugby at £469 millions (16.39%)
- Nuneaton and Bedworth at £401 millions (14.03%)
- North Warwickshire at £234 millions (8.19%)
Total Sales By Property Type
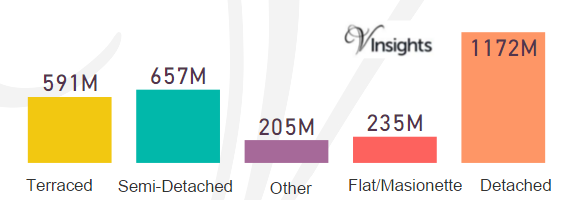
The split of £2.86 billions across the different property types in Warwickshire are :
- Detached at £1.17 billions (40.99%)
- Terraced at £591 millions (20.67%)
- Semi-Detached at £657 millions (22.97%)
- Flat/Maisonette at £235 millions (8.22%)
- Other at £205 millions (7.16%)
Total No Of Properties Sold By Property Type
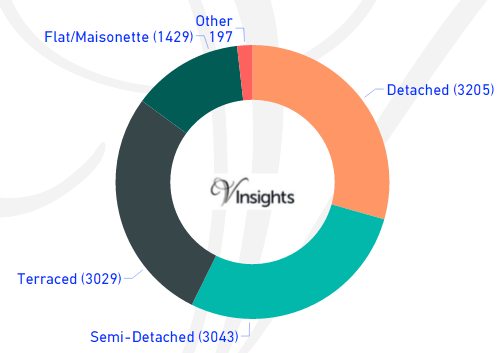
The total property sales of £2.86 billions in 2015 was spread over 10,903 properties.
- Terraced properties at 3029 (27.78%)
- Detached at 3205 (29.4%)
- Semi-Detached at 3043 (27.91%)
- Flat/Maisonette at 1429 (13.11%)
- Others at 197 (1.81%)
Average & Median Sales Price
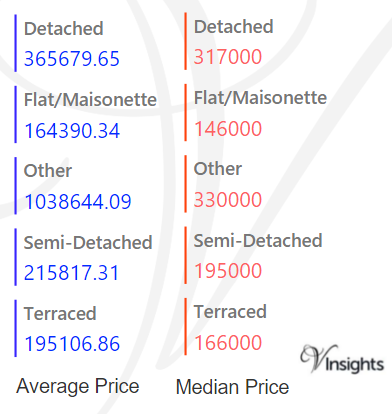
The average sales price in Warwickshire was £262 K. For the different property types it was:
- Detached at £366 K
- Semi-Detached at £216 K
- Terraced at £195 K
- Flat/Maisonette at £164 K
- Other at £1.04 millions
Similarly median sales price in Warwickshire was £210 K. For the different property types it was:
- Detached at £317 K
- Semi-Detached at £195 K
- Terraced at £166 K
- Flat/Maisonette at £146 K
- Other at £330 K
Average & Median Sales Price By Districts
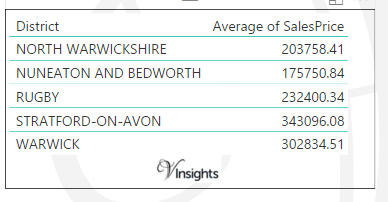
The average sales prices at district level in Warwickshire for 2015 is as follows:
- It was maximum for Stratford-On-Avon £343 K
- Warwick £303 K
- Rugby £232 K
- North Warwickshire £204 K
- with minimum for Nuneaton and Bedworth £176 K
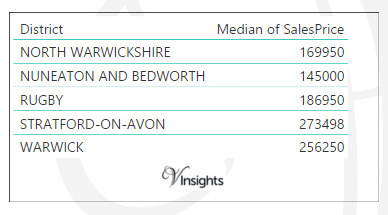
The median sales prices at district level in Warwickshire for 2015 is as follows:
- It was maximum for Stratford-On-Avon £273 K
- Warwick £256 K
- Rugby £187 K
- North Warwickshire £170 K
- with minimum for Nuneaton and Bedworth £145 K
New Vs Not New Property Statistics
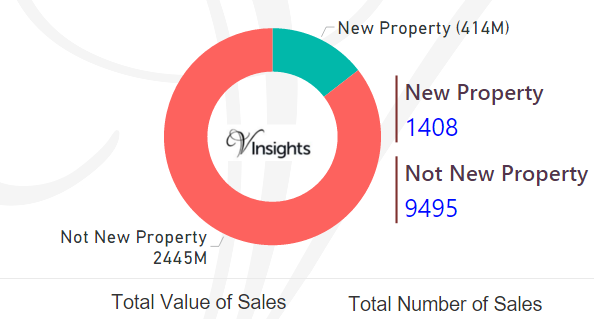
By Sales Values the split is as follows:
- New Properties contributed £414 millions (14.49%)
- Not New Property contributed £2.45 billions (85.51%)
By Total Number the split is as follows:
- New properties sold were 1408 (12.91%)
- Not new property sold were 9495 (87.09%)
All Posts on Warwickshire

7dbc807a-9959-43a4-a7d2-65efd09ccd2b|0|.0|27604f05-86ad-47ef-9e05-950bb762570c