Islington Property Market Grows, Inspite of Brexit and Stamp Duty Changes in 2016

Story Highlights

  • Islington in 2016 had total property sales of £2.24 billions
  • The total number of property sold in Islington was 2616
  • The average sales price in Islington was £855.3 K and the median sales price was £600 K
  • The sales value contributed by New Property was 17.2% where as Not New Property contributed 82.8%
  • Stamp duty changes caused monthly spike in March
  • Brexit coupled with Stamp duty hike arrested  total property sales growth to 1% in 2016


Total Sales By Property Type

Islington 2016 - Total Sales By Property Type


Islington is one of the Boroughs of Central London. It had total Property Sales of £2.24 billions which was 9.06% of Central London Property Market 2016

The split across the different property types are:

  • Flat/Maisonette £1.28 billions (57.11%)
  • Terraced £486 millions (21.7%)
  • Other £427 millions (19.07%)
  • Semi-Detached £35 millions (1.55%)
  • Detached £13 millions (0.58%)

Year on Year Comparison : Compared to Islington London Property Market 2015 in 2016

  • Terraced, Semi-Detached, Detached had lower total sales compared to 2015  
  • Flat/Maisonette, Other had higher total sales compared to 2015  


Islington Property Market at Postcode level

Postcode 

 Coverage Area         

 Local Authority Area
EC1A

St Bartholomew's Hospital

City Of London, Islington
EC1M Clerkenwell, Farringdon Islington, Camden, City of London
EC1R Finsbury, Finsbury Estate (west) Islington, Camden
EC1V Finsbury (east), Moorfields Eye Hospital Islington, Hackney
EC1Y St Luke's, Bunhill Fields Islington, City of London
EC2A Shoreditch Islington, Hackney, City of London
N1 Barnsbury (part), Canonbury, Kings Cross, Islington, Pentonville, De Beauvoir Town, Hoxton Hackney, Islington, Camden
N6 Highgate, Hampstead Heath (part) Camden, Haringey, Islington
N7 Holloway, Barnsbury (part), Islington (part), Tufnell Park (part) Islington, Camden
N8 Hornsey, Crouch End, Harringay (part) Haringey, Islington
N16 Stoke Newington, Stamford Hill (part), Shacklewell, Dalston (part), Newington Green (part) Islington, Hackney, Harrow
N19 Upper Holloway, Archway, Tufnell Park (part) Islington, Camden
NW5 Kentish Town district: Kentish Town, Camden Town (part), Gospel Oak (part), Dartmouth Park, Chalk Farm (east), Tufnell Park (west) Camden, Islington
WC1X Kings Cross, Finsbury (west), Clerkenwell (north) Camden, Islington


Month-wise Break-up of Total Sales

Islington 2016 - Month-wise Break-up of Total Sales

Some of the insights based on the £2.24 billions month-wise break-down :

Stamp Duty Hike Impact

  1. March had property sale spike of £ 457 millions  compared to £ 128 millions in Feb 
  2. The impetus for it was to avoid the extra 3% in Stamp Duty Tax applicable on buying an additional home, being applicable from April 1 2016

Brexit Impact

  1. Brexit took place on 23rd June 2016.
  2. As can be observed from the month-wise break-up there does  seem to have been some dip in property sales in the immediate aftermath of Brexit 
  3. Year on Year the property market for Islington has shown growth of 1.339% over 2015


Total No Of Properties Sold By Property Type

Islington 2016 - Total No Of Properties Sold By Property Type

 In Islington the total number of properties sold in year 2016 was 2616. The breakdown by different property types are:

  • Terraced  358 (13.69%)
  • Semi-Detached 23 (0.88%)
  • Other 168 (6.42%)
  • Flat/Maisonette 2061 (78.78%)
  • Detached 6 (0.23%)


Year on Year Comparison : Compared to Islington London Property Market 2015 in 2016

  • Total sales volume has increased by 19 i.e. 0.73%
  • All the property types except Flat/Maisonette and Other had lower sales volume compared to 2015
  • Others and Flat/Maisonette had increase in property sales compared to 2015


Average & Median Sales Price

Islington 2016 - Average & Median Sales Price


In 2016 the Average property price was £855.3 K in Islington. The average price for the different property types are:

  • Detached £2.15 millions
  • Flat/Maisonette £620 K
  • Other £2.54 millions
  • Semi-Detached £1.5 millions
  • Terraced £1.36 millions

The Median Price was £600 K. The median property price for the different property types are:

  • Detached £2.01 millions
  • Flat/Maisonette £560 K
  • Other £575 K
  • Semi-Detached £1.63 millions
  • Terraced £1.24 millions

Year on Year Comparison : Compared to Islington London Property Market 2015  in 2016

  • All property types have generally shown increase in property price except property type Other


New Vs Not New Property Statistics

Islington 2016 - New Vs Not New Property Statistics

By Value Of Sales

  • Not New Property contributed £1.85 billion (82.8%)
  • New Property £385 millions (17.2%) 

By Number Of Sales

  • The number of Not New Property sold was 2098 (80.2%)
  • The number of New Properties sold was 518 (19.8%) 

Year on Year Comparison : Compared to Islington London Property Market 2015  in 2016

  • New property market share in property market has gone up in 2016 over 2015

 All London Posts

Central London Property Market Impacted By Brexit, Declines by 12% in 2016

Story Highlights

  • Central London in 2016 had total property sales of £24.68 billions
  • City Of Westminster was the leader with £7.29 billions of sale
  • The total number of property sold in Central London 2016 was 19,071
  • The average sales price in Central London was £1.29 millions 
  • The average sales price across its counties was maximum in City of London at £5.65 millions 
  • The sales value contributed by New Property was 11.76% where for Not New it was 88.24%
  • Stamp duty changes caused monthly spike in March
  • Brexit coupled with Stamp Duty changes caused 12% decline in total value of property sales


Central London comprises of the Greater London boroughs of Camden, City Of London, Westminster, Islington, Kensington & Chelsea, Lambeth, Southwark


Total Sales By Borough
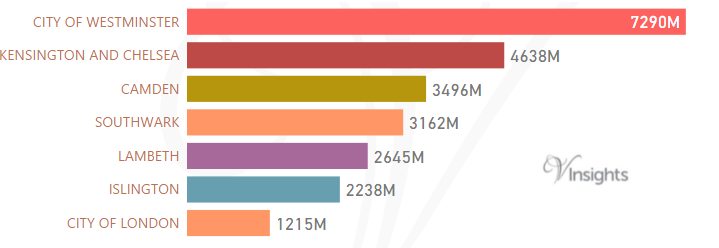
Central London 2016 - Total Sales By Borough

  £24.68 billions was the total sales in 2016.It was 32.48% of the London Property Market 2016.

Borough wise split of Central London Property Market 2016 :


Year on Year Comparison : Compared to Central London Property Market 2015  in 2016

  • Central London had property sales decrease of 12%.
  • Only Southwark, Islington had growth in total sales, rest of the boroughs had decline compared to 2015.


Total Sales By Property Types
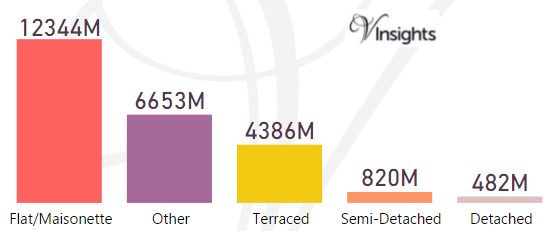
Central London 2016 - Total Sales By Property Types

The split of £24.68 billions across the different property types are:

  • Flat/Maisonette £12.3 billions (50.01%)
  • Other £6.65 billions (26.95%)
  • Terraced £4.4 billions (17.77%)
  • Semi-Detached £820 millions (3.32%)
  • Detached £482 millions (1.95%)


Year on Year Comparison : Compared to Central London Property Market 2015  in 2016

  • All the property type had lower total sales compared to 2015


Month-wise Break-up of Total Sales
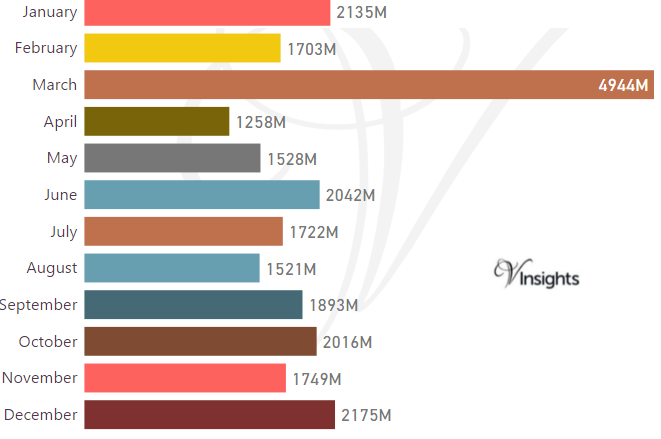
Central London 2016 - Month-wise Break-up of Total Sales


Some of the insights based on the £24.68 billions month-wise break-down :

Stamp Duty Hike Impact

  1. March had property sale spike of £4.94 billions compared to £ 1.7 billions in Feb.
  2. The impetus for it was to avoid the extra 3% in Stamp Duty Tax applicable on buying an additional home, being applicable from April 1 2016.


Brexit Impact

  1. Brexit took place on 23rd June 2016.
  2. As can be observed from the month-wise break-up there does seem to have been some dip in property sales in the immediate aftermath of Brexit.
  3. Year on Year the property market for Central London has shown a decline of 11.86% over 2015.


Total Number Of Sales By Property Types
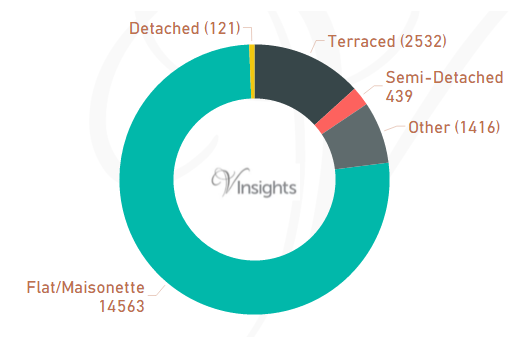
Central London 2016 - Total Number Of Sales By Property Types

The total number of property sold in Central London 2016 was 19,071. It is split as:

  • Flat/Maisonette 14,563 (76.36%)
  • Detached 121 (0.63%)
  • Semi-Detached 439 (2.3%)
  • Terraced 2532 (13.28%)
  • Other 1416 (7.42%)


Year on Year Comparison : Compared to Central London Property Market 2015  in 2016

  • Total sales volume has declined by 3,057 i.e. 13.82
  • All property types have shown decline in number of properties sold except property type Other.
  • Other has shown significant increase from 932 in 2015 to 1416 in 2016.


Average & Median Sales Price
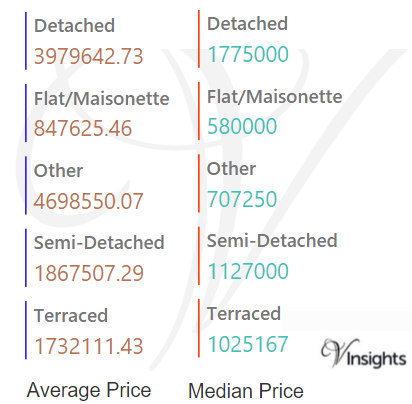
Central London 2016 - Average & Median Sales Price


The average sales price in Central London was £1.29 millions. For the different property types it was:

  • Detached £3.98 millions
  • Semi-Detached £1.87 millions
  • Terraced £1.73 millions
  • Flat/Maisonette £848 K
  • Other it is £4.70 millions

Similarly the median sales price in Central London was £635 K. For the different property types it was:

  • Detached £1.78 millions
  • Semi-Detached £1.13 millions
  • Terraced £1.03 millions
  • Flat/Maisonette £580 K
  • Other it is £707 K


Year on Year Comparison : Compared to Central London Property Market 2015  in 2016

  • All property types had increase in average and median sales price except for other.


Average & Median Sales Price By Borough
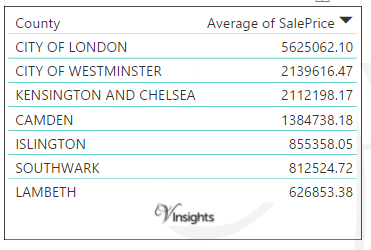
 

Central London 2016 - Average Sales Price By Borough

In Central London the Average of Sales Price is as above.
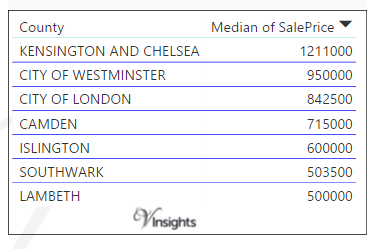
Central London 2016 - Median Sales Price By Borough


Year on Year Comparison : Compared to Central London Property Market 2015  in 2016


New Vs Not New Property Statistics
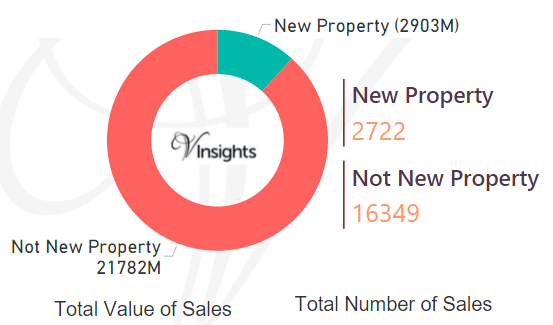
Central London 2016 - New Vs Not New Property Statistics

By Value Of Sales

  • The sales value contributed by New Property was £2.9 billions (11.76%)
  • Not New Property contributed £21.78 billions (88.24%)

By Number Of Sales

  • New properties sold were 2,722 (14.27%)
  • Not new property sold were 16,349 (85.73%)


Year on Year Comparison : Compared to Central London Property Market 2015  in 2016

  • New property market share in property market has gone up in 2016 over 2015

All London Posts 


Southwark Property Market Beats Brexit, Grows by 9% in 2016

Story Highlights

  • Southwark in 2016 had total property sales of £3.16 billions
  • The total number of property sold in Southwark 2016 was 3892
  • The average sales price in Southwark was £813 K and the median sales price was £504 K
  • The sales value contributed by New Property was 19.84% where as Not New Property contributed 80.16%
  • Stamp duty changes caused monthly spike in March
  • Brexit and Stamp duty changes have not had impact and total sales value has increased by 9%


Total Sales By Property Type
Southwark 2016 - Total Sales By Property Type

Southwark is one of the Boroughs of Central London. It had total Property Sales of £3.16 billions which was 12.81% of Central London Property Market 2016.

The split across the different property types are:

  • Terraced £484 millions (15.32%)
  • Semi-Detached £115 millions (3.65%)
  • Other £797 millions (25.2%)
  • Flat/Maisonette £1.7 billions (53.9%)
  • Detached £61 millions (1.93%)

Year on Year Comparison : Compared to Southwark Property Market 2015 in 2016

  • All the property type had lower total sales compared to 2015 except Others


Southwark Property Market at Postcode level

Postcode 

 Coverage Area         

 Local Authority Area
SE1

Bankside, South Bank, Lambeth (part), Southwark, Bermondsey (part), Vauxhall (part), Old Kent Road (part)

Lambeth, Southwark, City of London
SE4 Brockley, Crofton Park Lewisham, Southwark
SE5 Camberwell, Denmark Hill, Peckham, Brixton (part) Southwark, Lambeth
SE8 Deptford, Evelyn, Rotherhithe Greenwich, Lewisham, Southwark
SE11 Kennington, Lambeth (part), Vauxhall (part) Lambeth, Southwark
SE14 New Cross Lewisham, Southwark
SE15 Peckham, Nunhead, South Bermondsey (part), Old Kent Road (part) Lewisham, Southwark
SE16 Rotherhithe, Surrey Quays Southwark
SE17 Walworth, Kennington (part), Newington Southwark
SE19 Upper Norwood, Crystal Palace Bromley, Croydon, Lambeth, Lewisham, Southwark
SE21 Dulwich, Dulwich Village, West Dulwich, Tulse Hill (part) Lambeth, Southwark
SE22 East Dulwich, Dulwich Village (part), Peckham Rye, Loughborough Junction, Herne Hill Southwark
SE23 Forest Hill, Honor Oak, Crofton Park (part) Lewisham, Southwark
SE24 Herne Hill, Tulse Hill (part), Dulwich (part) Lambeth, Southwark
SE26 Sydenham, Crystal Palace (part) Bromley, Lewisham, Southwark

For property market details at post code level please click on Postcode in the table above.


Month-wise Break-up of Total Sales
Southwark 2016 - Month-wise Break-up of Total Sales

Some of the insights based on the £3.16 billions month-wise break-down :

Stamp Duty Hike Impact

  1. March had property sale spike of £474 millions  compared to £255 millions in Feb 
  2. The impetus for it was to avoid the extra 3% in Stamp Duty Tax applicable on buying an additional home, being applicable from April 1 2016

Brexit Impact

  1. Brexit took place on 23rd June 2016.
  2. As can be observed from the month-wise break-up there does not seem to have been some dip in property sales in the immediate aftermath of Brexit 
  3. Year on Year the property market for Southwark has shown a growth of 8.96% over 2015


Total No Of Properties Sold By Property Type

Southwark 2016 - Total No Of Properties Sold By Property Type

In Southwark the total number of properties sold in year 2016 was 3892. The breakdown by different property types are:

  • Terraced 611 (15.7%)
  • Semi-Detached 99 (2.54%)
  • Other 208 (5.34%)
  • Flat/Maisonette 2936 (75.44%)
  • Detached 38 (0.98%)

Year on Year Comparison : Compared to Southwark Property Market 2015 in 2016

  • Total sales volume has declined by 708 i.e. 15.4 %
  • All the property type had lower sales volume compared to 2015 except Other
  • Other has shown growth of 89% in number of sales


Average & Median Sales Price

Southwark 2016 - Average & Median Sales Price

In 2015 the Average property price was £813 K in Southwark. The average price for the different property types are:

  • Detached £1.61 millions
  • Flat/Maisonette £581 K
  • Other £3.83 millions
  • Semi-Detached £1.17 million
  • Terraced £793 K

The Median Price was £504 K. The median property price for the different property types are:

  • Detached £1.38 millions
  • Flat/Maisonette £455 K
  • Other £909 K
  • Semi-Detached £1 millions
  • Terraced £760 K


Year on Year Comparison : Compared to Southwark Property Market 2015 in 2016

  • Property types Detached , Other have had decrease in average and median property prices
  • Flat, Semi-Detached, Terraced have had increase in average and median property price


New Vs Not New Property Statistics

Southwark 2016 - New Vs Not New Property Statistics

By Value Of Sales

  • Not New Property contributed £2.54 billions (80.16%)
  • New Property £628 millions (19.84%)

By Number Of Sales

  • The number of Not New Property sold was 3157 (81.12%)
  • The number of New Properties sold was 735 (18.88%) 


Year on Year Comparison : Compared to Southwark Property Market 2015 in 2016

  • New property market share in property market has gone up in 2016 over 2015

 All London Posts

Lambeth Property Market Suffers Double Digit Decline Due To Brexit in 2016

Story Highlights

  • Lambeth in 2016 had total property sales of  £2.65 billions
  • The total number of property sold in Lambeth 2016 was 4219
  • The average sales price in Lambeth was £627 K and the median sales price was £500 K
  • The sales value contributed by New Property was 11.43% where as Not New Property contributed 88.57%
  • Stamp duty changes caused monthly spike in March
  • Brexit coupled with Stamp Duty changes had significant decline of 14.5% in total sales value


Total Sales By Property Type
Lambeth 2016 - Total Sales By Property Type

Lambeth is one of the Boroughs of Central London. It had total Property Sales of  £2.65 billions which was 10.71% of Central London Property Market 2016.

The split across the different property types are:

  • Flat/Maisonette £1.52 billions (57.63%)
  • Terraced £622 millions (23.51%)
  • Other £262 millions (9.92%)
  • Semi-Detached £199 millions (7.54%)
  • Detached £37 millions (1.4%)

Year on Year Comparison : Compared to Lambeth Property Market 2015 in 2016

  • All the property type had lower total sales compared to 2015


Lambeth Property Market at Postcode level

Postcode 

 Coverage Area         

 Local Authority Area
SE1

Bankside, South Bank, Lambeth (part), Southwark, Bermondsey (part), Vauxhall (part), Old Kent Road (part)

Lambeth, Southwark, City of London
SE5 Camberwell, Denmark Hill, Peckham, Brixton (part) Southwark, Lambeth
SE11 Kennington, Lambeth (part), Vauxhall (part) Lambeth, Southwark
SE19 Upper Norwood, Crystal Palace Bromley, Croydon, Lambeth, Lewisham, Southwark
SE21 Dulwich, Dulwich Village, West Dulwich, Tulse Hill (part) Lambeth, Southwark
SE24  Herne Hill, Tulse Hill (part), Dulwich (part) Lambeth, Southwark
SE27  West Norwood, Gipsy Hill (part)  Lambeth
SW2  Brixton, Brixton Hill, Streatham Hill, Tulse Hill, Clapham Park, Eastern parts of Balham  Lambeth
SW4  Clapham, Stockwell(part)  Lambeth, Wandsworth
SW8  South Lambeth, Vauxhall, Battersea (part), Wandsworth Road, Clapham (part), NW area of Stockwell  Lambeth, Wandsworth
SW9  Stockwell, Brixton (part), Clapham (part), Oval (part)  Lambeth
SW11 Battersea, Clapham South Lambeth, Wandsworth
SW12  Balham, Clapham South, Wandsworth Common (part) Lambeth, Wandsworth
SW16  Streatham, Streatham Common, Norbury, Thornton Heath, Streatham Park, Furzedown, Streatham Vale, Mitcham Common, Pollards Hill, Eastfields Croydon, Lambeth, Merton, Wandsworth

 For property market details at post code level please click on Postcode in the table above.


Month-wise Break-up of Total Sales
Lambeth 2016 - Month-wise Break-up of Total Sales


Stamp Duty Hike Impact

  1. March had property sale spike of £446 millions  compared to £209 millions in Feb 
  2. The impetus for it was to avoid the extra 3% in Stamp Duty Tax applicable on buying an additional home, being applicable from April 1 2016


Brexit Impact

  1. Brexit took place on 23rd June 2016.
  2. As can be observed from the month-wise break-up there does seem to have been some dip in property sales after Brexit 
  3. Year on Year the property market for Lambeth has shown a decline of 14.51% over 2015


Total No Of Properties Sold By Property Type
Lambeth 2016 - Total No Of Properties Sold By Property Type


The total number of property sold in Lambeth was 4219. It is split as:

  • Terraced 716 (16.97%)
  • Semi-Detached 206 (4.88%)
  • Other 173 (4.1%)
  • Flat/Maisonette 3095 (73.36%)
  • Detached 29 (0.69%)


Year on Year Comparison : Compared to Lambeth Property Market 2015 in 2016

  • Total sales volume has declined by 16.4 %
  • All the property type had lower sales volume compared to 2015 except for others
  • Other sales volume has shown growth of 84%


Average & Median Sales Price
Lambeth 2016 - Average & Median Sales Price

In 2016 the Average property price was £627 K in Lambeth . The average price for the different property types are:

  • Detached £1.28 millions
  • Flat/Maisonette £492 K
  • Other £1.52 millions
  • Semi-Detached £967 K
  • Terraced £868 K

The Median Price was £500 K. The median property price for the different property types are:

  • Detached £1.03 millions
  • Flat/Maisonette £460 K
  • Other £500 K
  • Semi-Detached £858 K
  • Terraced £793 K
  • Year on Year Comparison : Compared to Lambeth Property Market 2015  in 2016

    • All property types have had increase in average sales price except for other
    • All property types have had increase in median sales price 


New Vs Not New Property Statistics

Lambeth 2016 - New Vs Not New Property Statistics

By Value Of Sales

  • Not New Property contributed £2.34 billions (88.57%)
  • New Property £302 millions (11.43%) 

By Number Of Sales

  • The number of Not New Property sold was 3686 (87.37%)
  • The number of New Properties sold was 533 (12.63%) 

Year on Year Comparison : Compared to Lambeth Property Market 2015  in 2016

  • New property market share in property market has gone up in 2016 over 2015


 All London Posts

Kensington and Chelsea Property Market Impacted By Brexit, Declines 21% in 2016

Story Highlights

  • Kensington And Chelsea in 2016 had total property sales of £4.64 billions
  • The total number of property sold in Kensington And Chelsea 2016 was 2,196
  • The average sales price in Kensington And Chelsea was £2.11 millions and the median sales price was £1.21 millions
  • The sales value contributed by New Property was 10.26% where as Not New Property contributed 89.74%
  • Stamp duty changes caused monthly spike in March
  • Brexit coupled with Stamp duty changes caused significant decline in property sales, declines by 21%


Total Sales By Property Type
Kensington And Chelsea 2016 - Total Sales By Property Type

Kensington And Chelsea is one of the Boroughs of Central London. It had total Property Sales of £4.64 billions which was 18.79% of Central London Property Market 2016.

The split across the different property types are:

  • Terraced £1.4 billions (30.08%)
  • Semi-Detached £191 millions (4.13%)
  • Other £488 millions (10.51%)
  • Flat/Maisonette £2.43 billions (52.4%)
  • Detached £134 millions (2.88%)

Year on Year Comparison : Compared to Kensignton And Chelsea London Property Market 2015 in 2016

  • All the property type except Detached had lower total sales compared to 2015
  • Detached property had higher sales of £31 millions i.e. 30 %


Kensignton And Chelsea Property Market at Postcode level

Postcode 

 Coverage Area         

 Local Authority Area
SW1W

Belgravia, Chelsea (part), area between Sloane Square and Victoria Station, south of Kings Road

Kensington and Chelsea, Westminster
SW1X Belgravia, north of Eaton Square, Knightsbridge (part), Chelsea (part) Kensington and Chelsea, Westminster
SW3 Chelsea, Brompton, Knightsbridge (part) Kensington and Chelsea
SW5 Earls Court Kensington and Chelsea
SW7 South Kensington, Knightsbridge (part) Kensington and Chelsea, Westminster
W2 Paddington, Bayswater, Hyde Park, Westbourne Green, Little Venice (part), Notting Hill (part) Westminster, Kensington and Chelsea
W8 Kensington, Holland Park (part) Kensington and Chelsea
W10 North Kensington, Kensal Town, Ladbroke Grove (north), Queen's Park (part)   Kensington and Chelsea, Westminster, Hammersmith and Fulham, Brent 
W11 Notting Hill, Ladbroke Grove (south), Holland Park (part)  Kensington and Chelsea, Westminster, Hammersmith and Fulham
W14

West Kensington, Kensington Olympia, Holland Park

Hammersmith and Fulham, Kensington and Chelsea


Month-wise break-up of Total Sales
Kensington And Chelsea 2016 - Month-wise break-up of Total Sales

Some of the insights based on the £4.64 billions month-wise break-down :

Stamp Duty Hike Impact

  1. March had property sale spike of £1.15 billions compared to £433 millions in Feb 
  2. The impetus for it was to avoid the extra 3% in Stamp Duty Tax applicable on buying an additional home, being applicable from April 1 2016

Brexit Impact

  1. Brexit took place on 23rd June 2016.
  2. As can be observed from the month-wise break-up there seems to have been dip in property sales in the immediate after-math of Brexit 
  3. Year on Year the property market for Kensington And Chelsea has shown a decline of 21.36% over 2015


Total No Of Properties Sold By Property Type
Kensington And Chelsea 2016 - Total No Of Properties Sold By Property Type

In Kensignton and Chelsea the total number of properties sold in the year 2016 was 2196. The breakdown by different property types are:

  • Terraced 330(15.03%)
  • Semi-Detached 29 (1.32%)
  • Other 140 (6.38%)
  • Flat/Maisonette 1,689 (76.91%)
  • Detached 8 (0.36%)

Year on Year Comparison : Compared to Kensignton And Chelsea London Property Market 2015 in 2016

  • Total sales volume has declined by 486 i.e. 18.12 %
  • All the property type had lower sales volume compared to 2015


Average & Median Sales Price

Kensington And Chelsea 2016 - Average & Median Sales Price

In 2015 the Average property price was £2.11 millions in Kensington and Chlesea. The average property price for the different property types are:

  • Detached £16.7 millions
  • Flat/Maisonette £1.44 millions
  • Other £3.5 millions
  • Semi-Detached £6.6 millions
  • Terraced £4.23 millions

The Median Price was £1.21 millions. The median property price for the different property types are:

  • Detached £11.35 millions
  • Flat/Maisonette £1.02 millions
  • Other £1.16 millions
  • Semi-Detached £6 millions
  • Terraced £3.35 millions

Year on Year Comparison : Compared to Kensignton And Chelsea London Property Market 2015 in 2016

  • Detached, Terraced had increase in average property price
  • Flat/Maisonette, Other, Semi-Detached had decrease in average property price


New Vs Not New Property Statistics
Kensington And Chelsea 2016 - New Vs Not New Property Statistics

By Value Of Sales

  • Not New Property contributed £4.16 billion (89.74%)
  • New Property £476 millions (10.26%) 

By Number Of Sales

  • The number of Not New Property sold was 1953 (88.93%)
  • The number of New Properties sold was 243 (11.07%)

Year on Year Comparison : Compared to Kensignton And Chelsea London Property Market 2015  in 2016

  • New property market share in property market has gone down in 2016 over 2015

 All London Posts