
Story Highlights
- East London had total property sales of £16.42 billions in 2016
- The maximum sales at borough level was in Tower Hamlets at £2.9 billions
- The total number of East London properties sold in 2016 was 35,121
- The average sales price in East London was £468 K, whereas median was £375 K
- By borough the average price was maximum in Hackney at £740 K
- New Property sales were 15.12% by value, whereas Not New Property contributed 84.88%
- Stamp duty hike caused monthly spike in March
- Brexit and Stamp Duty Hike arrested the growth in total property sales compared to 2015
East London comprises of the boroughs of Barking and Dagenham, Bexley, Greenwich, Hackney, Havering, Lewisham, Newham, Redbridge, Tower Hamlets, Waltham Forest
Total Sales By Borough
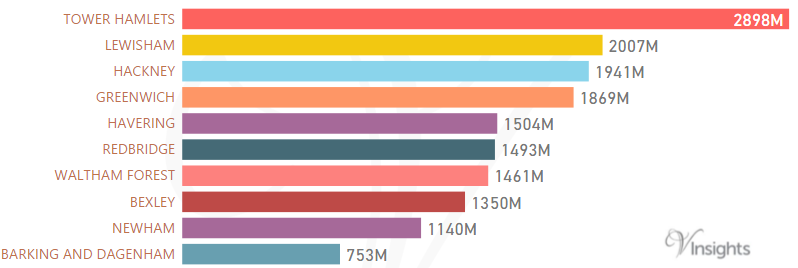
East London in 2016 had total property sales of £16.42 billions. It is 21.6% of London Property Market 2016
The split across its borough is as above
Year on Year Comparison : Compared to East London Property Market 2015 in 2016
- East London as a whole had property sales remaining fairly stable with almost no growth or decline.
- The boroughs did not show major deviation in total sales compared to 2015.
Total Value of Sales By Property Types
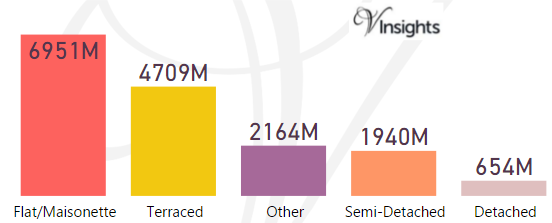
The split of £16.42 billions across the different property types are:
- Detached: £654 millions (3.98%)
- Semi-Detached: £1.94 billions (11.82%)
- Other: £2.16 billions (13.18%)
- Terraced: £4.71 billions (28.68%)
- Flat/Maisonette: £6.95 billions (42.34%)
Year on Year Comparison : Compared to East London Property Market 2015 in 2016
- All the property types have shown decline in sales except others.
- Others has shown growth of about 420 millions i.e. 24% year on year
Month-wise Break-up of Total Sales
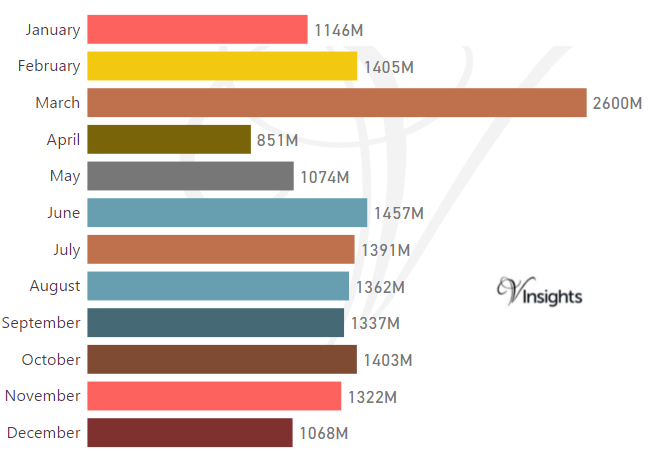
Stamp Duty Hike Impact
- March had property sale spike of £ 2.6 billions compared to £ 1.41 billions in Feb
- The impetus for it was to avoid the extra 3% in Stamp Duty Tax applicable on buying an additional home, being applicable from April 1 2016
Brexit Impact
- Brexit took place on 23rd June 2016.
- As can be observed from the month-wise break-up there does not seem to have been significant dip in property sales in the immediate aftermath of Brexit
- Year on Year the property market for East London has shown no decline over 2015
Total Number Of Sales By Property Types
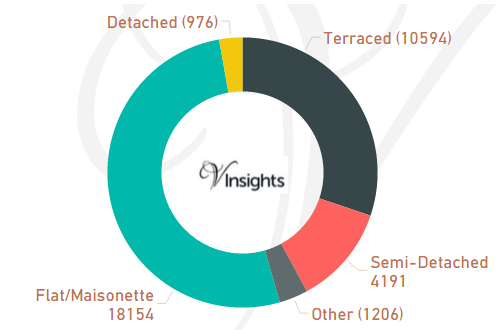
The total number of properties sold in East London 2016 was 35,121. It is split as
- Detached: 976 (2.78%)
- Semi-Detached: 4,191 (11.93%)
- Terraced: 10,594 (30.16%)
- Flat/Maisonette: 18,154 (51.69%)
- Other: 1,206 (3.43%)
Year on Year Comparison : Compared to East London Property Market 2015 in 2016
- Total number of property sales in East London has decreased by 4,483 which is 11.32% decline
- All property types have shown decline in number of properties sold except property type Other
- Other has shown significant increase of 66%.
Average & Median Sales Price
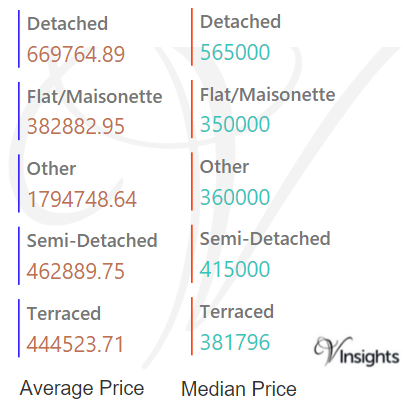
The average sales price in East London was £468 K. For the different property types it was:
- Detached: £670 K
- Semi-Detached: £463 K
- Terraced: £445 K
- Flat/Maisonette: £383 K
- Other it is £1.80 millions.
Similarly the median sales price in East London was £375 K. For the different property types it was:
- Detached: £565 K
- Semi-Detached: £415 K
- Terraced: £382 K
- Flat/Maisonette: £350 K
- Other it is £360 K
Year on Year Comparison : Compared to East London Property Market 2015 in 2016
- The average and median sales price across all property types have gone up except for others
Average & Median Sales Price By Borough
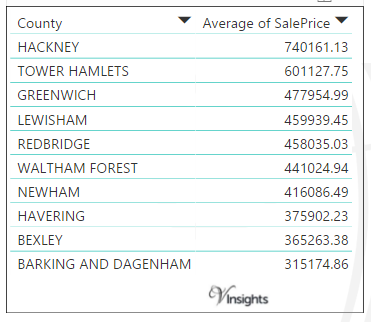
East London average sales price at borough level is as above.
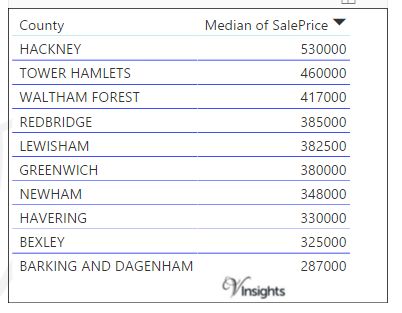
East London median sales price at borough level is as above.
Year on Year Comparison : Compared to East London Property Market 2015 in 2016
- The average and median sales price across all the East London boroughs have gone up with Hackney leading the pack
New Vs Not New Property Statistics
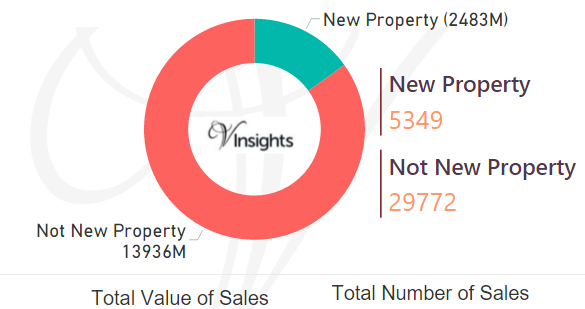
By Value Of Sales
- The sales value contributed by New Property was £2.48 billions (15.12%)
- Not New Property contributed £13.94 billions (84.88%).
By Number Of Sales
- New properties sold were 5,349 (15.23%)
- where as not new property sold were 29,772 (84.77%)
Year on Year Comparison : Compared to East London Property Market 2015 in 2016
- New property market share in property market has gone up in 2016 over 2015
All London Posts 
8f17abf4-a756-4983-ac02-df229df9bbe5|0|.0|27604f05-86ad-47ef-9e05-950bb762570c