Story Highlights
- Hackney had total Property Sales of £1.94 billions in 2016
- The total number of properties sold in year 2016 was 2623
- The Average property price was £740 K in Hackney while Median was £530 K
- Not New Property contributed 85.44% by value and New Property 14.56%
- Stamp duty changes caused monthly spike in March
- Brexit coupled with Stamp duty changes declined by 3.5% in total sales value
Hackney is one of the Boroughs of East London. It had total Property Sales of £1.94 billions which was 11.82 % of East London Property Market 2016.
Total Sales By Property Type
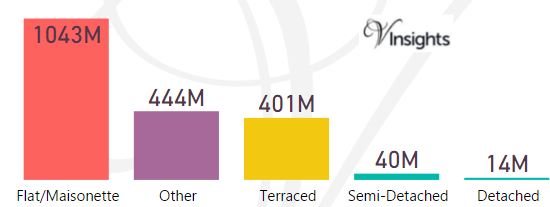
The split of £1.94 billions across the different property types are:
- Flat/Maisonette £1.04 billions (53.72%)
- Other £444 millions (22.86%)
- Terraced £401 millions (20.64%)
- Semi-Detached £40 millions (2.08%)
- Detached £14 millions (0.7%).
Year on Year Comparison : Compared to Hackney Property Market 2015 in 2016
- Flat/Maisonette, Terraced have shown decline in sales value year on year
- Others has shown growth 85.77% year on year
Hackney Property Market at Postcode level
| Postcode |
Coverage Area
|
Local Authority Area |
| E1 |
Eastern head district: Aldgate (part), Bishopsgate (part), Whitechapel, Shoreditch (part), Spitalfields, Shadwell, Stepney, Globe Town (part), Mile End (part), Portsoken, Brick Lane
|
Tower Hamlets, Hackney, City of London |
| E2 |
Bethnal Green district: Bethnal Green, Haggerston, Hoxton, Shoreditch (part), Cambridge Heath, Globe Town (part)
|
Tower Hamlets, Hackney |
| E5 |
Clapton district: Leyton (Part), Upper Clapton, Lower Clapton, Stoke Newington (part)
|
Hackney,Waltham Forest |
| E8 |
Hackney district: Hackney Central, Dalston, London Fields, Stoke Newington (part)
|
Hackney |
| E9 |
Homerton district: Homerton, Hackney Wick, South Hackney, Hackney Marshes, Victoria Park
|
Hackney, Tower Hamlets |
| EC1V |
Finsbury (east), Moorfields Eye Hospital
|
Islington, Hackney |
| EC2A |
Shoreditch
|
Islington, Hackney, City of London |
| N1 |
Barnsbury (part), Canonbury, Kings Cross, Islington, Pentonville, De Beauvoir Town, Hoxton
|
Hackney, Islington, Camden |
| N4 |
Finsbury Park, Manor House, Harringay (part), Stroud Green (part)
|
Haringey, Islington, Hackney |
| N5 |
Highbury, Highbury Fields
|
Islington, Hackney |
| N15 |
South Tottenham, Harringay (part), West Green, Seven Sisters, Stamford Hill (part)
|
Hackney, Haringey |
| N16 |
Stoke Newington, Stamford Hill (part), Shacklewell, Dalston (part), Newington Green (part)
|
Islington, Hackney, Harrow |
For property market details at post code level please click on Postcode in the table above.
Month-wise Break-up of Total Sales
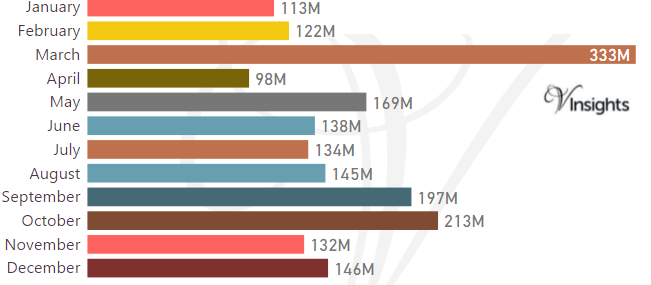
Stamp Duty Hike Impact
- March had property sale spike of £333 millions compared to £122 millions in Feb
- The impetus for it was to avoid the extra 3% in Stamp Duty Tax applicable on buying an additional home, being applicable from April 1 2016
Brexit Impact
- Brexit took place on 23rd June 2016.
- As can be observed from the month-wise break-up there does not seem to have been significant dip in property sales in the immediate aftermath of Brexit
- Year on Year the property market for Hackney has shown decline of 3.48% over 2015
Total No Of Properties Sold By Property Type
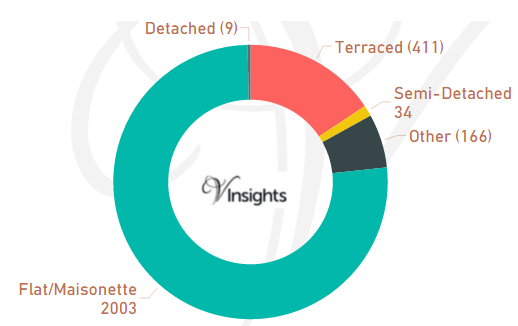
In Hackney the total number of properties sold in year 2016 was 2623. The breakdown by different property types are:
- Terraced 411 (15.67%)
- Semi-Detached 34 (1.3%)
- Other 166 (6.33%)
- Flat/Maisonette 2003 (76.36%)
- Detached 9 (0.34%).
Year on Year Comparison : Compared to Hackney Property Market 2015 in 2016
- Total number of property sales in Hackney has declined by 20.35%
- Other has shown significant growth of 26.7%.
Average & Median Sales Price
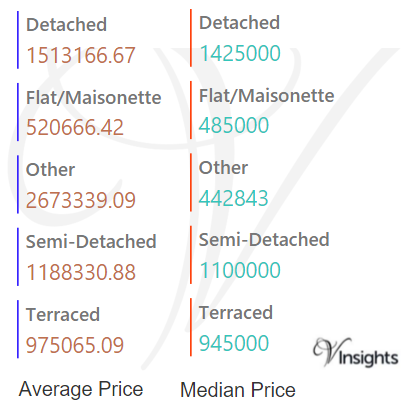
In 2016 the Average property price was £740 K in Hackney. The average price for the different property types are:
- Detached £ 1.5 millions
- Flat/Maisonette £521 K
- Other £2.67 millions
- Semi-Detached £1.18 millions
- Terraced £975 K.
The Median Price was £530 K. The median property price for the different property types are:
- Detached £1.43 millions
- Flat/Maisonette £485 K
- Other £443 K
- Semi-Detached £1.1 millions
- Terraced £945 K.
Year on Year Comparison : Compared to Hackney Property Market 2015 in 2016
- The average and median sales price across all property types have gone up except for Other
- Other had increase in average price and decrease in median price
New Vs Not New Property Statistics
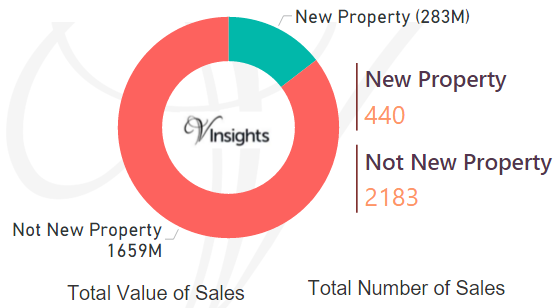
By Value Of Sales
- Not New Property Contributed £1.66 billion (85.44%)
- New Property £283 millions (14.56%)
By Number Of Sales
- The number of Not New Property sold was 2183 (83.23%)
- The number of New Properties sold was 440 (16.77%)
Year on Year Comparison : Compared to Hackney Property Market 2015 in 2016
- New property market share in property market has gone down in 2016 over 2015
All London Posts
46658790-0957-47ac-95de-5519f91e6025|0|.0|27604f05-86ad-47ef-9e05-950bb762570c