Story Highlights
- Newham had total Property Sales of £1.14 billions in 2016
- The total number of properties sold in year 2016 was 2741
- The Average property price was £416 K while Median was £348 K
- Not New Property Contributed 88.87% by value and New Property 11.13%
- Stamp duty hike caused monthly spike in March
- Brexit coupled with Stamp duty changes caused 5% decline in total sales value over 2015
Newham is one of the Boroughs of East London. It had total Property Sales of £1.14 billions which was 6.95% of East London Property Market 2016
Total Sales By Property Type
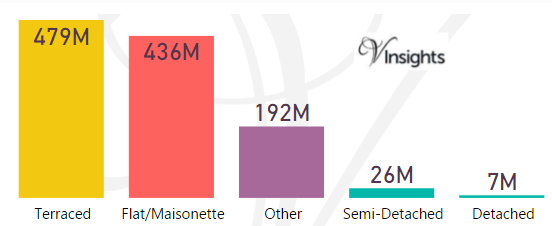
The split of £1.14 billions across the different property types are:
- Terraced £479 millions (42%)
- Flat/Maisonette £436 millions (38.26%)
- Other £192 millions (16.86%)
- Semi-Detached £26 millions (2.27%)
- Detached £7 millions (0.61%)
Year on Year Comparison : Compared to Newham Property Market 2015 in 2016
- All the property types have reamined constant or shown decline in sales value except Other
- Other has shown growth of 28.86%
Newham Property Market at Postcode level
| Postcode |
Coverage Area
|
Local Authority Area |
| E3 |
Bow district: Bow, Bromley-by-Bow, Old Ford, Mile End, Fish Island, Bow Common, Poplar (part) Limehouse (part) Three Mills, London Gas Museum
|
Tower Hamlets, Newham |
| E6 |
East Ham district: East Ham, Beckton, Upton Park (part), Barking (part) |
Newham, Barking and Dagenham |
| E7 |
Forest Gate district: Forest Gate, Leytonstone (Part), Stratford (part) |
Newham, Waltham Forest |
| E12 |
Manor Park district: Manor Park, Little Ilford, Aldersbrook (part) |
Newham, Redbridge,Barking and Dagenham |
| E13 |
Plaistow district: Plaistow, West Ham (part), Upton Park (part) |
Newham |
| E15 |
Stratford district: Stratford, West Ham (part), Maryland, Leyton (part), Leytonstone (part) Temple Mills (part), Hackney Wick (part), Bow (part) |
Newham, Waltham Forest, Hackney, Tower Hamlets |
| E16 |
Victoria Docks and North Woolwich district: Canning Town, Silvertown, Royal Docks, North Woolwich, Beckton (part)
|
Newham |
| E20 |
Olympic Park district: Olympic Park, & parts of Stratford, Homerton, Leyton, Bow
|
Newham, Waltham Forest, Hackney, Tower Hamlets |
For property market details at post code level please click on Postcode in the table above.
Month-wise Break-up of Total Sales
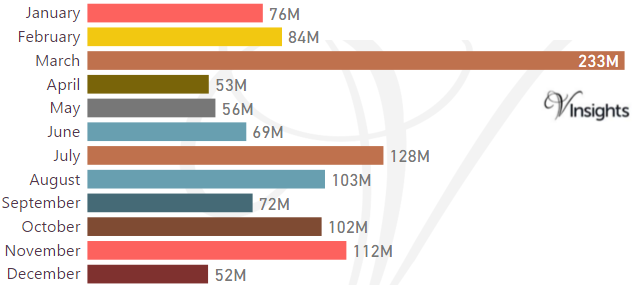
Stamp Duty Hike Impact
- March had property sale spike of £ 233 millions compared to £84 millions in Feb
- The impetus for it was to avoid the extra 3% in Stamp Duty Tax applicable on buying an additional home, being applicable from April 1 2016
Brexit Impact
- Brexit took place on 23rd June 2016.
- As can be observed from the month-wise break-up there does not seem to have been significant dip in property sales in the immediate aftermath of Brexit
- Year on Year the property market for Newham has declined by 5% over 2015
Total Number Of Sales By Property Types
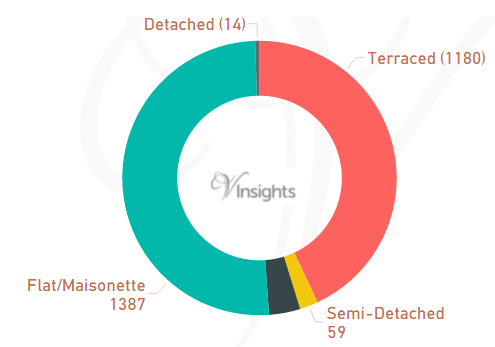
In Newham the total number of properties sold in year 2016 was 2741. The breakdown by different property types are:
- Terraced 1180 (43.05%)
- Semi-Detached 59 (2.15%)
- Other 101 (3.68%)
- Flat/Maisonette 1387 (50.6%)
- Detached 14 (0.51%)
Year on Year Comparison : Compared to Newham Property Market 2015 in 2016
- Total number of property sales in Newham has declined by 20.18%
- All property types have shown decline in number of properties sold except property type Other
- Other has shown significant growth of 77.2%.
Average & Median Sales Price
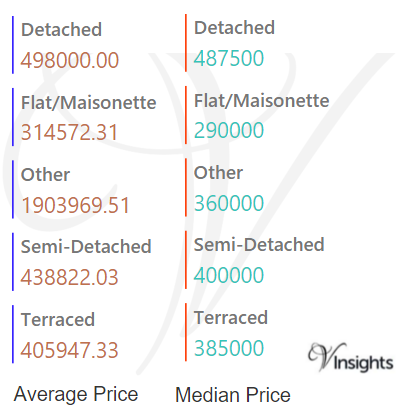
In 2015 the Average property price was £416 K in Newham. The average price for the different property types are:
- Detached £498 K
- Flat/Maisonette £315 K
- Other £1.9 millions
- Semi-Detached £439 K
- Terraced £406 K.
The Median Price was £348 K. The median property price for the different property types are:
- Detached £488 K
- Flat/Maisonette £290 K
- Other £360 K
- Semi-Detached £400 K
- Terraced £385 K
Year on Year Comparison : Compared to Newham Property Market 2015 in 2016
- The average and median sales price across all property types have gone up except for others
New Vs Not New Property Statistics
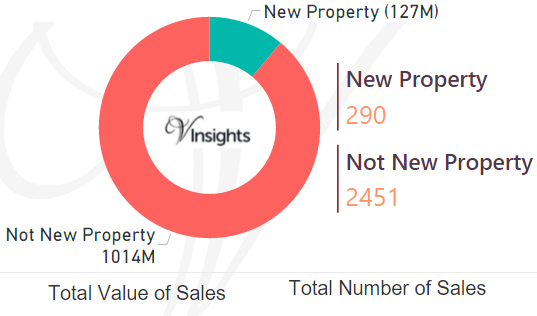
By Value Of Sales
- Not New Property contributed £1.01 billion (88.87%)
- New Property £127 millions (11.13%)
By Number Of Sales
- The number of Not New Property sold was 290 (10.58%)
- The number of New Properties sold was 2451 (89.42%)
Year on Year Comparison : Compared to Newham Property Market 2015 in 2016
- New property market share in property market has down in 2016 over 2015
All London Posts
a26e1289-cf88-498f-8eb8-ab89f397244e|0|.0|27604f05-86ad-47ef-9e05-950bb762570c