
Story Highlights
- Central London in 2016 had total property sales of £24.68 billions
- City Of Westminster was the leader with £7.29 billions of sale
- The total number of property sold in Central London 2016 was 19,071
- The average sales price in Central London was £1.29 millions
- The average sales price across its counties was maximum in City of London at £5.65 millions
- The sales value contributed by New Property was 11.76% where for Not New it was 88.24%
- Stamp duty changes caused monthly spike in March
- Brexit coupled with Stamp Duty changes caused 12% decline in total value of property sales
Central London comprises of the Greater London boroughs of Camden, City Of London, Westminster, Islington, Kensington & Chelsea, Lambeth, Southwark
Total Sales By Borough
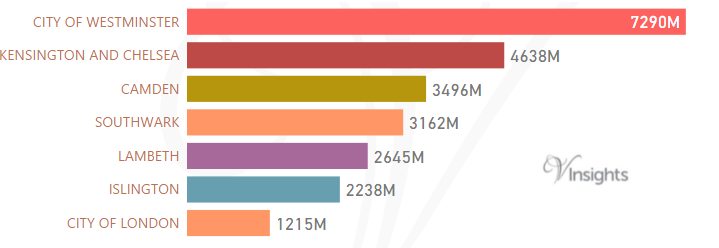
£24.68 billions was the total sales in 2016.It was 32.48% of the London Property Market 2016.
Borough wise split of Central London Property Market 2016 :
Year on Year Comparison : Compared to Central London Property Market 2015 in 2016
- Central London had property sales decrease of 12%.
- Only Southwark, Islington had growth in total sales, rest of the boroughs had decline compared to 2015.
Total Sales By Property Types
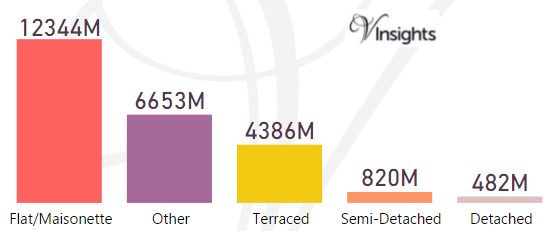
The split of £24.68 billions across the different property types are:
- Flat/Maisonette £12.3 billions (50.01%)
- Other £6.65 billions (26.95%)
- Terraced £4.4 billions (17.77%)
- Semi-Detached £820 millions (3.32%)
- Detached £482 millions (1.95%)
Year on Year Comparison : Compared to Central London Property Market 2015 in 2016
- All the property type had lower total sales compared to 2015
Month-wise Break-up of Total Sales
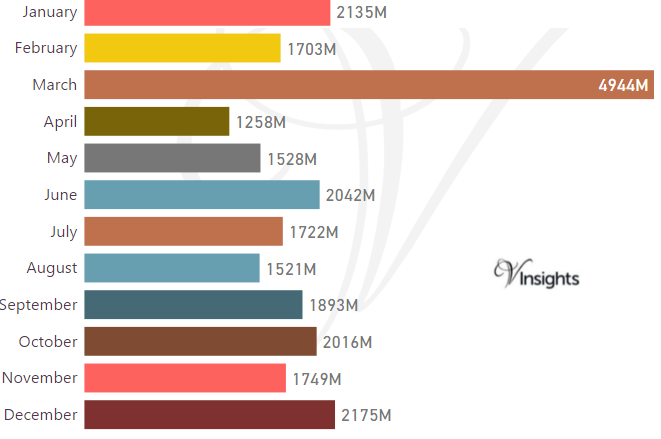
Some of the insights based on the £24.68 billions month-wise break-down :
Stamp Duty Hike Impact
- March had property sale spike of £4.94 billions compared to £ 1.7 billions in Feb.
- The impetus for it was to avoid the extra 3% in Stamp Duty Tax applicable on buying an additional home, being applicable from April 1 2016.
Brexit Impact
- Brexit took place on 23rd June 2016.
- As can be observed from the month-wise break-up there does seem to have been some dip in property sales in the immediate aftermath of Brexit.
- Year on Year the property market for Central London has shown a decline of 11.86% over 2015.
Total Number Of Sales By Property Types
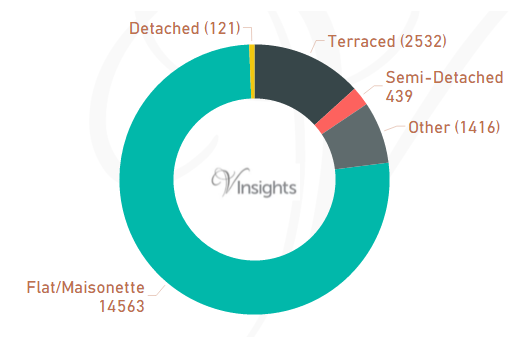
The total number of property sold in Central London 2016 was 19,071. It is split as:
- Flat/Maisonette 14,563 (76.36%)
- Detached 121 (0.63%)
- Semi-Detached 439 (2.3%)
- Terraced 2532 (13.28%)
- Other 1416 (7.42%)
Year on Year Comparison : Compared to Central London Property Market 2015 in 2016
- Total sales volume has declined by 3,057 i.e. 13.82
- All property types have shown decline in number of properties sold except property type Other.
- Other has shown significant increase from 932 in 2015 to 1416 in 2016.
Average & Median Sales Price
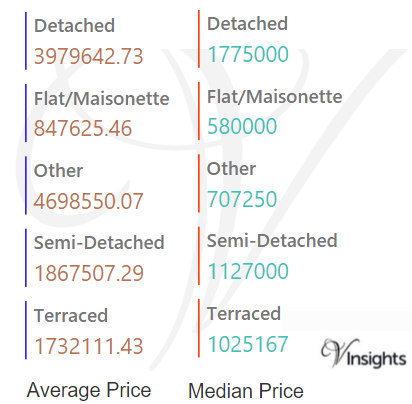
The average sales price in Central London was £1.29 millions. For the different property types it was:
- Detached £3.98 millions
- Semi-Detached £1.87 millions
- Terraced £1.73 millions
- Flat/Maisonette £848 K
- Other it is £4.70 millions
Similarly the median sales price in Central London was £635 K. For the different property types it was:
- Detached £1.78 millions
- Semi-Detached £1.13 millions
- Terraced £1.03 millions
- Flat/Maisonette £580 K
- Other it is £707 K
Year on Year Comparison : Compared to Central London Property Market 2015 in 2016
- All property types had increase in average and median sales price except for other.
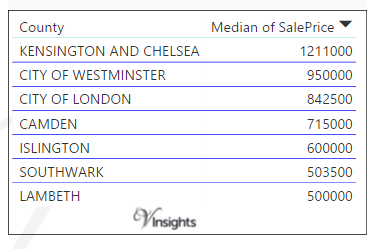
Average & Median Sales Price By Borough
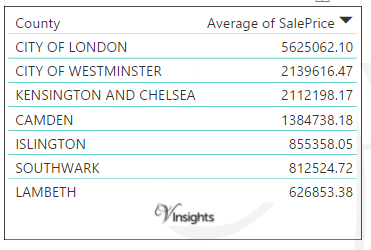
In Central London the Average of Sales Price is as above.
Year on Year Comparison : Compared to Central London Property Market 2015 in 2016
New Vs Not New Property Statistics
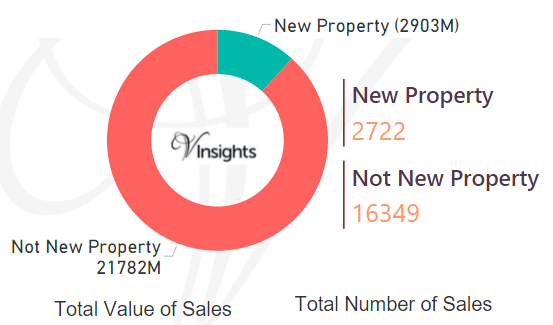
By Value Of Sales
- The sales value contributed by New Property was £2.9 billions (11.76%)
- Not New Property contributed £21.78 billions (88.24%)
By Number Of Sales
- New properties sold were 2,722 (14.27%)
- Not new property sold were 16,349 (85.73%)
Year on Year Comparison : Compared to Central London Property Market 2015 in 2016
- New property market share in property market has gone up in 2016 over 2015
All London Posts 
3325afa6-e2aa-40af-844d-7e2882364524|0|.0|27604f05-86ad-47ef-9e05-950bb762570c