Story Highlights
- Lewisham had total Property Sales of £2 billions in 2016
- The total number of properties sold in year 2016 was 4364
- The Average property price was £460 K in Lewisham while Median was £383 K
- Not New Property Contributed 86.6% by value and New Property 13.4%
- Stamp duty hike caused monthly spike in March
- Brexit coupled with Stamp duty hike caused decline in total property sales by 12.51% in 2016
Lewisham is one of the Boroughs of East London. It had total Property Sales of £2 billions which was 12.23% of East London Property Market 2016
Total Sales By Property Type
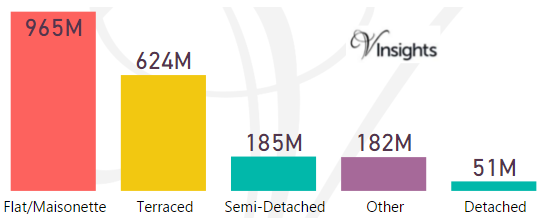
The total sales of £2 billions, split across the different property types are:
- Flat/Maisonette £965 millions (48.09%)
- Terraced £624 millions (31.08%)
- Semi-Detached £185 millions (9.21%)
- Other £182 millions (9.06%)
- Detached £51 millions (2.55%).
Year on Year Comparison : Compared to Lewisham Property Market 2015 in 2016
- All the property types have shown decline in sales except Flat/Maiosnette
- Flat/Maiosnette property sales has remained fairly constant
Lewisham Property Market at Postcode Level
| Postcode |
Coverage Area
|
Local Authority Area |
| BR1 |
Bromley, Bickley, Downham, Sundridge
|
Bromley, Lewisham |
| BR3 |
Beckenham, Elmers End, Shortlands, Eden Park, Park Langley
|
Bromley, Lewisham, Croydon |
| SE3 |
Blackheath, Kidbrooke, Westcombe Park
|
Greenwich, Lewisham |
| SE4 |
Brockley, Crofton Park
|
Lewisham, Southwark |
| SE6 |
Catford, Bellingham, Hither Green (part)
|
Lewisham |
| SE8 |
Deptford, Evelyn, Rotherhithe
|
Greenwich, Lewisham, Southwark |
| SE9 |
Eltham, Mottingham, New Eltham, Avery Hill (part), Falconwood (part), Sidcup (part), Chinbrook (part), Longlands (part) Kidbrooke (part), Shooter's Hill (part)
|
Bexley,Bromley, Greenwich, Lewisham
|
| SE10 |
Greenwich, Maze Hill, Greenwich Peninsula
|
Greenwich, Lewisham |
| SE12 |
Lee, Grove Park, Chinbrook, Hither Green (part), Eltham (part), Horn Park, Blackheath (part)
|
Greenwich, Lewisham |
| SE13 |
Lewisham, Hither Green, Ladywell
|
Greenwich, Lewisham |
| SE14 |
New Cross
|
Lewisham, Southwark |
| SE15 |
Peckham, Nunhead, South Bermondsey (part), Old Kent Road (part)
|
Lewisham, Southwark |
| SE16 |
Rotherhithe, Surrey Quays
|
Southwark, Lewisham |
| SE22 |
East Dulwich, Dulwich Village (part), Peckham Rye, Loughborough Junction, Herne Hill
|
Southwark, Lewisham |
| SE23 |
Forest Hill, Honor Oak, Crofton Park (part)
|
Lewisham, Southwark |
| SE26 |
Sydenham, Crystal Palace (part)
|
Bromley, Lewisham, Southwark, Bexley |
For property market details at post code level please click on Postcode in the table above.
Month-wise Break-up of Total Sales
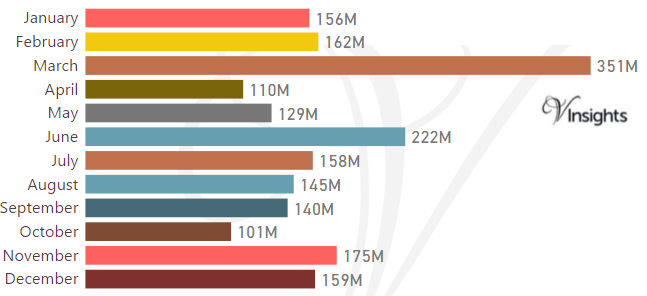
Stamp Duty Hike Impact
- March had property sale spike of £351 millions compared to £162 millions in Feb
- The impetus for it was to avoid the extra 3% in Stamp Duty Tax applicable on buying an additional home, being applicable from April 1 2016
Brexit Impact
- Brexit took place on 23rd June 2016.
- As can be observed from the month-wise break-up there does not seem to have been significant dip in property sales in the immediate aftermath of Brexit
- Year on Year the property market for Lewisham has shown decline of 12.51% over 2015
Total No Of Properties Sold By Property Type
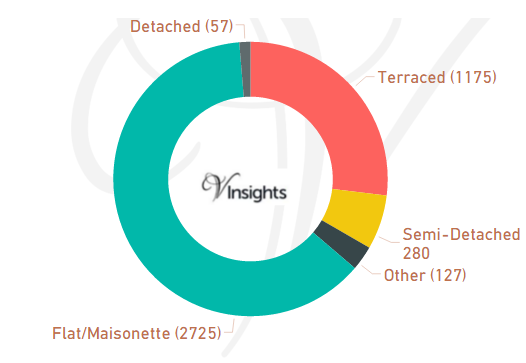
In Lewisham the total number of properties sold in year 2016 was 4364. The breakdown by different property types are:
- Terraced 1175 (26.92%)
- Semi-Detached 280 (6.42%)
- Other 127 (2.91%)
- Flat/Maisonette 2725 (62.44%)
- Detached 57 (1.31%).
Year on Year Comparison : Compared to Lewisham Property Market 2015 in 2016
- Total number of property sales in Lewisham has declined by 12.8 %
- All property types have shown decline in number of properties sold except property type Other
- Other has shown significant growth of 49.4% by number of sales
Average & Median Sales Price
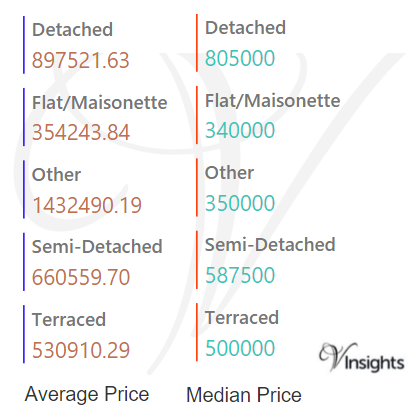
In 2016 the Average property price was £460 K in Lewisham. The average price for the different property types are:
- Detached £898 K
- Flat/Maisonette £354 K
- Other £1.43 millions
- Semi-Detached £661 K
- Terraced £531 K.
The Median Price was £383 K. The median property price for the different property types are:
- Detached £805 K
- Flat/Maisonette £340 K
- Other £350 K
- Semi-Detached £588 K
- Terraced £500 K
Year on Year Comparison : Compared to Lewisham Property Market 2015 in 2016
- The average and median sales price across all property types have gone up except for others
New Vs Not New Property Statistics
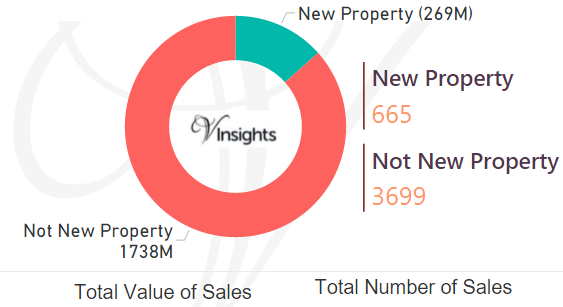
By Value Of Sales
- Not New Property contributed £1.74 billions (86.6%)
- New Property £269 millions (13.4%)
By Number Of Sales
- The number of Not New Property sold was 3699 (84.76%)
- The number of New Properties sold was 665 (15.24%)
Year on Year Comparison : Compared to Lewisham Property Market 2015 in 2016
- New property market share in property market has gone up in 2016 over 2015
All London Posts
97033717-294f-47d4-acaf-465871925e14|0|.0|27604f05-86ad-47ef-9e05-950bb762570c