Story Highlights
- Greenwich had total Property Sales of £1.9 billions in 2016.
- The total number of properties sold in year 2016 was 3910
- The Average property price was £478 K in Greenwich, while Median was £380 K
- Not New Property Contributed 75.6% by value and New Property 24.4%
- Stamp duty changes caused monthly spike
- Brexit and Stamp Duty changes has caused decline of 1.5% in total sales value compared to 2015
Greenwich is one of the Boroughs of East London. It had total Property Sales of £1.9 billions which was 11.38 % of East London Property Market 2016.
Total Sales By Property Type
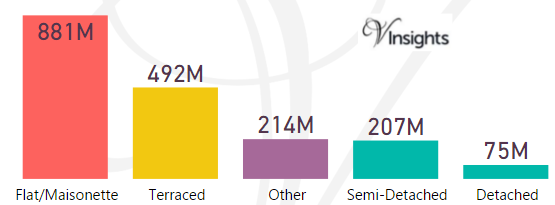
The split of £1.9 billions across the different property types are:
- Flat/Maisonette £881 millions (47.13%)
- Terraced £492 millions (26.35%)
- Other £214 millions (11.45%)
- Semi-Detached £207 millions (11.06%)
- Detached £75 millions (4.01%).
Year on Year Comparison : Compared to Greenwich Property Market 2015 in 2016
- All the property types have shown decline in sales except others.
- Others has shown growth of about 7% year on year
Greenwich Property Market at Postcode level
| Postcode |
Coverage Area
|
Local Authority Area |
| BR7 |
Chislehurst, Elmstead
|
Bromley, Greenwich |
| DA15 |
Sidcup (north), Blackfen, Lamorbey, Longlands
|
Bexley, Greenwich |
| DA16 |
Welling, Falconwood, East Wickham |
Bexley, Greenwich |
| SE2 |
Abbey Wood, West Heath, Crossness, Thamesmead (part), Plumstead (part)
|
Bexley, Greenwich |
| SE3 |
Blackheath, Kidbrooke, Westcombe Park
|
Greenwich, Lewisham |
| SE7 |
Charlton
|
Greenwich |
| SE8 |
Deptford, Evelyn, Rotherhithe
|
Greenwich, Lewisham, Southwark |
| SE9 |
Eltham, Mottingham, New Eltham, Avery Hill (part), Falconwood (part), Sidcup (part), Chinbrook (part), Longlands (part) Kidbrooke (part), Shooter's Hill (part)
|
Bexley, Bromley, Greenwich, Lewisham |
| SE10 |
Greenwich, Maze Hill, Greenwich Peninsula
|
Greenwich, Lewisham |
| SE12 |
Lee, Grove Park, Chinbrook, Hither Green (part), Eltham (part), Horn Park, Blackheath (part)
|
Greenwich, Lewisham |
| SE13 |
Lewisham, Hither Green, Ladywell
|
Greenwich, Lewisham |
| SE18 |
Woolwich, Royal Arsenal, Plumstead, Shooter's Hill
|
Bexley, Greenwich |
| SE28 |
Thamesmead
|
Bexley, Greenwich |
For property market details at post code level please click on Postcode in the table above.
Month-wise Break-up of Total Sales
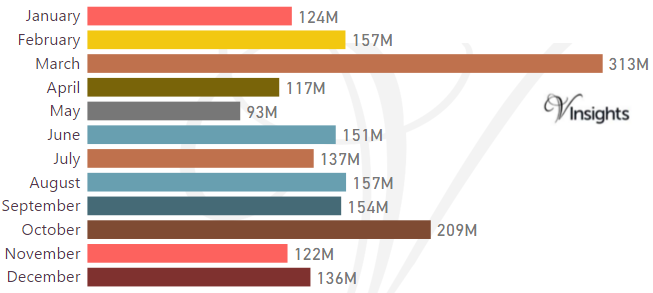
Stamp Duty Hike Impact
- March had property sale spike of £313 millions compared to £157 millions in Feb
- The impetus for it was to avoid the extra 3% in Stamp Duty Tax applicable on buying an additional home, being applicable from April 1 2016
Brexit Impact
- Brexit took place on 23rd June 2016.
- As can be observed from the month-wise break-up there does not seem to have been significant dip in property sales in the immediate aftermath of Brexit
- Year on Year the property market for Greenwich has shown a decline of 1.55%
Total No Of Properties Sold By Property Type
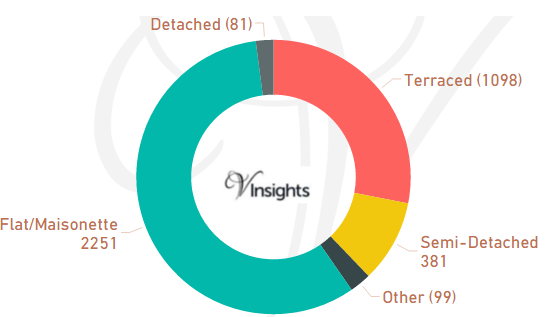
In Greenwich the total number of properties sold in year 2016 was 3910. The breakdown by different property types are:
- Terraced 1098(28.08%)
- Semi-Detached 381(9.74%)
- Other 99(2.53%)
- Flat/Maisonette 2251(57.57%)
- Detached 81(2.07%).
Year on Year Comparison : Compared to Greenwich Property Market 2015 in 2016
- Total number of property sales in Greenwich has declined by 12.47% year on year
- All property types have shown decline in number of properties sold except property type Other
- Other has shown significant increase of 66%.
Average & Median Sales Price
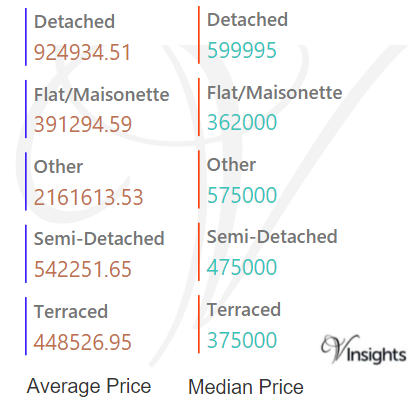
In 2015 the Average property price was £478 K in Greenwich. The average price for the different property types are:
- Detached £925 K
- Flat/Maisonette £391 K
- Other £2.16 millions
- Semi-Detached £542 K
- Terraced £449 K.
The Median Price was £380 K. The median property price for the different property types are:
- Detached £600 K
- Flat/Maisonette £362 K
- Other £575 K
- Semi-Detached £475 K
- Terraced £375 K.
Year on Year Comparison : Compared to Greenwich Property Market 2015 in 2016
- The average and median sales price across all property types have gone up except for Others, Detached
New Vs Not New Property Statistics
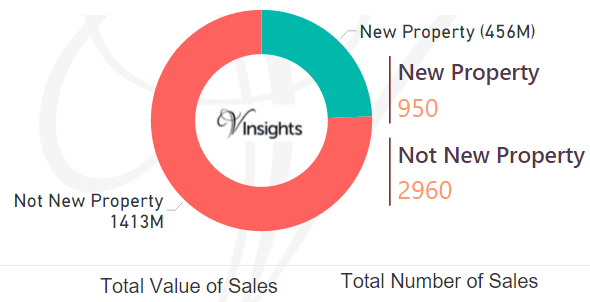
By Value Of Sales
- Not New Property Contributed £1.41 billion (75.6%)
- New Property £456 millions (24.4%)
By Number Of Sales
- The number of Not New Property sold was 2960 (75.7%)
- The number of New Properties sold was 950 (24.3%)
Year on Year Comparison : Compared to Greenwich Property Market 2015 in 2016
- New property market share in property market has gone up in 2016 over 2015
All London Posts
a4371ddc-7534-4e1f-812e-ef70ca14ce7b|0|.0|27604f05-86ad-47ef-9e05-950bb762570c