Story Highlights
- Haringey had total Property Sales of £1.68 billions in 2016
- The total number of properties sold in year 2016 was 2761.
- The Average property price was £607 K in Haringey, while Median was was £446 K.
- Not New Property Contributed 93.35% and New Property 6.65% by sales value.
- Stamp duty hike caused monthly spike in March.
- Brexit coupled with Stamp duty hike caused total sales to decline by 9% in 2016.
Haringey is one of the Boroughs of North London. It had total Property Sales of £1.68 billions which was 25.38% of North London Property Market 2016.
Total Sales By Property Type
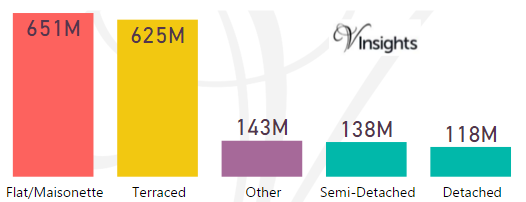
The split of £1.68 billions across the different property types are:
- Flat/Maisonette £651 millions (38.87%)
- Terraced £625 millions (37.29%)
- Other £143 millions (8.54%)
- Semi-Detached £138 millions (8.23%)
- Detached £118 millions (7.07%)
Year on Year Comparison : Compared to Haringey Property Market 2015 in 2016
- Haringey as a whole had property sales decrease of 9.2%
- All property types had decrease in total property sales compared to 2015
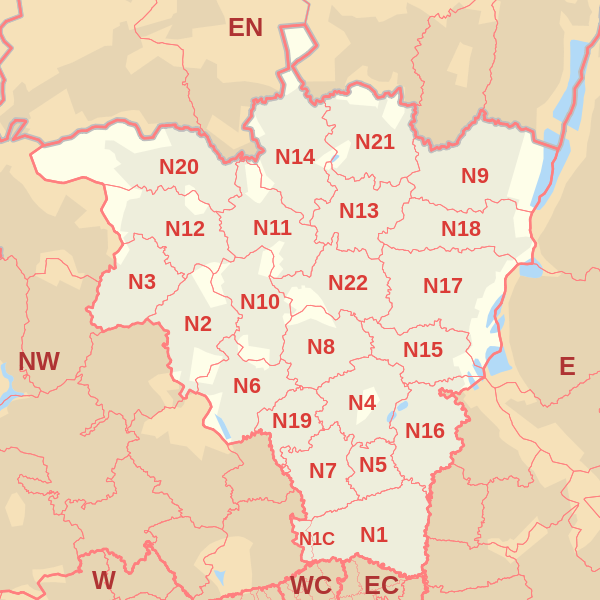
Haringey Property Market at Postcode level
 |
| Postcode |
Coverage Area
|
Local Authority Area |
| N2 |
East Finchley, Fortis Green, Hampstead Garden Suburb (part)
|
Barnet, Haringey |
| N4 |
Finsbury Park, Manor House, Harringay (part), Stroud Green (part)
|
Haringey, Islington, Hackney |
| N6 |
Highgate, Hampstead Heath (part)
|
Camden, Haringey, Islington |
| N8 |
Hornsey, Crouch End, Harringay (part)
|
Haringey, Islington |
| N10 |
Muswell Hill
|
Haringey, Barnet |
| N11 |
New Southgate, Friern Barnet, Bounds Green, Arnos Grove (part)
|
Enfield, Barnet, Haringey |
| N13 |
Palmers Green |
Enfield, Haringey |
| N15 |
South Tottenham, Harringay (part), West Green, Seven Sisters, Stamford Hill (part)
|
Hackney, Haringey |
| N17 |
Tottenham, Wood Green (part)
|
Haringey |
| N18 |
Upper Edmonton, Edmonton (part)
|
Enfield, Haringey |
| N22 |
Wood Green, Bounds Green (part), Bowes Park
|
Haringey, Enfield |
For property market details at post code level please click on Postcode in the table above.
Month-wise Break-up of Total Sales
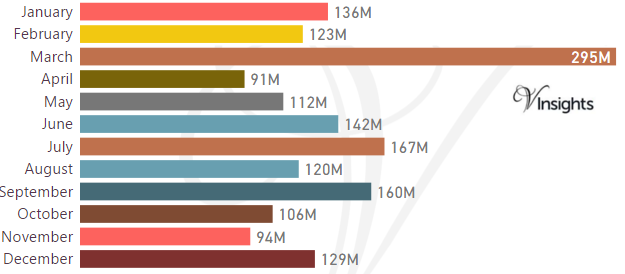
Stamp Duty Hike Impact
- March had property sale spike of £295 millions compared to £123 millions in Feb
- The impetus for it was to avoid the extra 3% in Stamp Duty Tax applicable on buying an additional home, being applicable from April 1 2016
Brexit Impact
- Brexit took place on 23rd June 2016.
- As can be observed from the month-wise break-up there does seem to have been some dip in property sales in the immediate aftermath of Brexit
- Year on Year property market for Haringey has shown a decline of 9.2% over 2015
Total No Of Properties Sold By Property Type
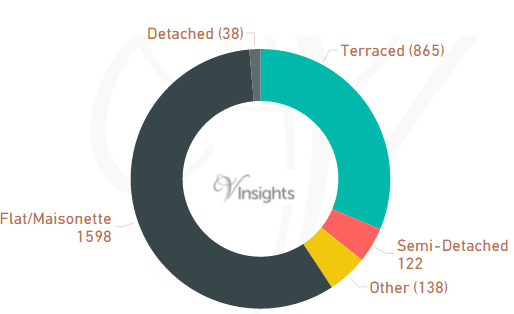
In Haringey the total number of properties sold in year 2016 was 2761. The breakdown by different property types are:
- Terraced 865 (31.33%)
- Semi-Detached 122 (4.42%)
- Other 138 (5%)
- Flat/Maisonette 1598 (57.88%)
- Detached 38 (1.38%)
Year on Year Comparison : Compared to Haringey Property Market 2015 in 2016
- Total number of property sales in Haringey has declined by 9.4%
- All property types have shown decline in number of properties sold except property type Other
- Other has shown significant growth of 70.4%
Average & Median Sales Price
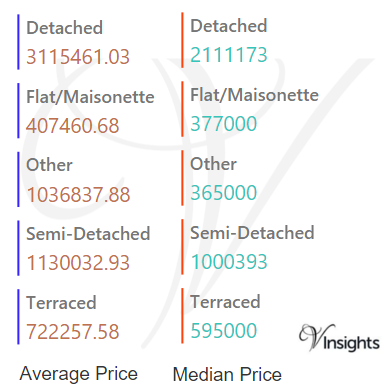
In 2016 the Average property price was £607 K in Haringey. The average price for the different property types are:
- Detached £3.12 millions
- Flat/Maisonette £408 K
- Other £1.04 millions
- Semi-Detached £1.13 millions
- Terraced £722 K
The Median Price was £446 K. The median property price for the different property types are:
- Detached £2.1 millions
- Flat/Maisonette £377 K
- Other £365 K
- Semi-Detached £1 millions
- Terraced £595 K
Year on Year Comparison : Compared to Haringey Property Market 2015
- The average and median sales price across all property types have gone up except for others
- Others have shown sharp decline in average and median sales price
New Vs Not New Property Statistics
By Value Of Sales
- Not New Property contributed £1.56 billion (93.35%)
- New Property £111 millions (6.65%)
By Number Of Sales
- The number of Not New Property sold was 2483 (89.93%)
- The number of New Property sold was 278 (10.07%)
Year on Year Comparison : Compared to Haringey Property Market 2015 in 2016
- New property market share in property market has gone up in 2016 over 2015
All London Posts
e761c576-2ee1-4a18-bda7-05a9a5aefb6e|0|.0|27604f05-86ad-47ef-9e05-950bb762570c
Story Highlights
- Enfield had total Property Sales of £1.67 billions in 2016
- The total number of properties sold in year 2016 was 3611
- The Average property price was £464 K in Enfield, while Median was £375 K
- Not New Property contributed 95.93% and New Property 4.07% by sales value
- Stamp duty hike caused monthly spike in March
- Brexit coupled with Stamp duty hike caused decline in total sales value of 5.6%
Enfiled is one of the Boroughs of North London. It had total Property Sales of £1.67 billions which was 25.36 % of North London Property Market 2016.
Total Sales By Property Type
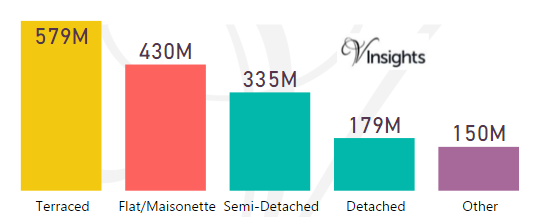
The split of £1.67 billions across the different property types are:
- Terraced £579 millions (34.6%)
- Flat/Maisonette £430 millions (25.71%)
- Semi-Detached £335 millions (20.03%)
- Detached £179 millions (10.72%)
- Other £150 millions (8.93%)
Year on Year Comparison : Compared to Enfield Property Market 2015 in 2016
- All the property types have shown decline in sales except Terraced
- Terraced properties have shown negligible growth of 0.34%
Enfield Property Market at Postcode level
| Postcode |
Coverage Area
|
Local Authority Area |
| EN1 |
Bush Hill Park; eastern parts of Bulls Cross, Enfield Town, Forty Hill, outskirts of Lower Edmonton
|
Enfield |
| EN2 |
Botany Bay, Clay Hill, Crews Hill; western parts of Bulls Cross, Enfield Chase, Enfield Town, Forty Hill, Gordon Hill
|
Enfield |
| EN3 |
Enfield Highway, Enfield Island Village, Enfield Lock, Enfield Wash, Ponders End
|
Enfield |
| EN4 |
Hadley Wood, Cockfosters, East Barnet, New Barnet
|
Barnet, Enfield |
| EN7 |
Cheshunt, Goffs Oak, Some parts of Enfield
|
Broxbourne, Enfield |
| EN8 |
Waltham Cross, Cheshunt, Some parts of Enfield
|
Broxbourne, Enfield |
| N9 |
Lower Edmonton, Edmonton (part)
|
Enfield |
| N11 |
New Southgate, Friern Barnet, Bounds Green, Arnos Grove (part)
|
Enfield, Barnet, Haringey |
| N13 |
Palmers Green
|
Enfield |
| N14 |
Southgate, Oakwood, Arnos Grove (part)
|
Enfield, Barnet |
| N18 |
Upper Edmonton, Edmonton (part)
|
Enfield |
| N21 |
Winchmore Hill, Bush Hill, Grange Park
|
Enfield |
| N22 |
Wood Green, Bounds Green (part), Bowes Park
|
Haringey, Enfield |
For property market details at post code level please click on Postcode in the table above.
Month-wise Break-up of Total Sales
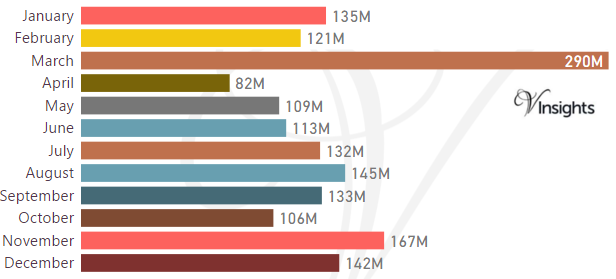
Stamp Duty Hike Impact
- March had property sale spike of £290 millions compared to £121 millions in Feb
- The impetus for it was to avoid the extra 3% in Stamp Duty Tax applicable on buying an additional home, being applicable from April 1 2016
Brexit Impact
- Brexit took place on 23rd June 2016.
- As can be observed from the month-wise break-up there does not seem to have been dip in property sales in the immediate aftermath of Brexit
- Year on Year the property market for Enfield has shown a decline of 5.65% over 2015
Total No Of Properties Sold By Property Type
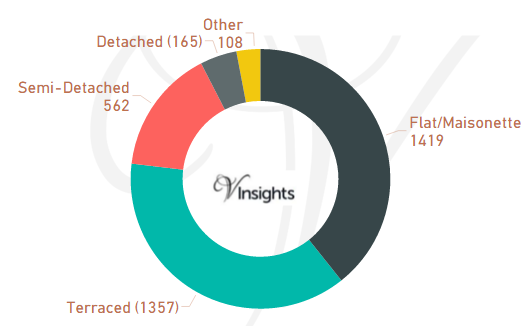
In Enfield the total number of properties sold in year 2016 was 3611. The breakdown by different property types are:
- Terraced 1357 (37.58%)
- Semi-Detached 562 (15.56%)
- Other 108 (2.99%)
- Flat/Maisonette 1419 (39.3%)
- Detached 165 (4.57%)
Year on Year Comparison : Compared to Enfield Property Market 2015 in 2016
- Total number of property sales in Enfield has declined by 13.38%
- All property types have shown decline in number of properties sold except property type Other, Detached
- Other has shown significant increase of 68.75%
Average & Median Sales Price
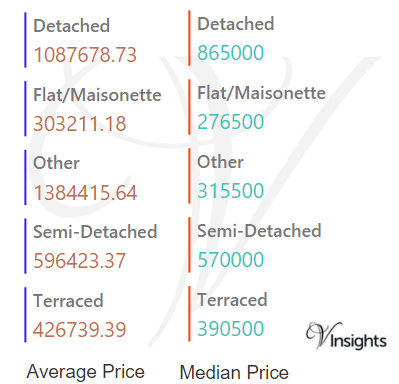
In 2016 the Average property price was £464 K in Enfield. The average price for the different property types are:
- Detached £1.1 millions
- Flat/Maisonette £303 K
- Other £1.38 millions
- Semi-Detached £596 K
- Terraced £427 K
The Median Price was £375 K. The median property price for the different property types are:
- Detached £865 K
- Flat/Maisonette £277 K
- Other £316 K
- Semi-Detached £570 K
- Terraced £391 K
Year on Year Comparison : Compared to Enfield Property Market 2015
- The average and median sales price across all property types have gone up except for others
- Other have shown sharp decline in average and median sales price
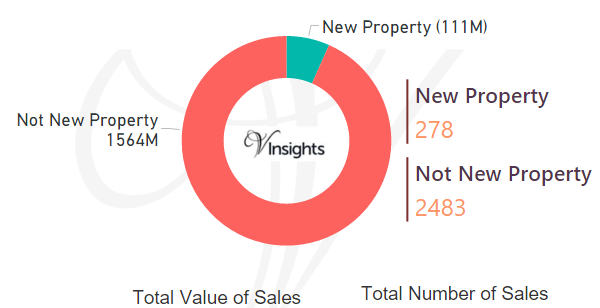
New Vs Not New Property Statistics
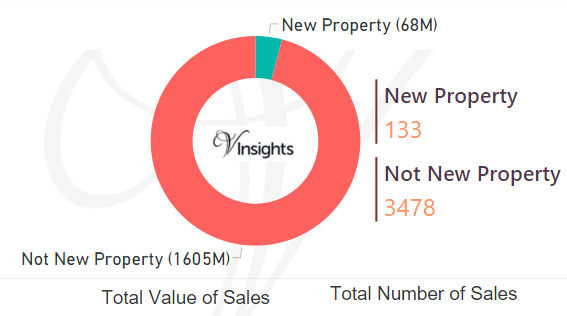
By Value Of Sales
- Not New Property contributed £1.61 billion (95.93%)
- New Property £68 millions (4.07%)
By Number Of Sales
- The number of Not New Property sold was 3478 (96.32%)
- The number of New Property sold was 133 (3.68%)
Year on Year Comparison : Compared to Enfield Property Market 2015 in 2016
- New property market share in property market has gone up in 2016 over 2015
All London Posts
dc8593ff-bfc9-4c3c-ae58-278dd7b37cf5|0|.0|27604f05-86ad-47ef-9e05-950bb762570c
Story Highlights
- Waverley had total property sales of £1.1 billions in 2016
- The total number of properties sold in 2016 was 2082
- The average sales price was £533 K, whereas the median was £425 K
- New Property sales were 5.3% by value, whereas Not New Property contributed 94.7%
- Stamp duty changes caused monthly spike in March
- Brexit coupled with Stamp Duty changes had negative impact and it declined by 8.2%
Waverley is one of the districts of Surrey.
Total Sales By Property Type
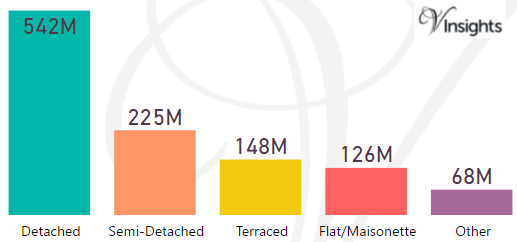
Waverley had total property sales of £1.1 billions which was 10.34% of the total Surrey Property Market 2016
The split of £1.1 billions across the different property types are:
- Detached £542 millions (48.86%)
- Semi-Detached £225 millions (20.31%)
- Terraced £148 millions (13.34%)
- Flat/Maisonette £126 millions (11.34%)
- Other £68 millions (6.15%)
Waverley Property Market at Postcode Level
| Postcode |
Coverage Area |
School |
Local Authority Area |
| GU5 |
Albury, Bramley, Shere |
Details |
Guildford, Waverley |
| GU6 |
Cranleigh, Ewhurst, Alfold |
Details |
Waverley |
| GU7 |
Farncombe, Godalming |
Details |
Waverley |
| GU8 |
Chiddingfold, Dunsfold, Elstead, Hascombe, Milford, Thursley, Witley |
Details |
Waverley |
| GU9 |
Farnham, Badshot Lea, Hale, Heath End |
Details |
Waverley |
| GU10 |
Bentley, Frensham, Churt, Crondall, Tongham, Ewshot, Seale, Tilford, Wrecclesham |
Details |
Waverley, East Hampshire, Guildford, Hart |
| GU26 |
Hindhead, Bramshott Chase, Grayshott |
Details |
Waverley |
| GU27 |
Haslemere, Fernhurst, Shottermill, Grayswood |
Details |
Waverley, Chichester |
Month-wise Break-up of Total Sales
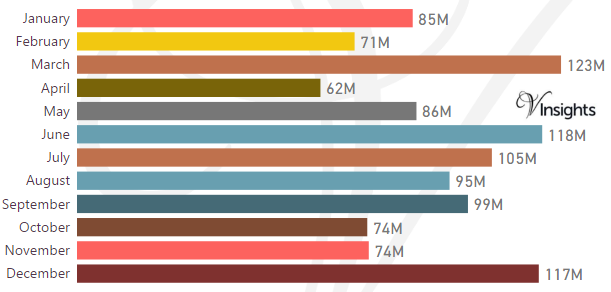
Some of the insights based on the £1.1 billions month-wise break-down :
Stamp Duty Hike Impact
- March had property sale spike of £123 millions compared to £71 millions in Feb and then sales sharply drop
- The impetus for it was to avoid the extra 3% in Stamp Duty Tax applicable on buying an additional home, being applicable from April 1 2016
Brexit Impact
- Brexit took place on 23rd June 2016.
- Year on Year decline has been 8.2% in 2016 over 2015
- Brexit coupled with Stamp Duty Hike had negative impact on Waverley Property Market in 2016
Total No Of Properties Sold By Property Type
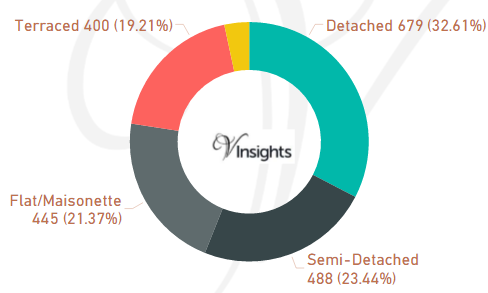
Waverley had total property sales of 2082. The split across the different property types are:
- Detached 679 (32.61%)
- Semi-Detached 488 (23.44%)
- Flat/Maisonette 445 (21.37%)
- Terraced 400 (19.21%)
- Other 70 (3.36%)
Average & Median Sales Price
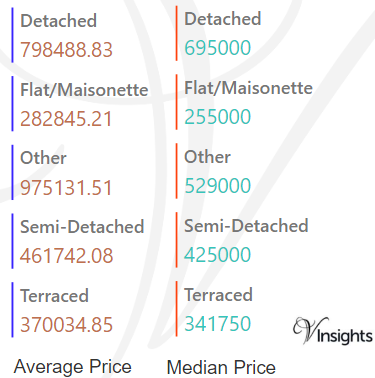
The average sales price in Waverley was £533 K and for different property types it was:
- Detached £798 K
- Semi-Detached £462 K
- Terraced £370 K
- Flat/Maisonette £283 K
- Other it is £ 975 K
Similarly median sales price in Waverley was £425 K and for different property types are:
- Detached £695 K
- Semi-Detached £425 K
- Terraced £342 K
- Flat/Maisonette £255 K
- Other it is £529 K
New Vs Not New Property Statistics
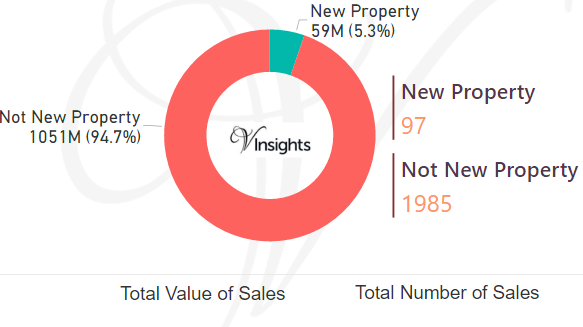
By Sales Value the split is as follows:
- New Property contributed £59 millions (5.3%)
- Not New Property contributed £1.1 billions (94.7%)
By Total Number the split is as follows:
- New properties sold were 97 (4.66%)
- Not new property sold were 1,985 (95.34%)
All Surrey Posts
65e97fb4-3f6c-40b5-bb54-12e88e1c41da|0|.0|27604f05-86ad-47ef-9e05-950bb762570c
Story Highlights
- Waltham Forest had total Property Sales of £1.46 billions in 2016
- The total number of properties sold in year 2016 was 3313
- The Average property price was £441 K while Median was £417 K
- Not New Property contributed 94.82% by value and New Property 5.18%
- Stamp duty changes caused monthly spike in March
- Brexit coupled with Stamp Duty changes have caused decline of 3.3% in 2016 over 2015
Waltham Forest is one of the Boroughs of East London. It had total Property Sales of £1.46 billions, which was 8.9% of East London Property Market 2016.
Total Sales By Property Type
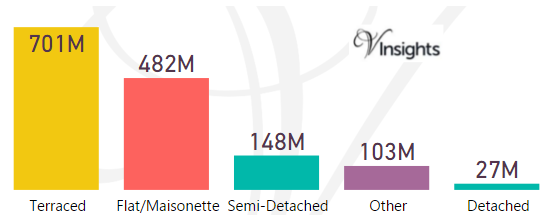
The split of £1.46 billions across the different property types are:
- Terraced £701 millions (47.99%)
- Flat/Maisonette £482 millions (32.98%)
- Semi Detached £148 millions (10.14%)
- Other £103 millions (7.06%)
- Detached £27 millions (1.83%)
Year on Year Comparison : Compared to Waltham Property Market 2015 in 2016
- All the property types have shown decline in sales except others.
- Others has shown growth of 19.76% year on year
Waltham Forest Property Market at Postcode level
| Postcode |
Coverage Area
|
Local Authority Area |
| E4 |
Chingford district: Chingford, Sewardstone, Highams Park, Upper Edmonton (part), Woodford Green (part)
|
Waltham Forest, Enfield, Epping Forest (Essex) |
| E5 |
Clapton district: Leyton (Part), Upper Clapton, Lower Clapton, Stoke Newington (part)
|
Hackney, Waltham Forest |
| E7 |
Forest Gate district: Forest Gate, Leytonstone (Part), Stratford (part)
|
Newham, Waltham Forest |
| E10 |
Leyton district: Leyton, Temple Mills, Hackney Marshes (part) Upper Clapton (part), Walthamstow Marshes
|
Waltham Forest, Hackney |
| E11 |
Leytonstone district: Leytonstone, Wanstead, Aldersbrook (part), Snaresbrook, Cann Hall
|
Waltham Forest, Redbridge |
| E15 |
Stratford district: Stratford, West Ham (part), Maryland, Leyton (part), Leytonstone (part) Temple Mills (part), Hackney Wick (part), Bow (part)
|
Newham, Waltham Forest, Hackney, TowerHamlets |
| E17 |
Walthamstow district: Walthamstow, Upper Walthamstow, Leyton (part)
|
Waltham Forest |
| IG8 |
Woodford Green, Woodford Bridge, Highams Park (part)
|
Redbridge, Waltham Forest |
For property market details at post code level please click on Postcode in the table above.
Month-wise Break-up of Total Sales
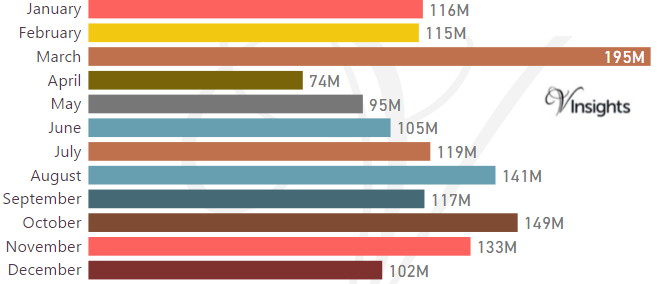
Stamp Duty Hike Impact
- March had property sale spike of £195 millions compared to £115 millions in Feb
- The impetus for it was to avoid the extra 3% in Stamp Duty Tax applicable on buying an additional home, being applicable from April 1 2016
Brexit Impact
- Brexit took place on 23rd June 2016.
- As can be observed from the month-wise break-up there does not seem to have been significant dip in property sales in the immediate aftermath of Brexit
- Year on Year the property market for Waltham Forest has shown decline of 3.3% over 2015
Total Number Of Sales By Property Types
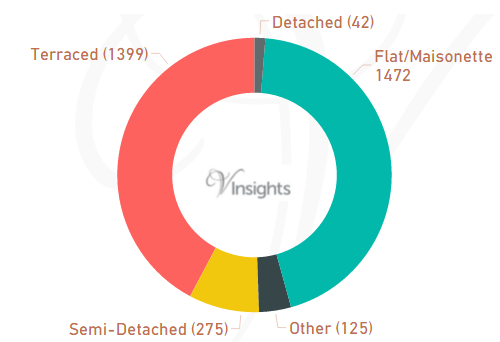
In Waltham Forest the total number of properties sold in year 2016 was 3313. The breakdown by different property types are:
- Terraced 1399 (42.23%)
- Semi Detached 275 (8.3%)
- Other 125 (3.77%)
- Flat/Maisonette 1472 (44.43%)
- Detached 42 (1.27%)
Year on Year Comparison : Compared to Waltham Property Market 2015 in 2016
- Total number of property sales in Waltham Forest has declined by 13.65% decline
- All property types have shown decline in number of properties sold except property type Other
- Other has shown significant increase of 155%.
Average & Median Sales Price
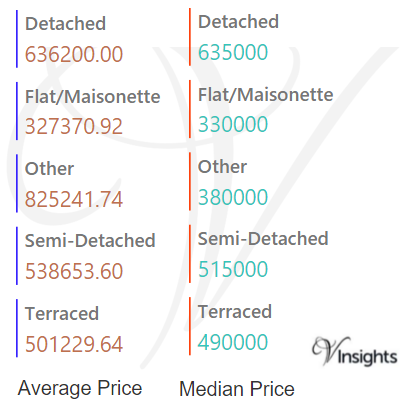
In 2016 the Average property price was £441 K in Waltham Forest. The average price for the different property types are:
- Detached £636 K
- Flat/Maisonette £327 K
- Other £825 K
- Semi-Detached £539 K
- Terraced £501 K.
The Median Price was £417 K. The median property price for the different property types are:
- Detached £635 K
- Flat/Maisonette £330 K
- Other £380 K
- Semi-Detached £515 K
- Terraced £490 K
Year on Year Comparison : Compared to Waltham Property Market 2015 in 2016
- The average and median sales price across all property types have gone up except for others
- Other have shown decline in average and median sales price making the property for business/commercial purpose cheaper
New Vs Not New Property Statistics
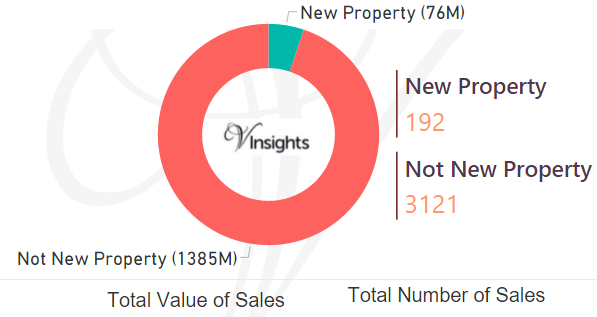
By Value Of Sales
- Not New Property contributed £1.39 (94.82%)
- New Property £76 millions (5.18%)
By Number Of Sales
- The number of Not New Property sold was 3121 (94.2%)
- The number of New Properties sold was 192 (5.8%)
Year on Year Comparison : Compared to Waltham Property Market 2015 in 2016
- New property market share in property market has remained fairly constant in 2016 over 2015
All London Posts
d4d89dfe-3f54-4cfb-80f9-701489e4ab51|0|.0|27604f05-86ad-47ef-9e05-950bb762570c
Story Highlights
- Havering had total Property Sales of £1.5 billions in 2016.
- The total number of properties sold in year 2016 was 4002.
- The Average property price was £376 K while Median was £330 K
- Not New Property Contributed 93.89% and New Property 6.11%
- Stamp duty changes caused monthly spike in March
- Brexit and Stamp Duty changes had no immediate impact, Havering Property Market Grows 6.4% 2016
Havering is one of the Boroughs of East London. It had total Property Sales of £1.5 billions which was 9.16% of East London Property Market 2016.
Total Sales By Property Type
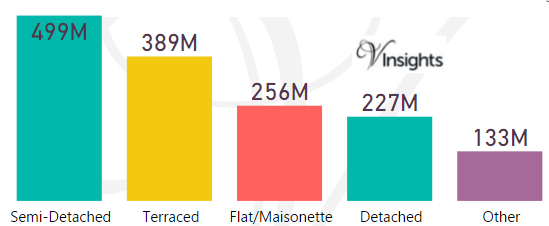
The split of £1.5 billions across the different property types are:
- Semi-Detached £499 millions (33.17%)
- Terraced £389 millions (25.85%)
- Flat/Maisonette £256 millions (17.04%)
- Detached £227 millions (15.07%)
- Other £133 millions (8.87%)
Year on Year Comparison : Compared to Havering Property Market 2015 in 2016
- All the property types have shown growth in sales except Semi-Detached, Detached
- Others has significant growth of 161%
Havering Property Market at Postcode level
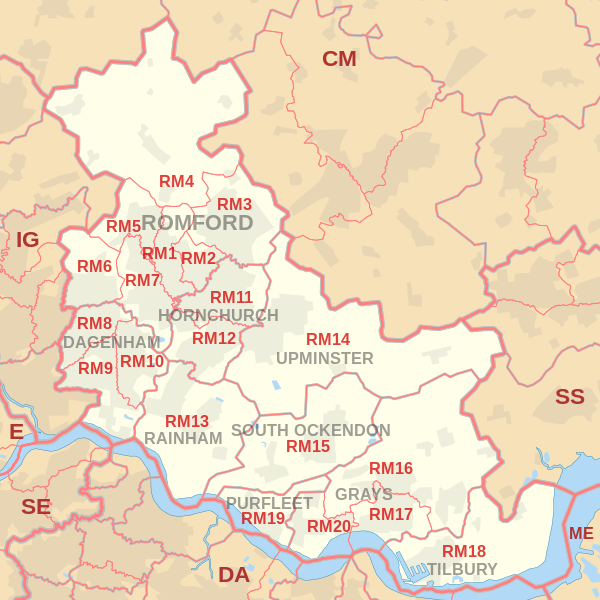 |
| Postcode |
Coverage Area
|
Local Authority Area |
| CM13 |
Brentwood, East Horndon, Great Warley, Herongate, Hutton, Ingrave, Little Warley, West Horndon
|
Basildon, Brentwood, Havering |
| RM1 |
Romford, Rise Park
|
Havering |
| RM2 |
Gidea Park, Heath Park
|
Havering |
| RM3 |
Harold Wood, Harold Hill, Noak Hill, Harold Park
|
Havering |
| RM4 |
Havering-atte-Bower, Abridge, Stapleford Abbotts, Noak Hill, Navestock, Stapleford Tawney, Stapleford Aerodrome
|
Havering, Epping Forest, Brentwood |
| RM5 |
Collier Row
|
Havering, Redbridge |
| RM6 |
Chadwell Heath, Marks Gate, Little Heath, Goodmayes (north), Hainault (South)
|
Barking and Dagenham, Redbridge, Havering |
| RM7 |
Rush Green, Mawneys, Romford
|
Havering, Barking and Dagenham |
| RM11 |
Hornchurch, Emerson Park, Ardleigh Green
|
Havering |
| RM12 |
Hornchurch, Elm Park
|
Havering |
| RM13 |
Rainham, South Hornchurch, Wennington
|
Havering |
| RM14 |
Upminster, Cranham, North Ockendon, Bulphan
|
Havering, Thurrock |
For property market details at post code level please click on Postcode in the table above.
Month-wise Break-up of Total Sales
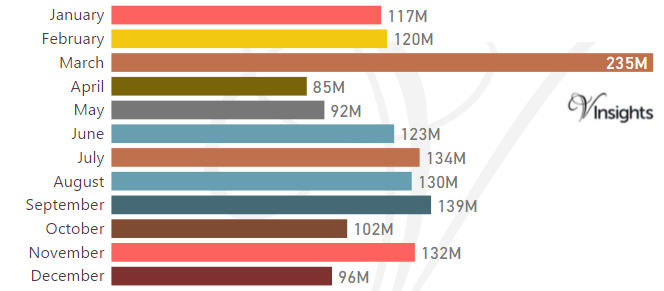
Stamp Duty Hike Impact
- March had property sale spike of £235 millions compared to £120 millions in Feb
- The impetus for it was to avoid the extra 3% in Stamp Duty Tax applicable on buying an additional home, being applicable from April 1 2016
Brexit Impact
- Brexit took place on 23rd June 2016.
- As can be observed from the month-wise break-up there does not seem to have been dip in property sales in the immediate aftermath of Brexit
- Year on Year the property market for Havering has shown growth of 6.4% year on year over 2015
Total No Of Properties Sold By Property Type
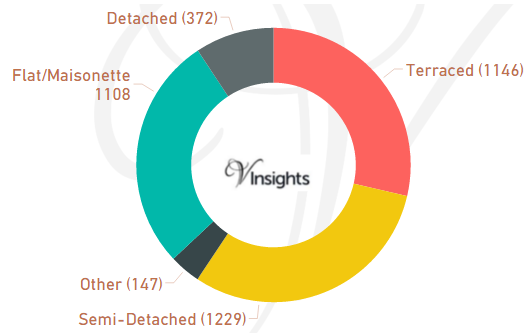
In Havering the total number of properties sold in year 2016 was 4002. The breakdown by different property types are:
- Terraced 1146 (28.64%)
- Semi-Detached 1229 (30.71%)
- Other 147 (3.67%)
- Flat/Maisonette 1108 (27.69%)
- Detached 372 (9.3%).
Year on Year Comparison : Compared to Havering Property Market 2015 in 2016
- Total number of property sales in Havering has declined by 10.35%
- All property types have shown decline in number of properties sold except property type Other
- Other has shown significant growth by 177%.
Average & Median Sales Price
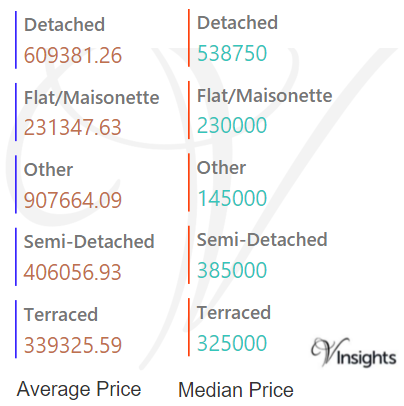
In 2016 the Average property price was £376 K in Havering. The average price for the different property types are:
- Detached £609 K
- Flat/Maisonette £231 K
- Other £907 K
- Semi-Detached £406 K
- Terraced £339 K
The Median Price was £330 K. The median property price for the different property types are:
- Detached £539 K
- Flat/Maisonette £230 K
- Other £145 K
- Semi-Detached £385 K
- Terraced £325 K
Year on Year Comparison : Compared to Havering Property Market 2015 in 2016
- The average and median sales price across all property types have gone up except for others
- Median Price for Others has shown a sharp decline
New Vs Not New Property Statistics
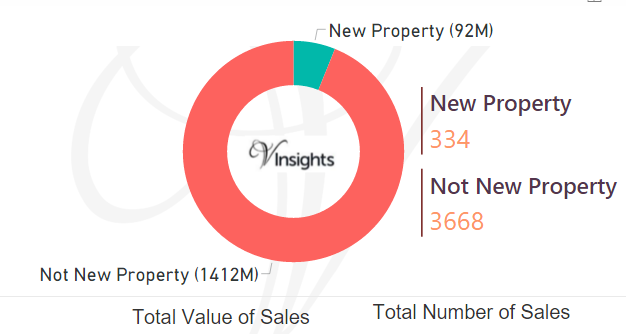
By Value Of Sales
- Not New Property £1.4 billion (93.89%)
- New Property £92 millions (6.11%)
By Number Of Sales
- The number of Not New Property sold was 3668 (91.65%)
- The number of New Properties sold was 334 (8.35%)
Year on Year Comparison : Compared to Havering Property Market 2015 in 2016
- New property market share in property market has gone down in 2016 over 2015
All London Posts
ce7d7090-c340-4508-8e1c-7e68ee80ad09|0|.0|27604f05-86ad-47ef-9e05-950bb762570c