Story Highlights
- Tower Hamlets had total Property Sales of £2.9 billions in 2016
- The total number of properties sold in year 2016 was 4821
- The Average property price was £601 K while Median was £460 K
- Not New Property contributed 65.63% by value and New Property 34.37%
- Stamp duty hike caused monthly spike in March
- Brexit and Stamp Duty hike did not have negative impact, there was growth of 11.5% by Total Sales Value
Tower Hamlets is one of the Boroughs of East London. It had total Property Sales of £2.9 billions which was 17.65% of East London Property Market 2016.
Total Sales By Property Type
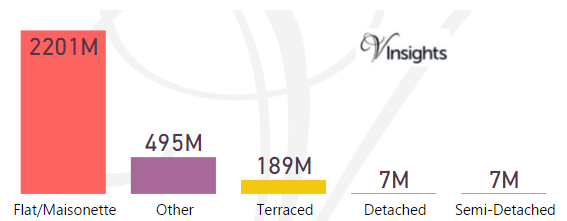
The split of £2.9 billions across the different property types are:
- Flat/Maisonette £2.2 billions (75.96%)
- Other £495 millions (17.08%)
- Terraced £189 millions (6.51%)
- Detached £7 millions
- Semi-Detached 7 millions
Year on Year Comparison : Compared to Tower Hamlets Property Market 2015 in 2016
- Flat/Maisonette ,Other have shown growth of 17.65%, 12% respectively
Tower Hamlets Property Market at Postcode Level
| Postcode |
Coverage Area
|
Local Authority Area |
| E1 |
Eastern head district: Aldgate (part), Bishopsgate (part), Whitechapel, Shoreditch (part), Spitalfields, Shadwell, Stepney, Globe Town (part), Mile End (part), Portsoken, Brick Lane
|
Tower Hamlets, Hackney, City of London |
| E1W |
Wapping
|
Tower Hamlets |
| E2 |
Bethnal Green district: Bethnal Green, Haggerston, Hoxton, Shoreditch (part), Cambridge Heath, Globe Town (part)
|
Tower Hamlets, Hackney |
| E3 |
Bow district: Bow, Bromley-by-Bow, Old Ford, Mile End, Fish Island, Bow Common, Poplar (part) Limehouse (part) Three Mills, London Gas Museum
|
Tower Hamlets, Newham |
| E9 |
Homerton district: Homerton, Hackney Wick, South Hackney, Hackney Marshes, Victoria Park
|
Hackney, Tower Hamlets |
| E14 |
Poplar district: Poplar, Isle of Dogs, Limehouse, Canary Wharf, Millwall, Blackwall, Cubitt Town, South Bromley, North Greenwich, Leamouth
|
Tower Hamlets |
For property market details at post code level please click on Postcode in the table above.
Month-wise Break-up of Total Sales
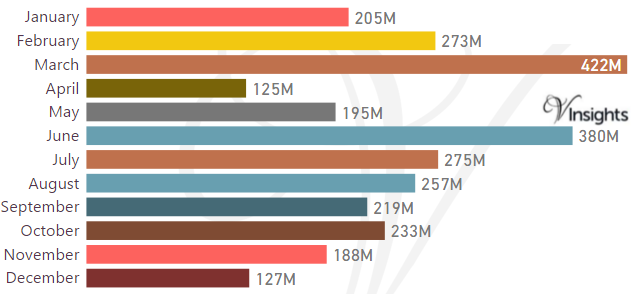
Stamp Duty Hike Impact
- March had property sale spike of £422 millions compared to £273 millions in Feb
- The impetus for it was to avoid the extra 3% in Stamp Duty Tax applicable on buying an additional home, being applicable from April 1 2016
Brexit Impact
- Brexit took place on 23rd June 2016.
- As can be observed from the month-wise break-up there does not seem to have been significant dip in property sales in the immediate aftermath of Brexit
- Year on Year the property market for Tower Hamles has shown growth of 11.54% over 2015
Total No Of Properties Sold By Property Type
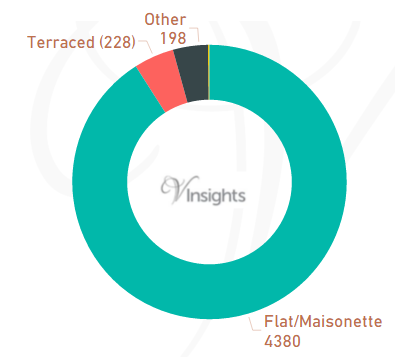
In Tower Hamlets the total number of properties sold in year 2016 was 4821. The breakdown by different property types are:
- Terraced 228 (4.73%)
- Other 198 (4.11%)
- Flat/Maisonette 4380 (90.85%)
- Semi-Detached 9 (0.19%).
Year on Year Comparison : Compared to Tower Hamlets Property Market 2015 in 2016
- Total number of property sales in Tower Hamlets has shown growth of 4.9%
- Other has shown significant increase of 50%.
Average & Median Sales Price
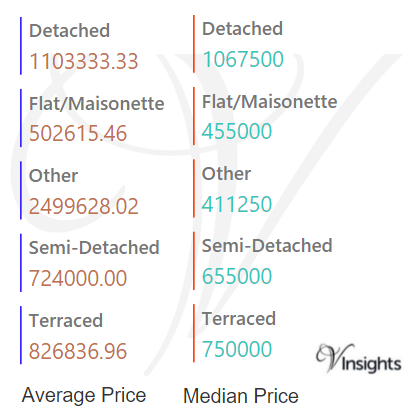
In 2016 the Average property price was £601 K in Tower Hamlets. The average price for the different property types are:
- Detached £1.1 millions
- Flat/Maisonette £503 K
- Other £2.5 millions
- Semi-Detached £724 K
- Terraced £827 K
The Median Price was £460 K. The median price for the different property types are:
- Detached £1.07 millions
- Flat/Maisonette £455 K
- Other £411 K
- Semi-Detached £655 K
- Terraced £750 K
Year on Year Comparison : Compared to Tower Hamlets Property Market 2015 in 2016
- The average and median sales price across all property types have gone up except for Other
- So property prices for business and commercial purpose has shown decline
New Vs Not New Property Statistics
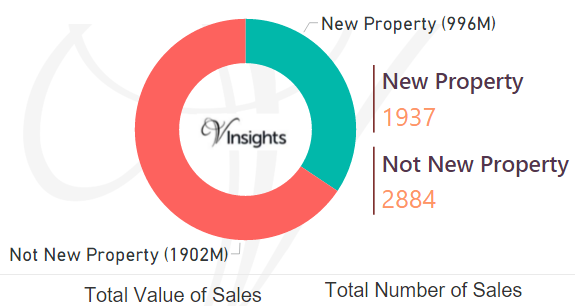
By Value Of Sales
- Not New Property contributed £1.9 billion (65.63%)
- New Property £996 millions (34.37%)
By Number Of Sales
- The number of Not New Property sold was 2884 (59.82%)
- The number of New Properties sold was 1937 (40/18%)
Year on Year Comparison : Compared to Tower Hamlets Property Market 2015 in 2016
- New property market share in property market has gone up significantly in 2016 over 2015
All London Posts
5bcde5f8-f5d2-4290-8f83-d5a99454c4b6|0|.0|27604f05-86ad-47ef-9e05-950bb762570c