
Story Highlights
- North London had total property sales of approx. £6.6 billions in 2016
- The maximum sales at borough level was in Barnet at £3.25 billions
- The total number of North London properties sold in 2016 was 11,760
- The average sales price in North London was £561 K, whereas median was £425 K
- By borough the average price was maximum in Haringey at £607 K
- New Property sales were 11.24% by value, whereas Not New Property contributed 88.76%
- Stamp duty changes caused monthly spike in March
- Brexit coupled with Stamp Duty changes caused total sales to decline by 5.7%
North London is the northern part of London. It comprises of Barnet, Enfield, Haringey
Total Sales By Borough
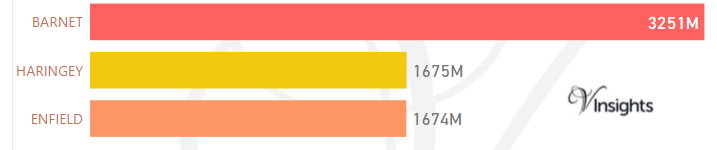
The total sales of £6.6 billions in 2016 was split across its borough as above. It is 8.68% of London Property Market 2016
Year on Year Comparison : Compared to North London Property Market 2015 in 2016
Total Value of Sales By Property Types
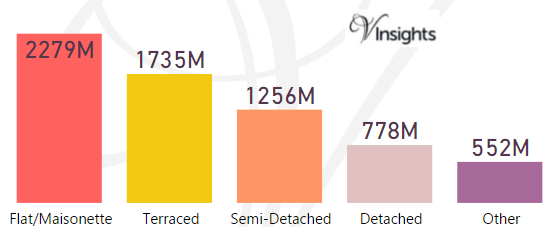
North London in 2016 had total property sales of £6.6 billions.The split across the different property types are:
- Detached £778 millions (11.79%)
- Semi-Detached £1.26 billions (19.03%)
- Terraced £ 1.74 billions (26.29%)
- Other £552 million (8.37%)
- Flat/Maisonette £2.28 billions (34.52%)
Year on Year Comparison : Compared to North London Property Market 2015 in 2016
- All the property types have shown decline in sales except Flat/Maisonette
- Flat/Maisonette has show very modest growth of 1.3% from £2.25 billions in 2015 to £2.28 billions in 2016
Month-wise Break-up of Total Sales
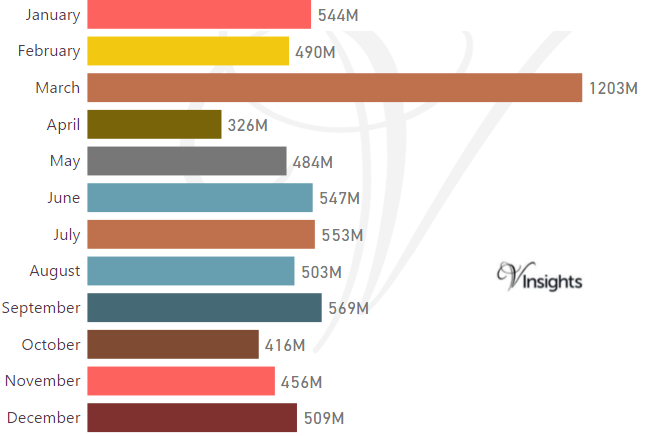
Stamp Duty Hike Impact
- March had property sale spike of £ 1.20 billions compared to £ 490 millions in Feb
- The impetus for it was to avoid the extra 3% in Stamp Duty Tax applicable on buying an additional home, being applicable from April 1 2016
Brexit Impact
- Brexit took place on 23rd June 2016.
- As can be observed from the month-wise break-up there does not seem to have been dip in property sales in the immediate aftermath of Brexit
- Year on Year the property market for North London has shown a decline of 5.71% over 2015
Total Number Of Sales By Property Types
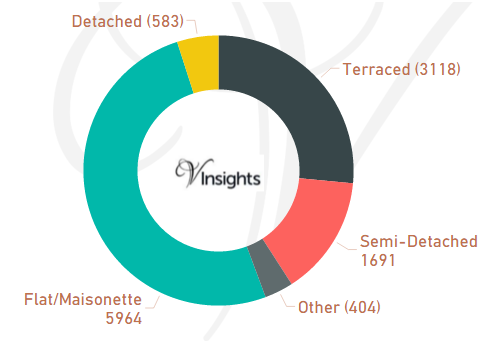
The total number of property sold in North London 2016 was 11,760. It is split as:
- Detached 583 (4.96%)
- Semi-Detached 1,691 (%)
- Terraced 3,118 (26.51%)
- Flat/Maisonette 5,964 (50.71%)
- Other 404 (3.44%)
Year on Year Comparison : Compared to North London Property Market 2015 in 2016
- Total number of property sales in North London has decreased by 1,065 which is 8.3% decline
- All property types have shown decline in number of properties sold except property type Other
- Other has shown significant increase of 69% from 239 in 2015 to 404 in 2016.
Average & Median Sales Price
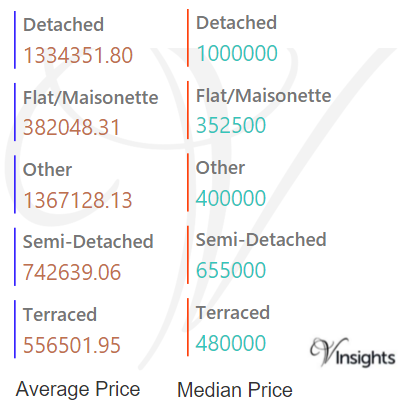
The average sales price in North London was £561 K. For the different property types it was:
- Detached: £1.33 millions
- Semi-Detached: £743 K
- Terraced: £557 K
- Flat/Maisonette: £382 K
- Other it is £1.37 millions.
Similarly the median sales price in North London was £425 K. For the different property types it was:
- Detached: £1 millions
- Semi-Detached: £655 K
- Terraced: £480 K
- Flat/Maisonette: £353 K
- Other it is £400 K
Year on Year Comparison : Compared to North London Property Market 2015
- The average and median sales price across all property types have gone up except for others
Average & Median Sales Price By Borough
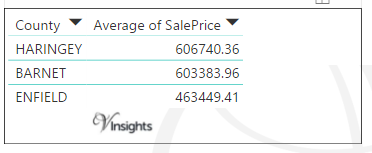
In North London the average of Sales Price is as above.
- The highest average sales prices is in Haringey at £607 K
- Barnet at £603 K,
- Enfield being minimum at £463 K
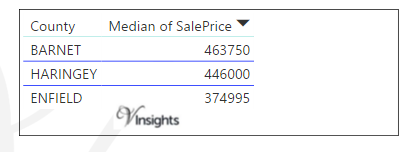
In North London the median of sales price is as above.
- The median sales prices was maximum in Barnet at £464 K
- Haringey at £446 K
- Enfield being minimum at £375 K
Year on Year Comparison : Compared to North London Property Market 2015 in 2016
- The average and median sales price across all the North London boroughs have gone up with Haringey leading the pack in average sales price and Barnet in median sales price.
New Vs Not New Property Statistics
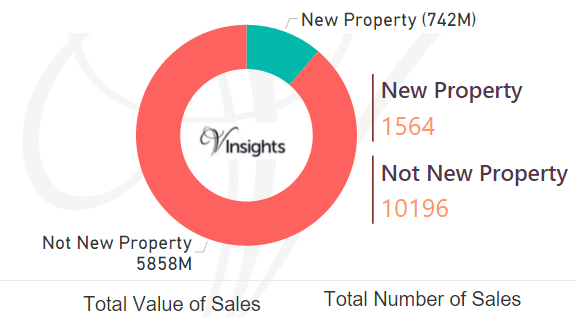
By Value Of Sales
- The sales value contributed by New Property was £742 millions (11.24%)
- Not New Property contributed £5.9 billions (88.76%).
By Number Of Sales
- New properties sold were 1,564 (13.3%)
- Not new property sold were 10,196 (86.7%)
Year on Year Comparison : Compared to North London Property Market 2015 in 2016
- New property market share in property market has gone up in 2016 over 2015
All London Posts 
eb90aa3e-5032-44c3-8819-705b373238c5|0|.0|27604f05-86ad-47ef-9e05-950bb762570c
Story Highlights
- Haringey had total Property Sales of £1.68 billions in 2016
- The total number of properties sold in year 2016 was 2761.
- The Average property price was £607 K in Haringey, while Median was was £446 K.
- Not New Property Contributed 93.35% and New Property 6.65% by sales value.
- Stamp duty hike caused monthly spike in March.
- Brexit coupled with Stamp duty hike caused total sales to decline by 9% in 2016.
Haringey is one of the Boroughs of North London. It had total Property Sales of £1.68 billions which was 25.38% of North London Property Market 2016.
Total Sales By Property Type
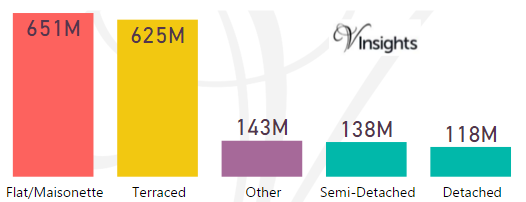
The split of £1.68 billions across the different property types are:
- Flat/Maisonette £651 millions (38.87%)
- Terraced £625 millions (37.29%)
- Other £143 millions (8.54%)
- Semi-Detached £138 millions (8.23%)
- Detached £118 millions (7.07%)
Year on Year Comparison : Compared to Haringey Property Market 2015 in 2016
- Haringey as a whole had property sales decrease of 9.2%
- All property types had decrease in total property sales compared to 2015
Haringey Property Market at Postcode level
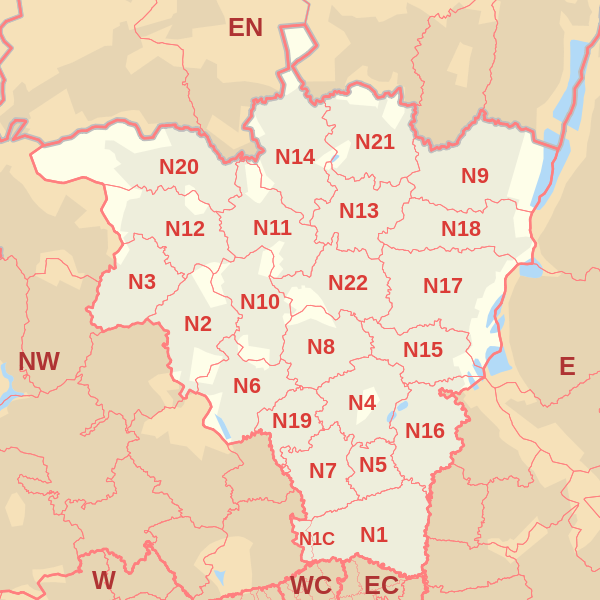 |
| Postcode |
Coverage Area
|
Local Authority Area |
| N2 |
East Finchley, Fortis Green, Hampstead Garden Suburb (part)
|
Barnet, Haringey |
| N4 |
Finsbury Park, Manor House, Harringay (part), Stroud Green (part)
|
Haringey, Islington, Hackney |
| N6 |
Highgate, Hampstead Heath (part)
|
Camden, Haringey, Islington |
| N8 |
Hornsey, Crouch End, Harringay (part)
|
Haringey, Islington |
| N10 |
Muswell Hill
|
Haringey, Barnet |
| N11 |
New Southgate, Friern Barnet, Bounds Green, Arnos Grove (part)
|
Enfield, Barnet, Haringey |
| N13 |
Palmers Green |
Enfield, Haringey |
| N15 |
South Tottenham, Harringay (part), West Green, Seven Sisters, Stamford Hill (part)
|
Hackney, Haringey |
| N17 |
Tottenham, Wood Green (part)
|
Haringey |
| N18 |
Upper Edmonton, Edmonton (part)
|
Enfield, Haringey |
| N22 |
Wood Green, Bounds Green (part), Bowes Park
|
Haringey, Enfield |
For property market details at post code level please click on Postcode in the table above.
Month-wise Break-up of Total Sales
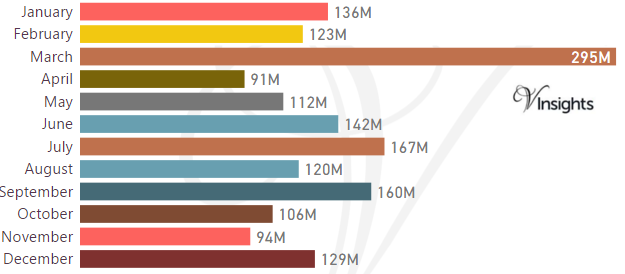
Stamp Duty Hike Impact
- March had property sale spike of £295 millions compared to £123 millions in Feb
- The impetus for it was to avoid the extra 3% in Stamp Duty Tax applicable on buying an additional home, being applicable from April 1 2016
Brexit Impact
- Brexit took place on 23rd June 2016.
- As can be observed from the month-wise break-up there does seem to have been some dip in property sales in the immediate aftermath of Brexit
- Year on Year property market for Haringey has shown a decline of 9.2% over 2015
Total No Of Properties Sold By Property Type
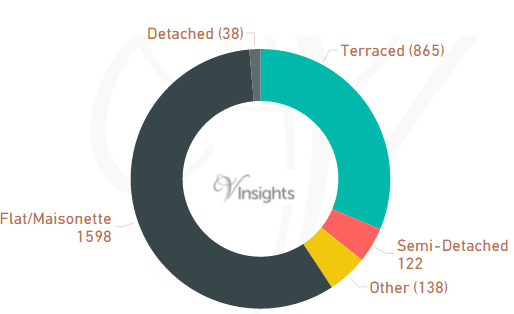
In Haringey the total number of properties sold in year 2016 was 2761. The breakdown by different property types are:
- Terraced 865 (31.33%)
- Semi-Detached 122 (4.42%)
- Other 138 (5%)
- Flat/Maisonette 1598 (57.88%)
- Detached 38 (1.38%)
Year on Year Comparison : Compared to Haringey Property Market 2015 in 2016
- Total number of property sales in Haringey has declined by 9.4%
- All property types have shown decline in number of properties sold except property type Other
- Other has shown significant growth of 70.4%
Average & Median Sales Price
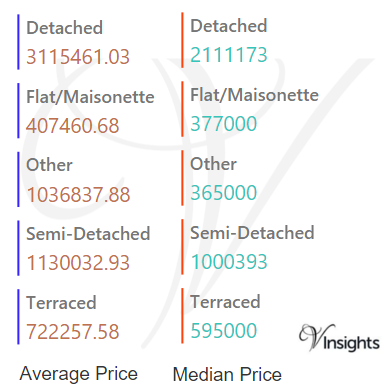
In 2016 the Average property price was £607 K in Haringey. The average price for the different property types are:
- Detached £3.12 millions
- Flat/Maisonette £408 K
- Other £1.04 millions
- Semi-Detached £1.13 millions
- Terraced £722 K
The Median Price was £446 K. The median property price for the different property types are:
- Detached £2.1 millions
- Flat/Maisonette £377 K
- Other £365 K
- Semi-Detached £1 millions
- Terraced £595 K
Year on Year Comparison : Compared to Haringey Property Market 2015
- The average and median sales price across all property types have gone up except for others
- Others have shown sharp decline in average and median sales price
New Vs Not New Property Statistics
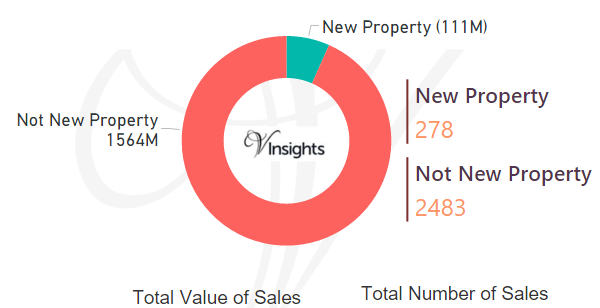
By Value Of Sales
- Not New Property contributed £1.56 billion (93.35%)
- New Property £111 millions (6.65%)
By Number Of Sales
- The number of Not New Property sold was 2483 (89.93%)
- The number of New Property sold was 278 (10.07%)
Year on Year Comparison : Compared to Haringey Property Market 2015 in 2016
- New property market share in property market has gone up in 2016 over 2015
All London Posts
e761c576-2ee1-4a18-bda7-05a9a5aefb6e|0|.0|27604f05-86ad-47ef-9e05-950bb762570c
Story Highlights
- Enfield had total Property Sales of £1.67 billions in 2016
- The total number of properties sold in year 2016 was 3611
- The Average property price was £464 K in Enfield, while Median was £375 K
- Not New Property contributed 95.93% and New Property 4.07% by sales value
- Stamp duty hike caused monthly spike in March
- Brexit coupled with Stamp duty hike caused decline in total sales value of 5.6%
Enfiled is one of the Boroughs of North London. It had total Property Sales of £1.67 billions which was 25.36 % of North London Property Market 2016.
Total Sales By Property Type
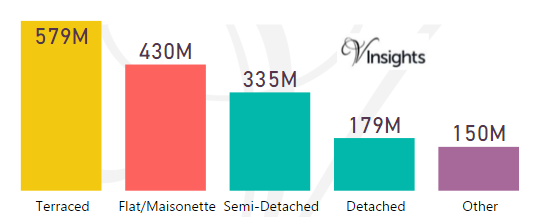
The split of £1.67 billions across the different property types are:
- Terraced £579 millions (34.6%)
- Flat/Maisonette £430 millions (25.71%)
- Semi-Detached £335 millions (20.03%)
- Detached £179 millions (10.72%)
- Other £150 millions (8.93%)
Year on Year Comparison : Compared to Enfield Property Market 2015 in 2016
- All the property types have shown decline in sales except Terraced
- Terraced properties have shown negligible growth of 0.34%
Enfield Property Market at Postcode level
| Postcode |
Coverage Area
|
Local Authority Area |
| EN1 |
Bush Hill Park; eastern parts of Bulls Cross, Enfield Town, Forty Hill, outskirts of Lower Edmonton
|
Enfield |
| EN2 |
Botany Bay, Clay Hill, Crews Hill; western parts of Bulls Cross, Enfield Chase, Enfield Town, Forty Hill, Gordon Hill
|
Enfield |
| EN3 |
Enfield Highway, Enfield Island Village, Enfield Lock, Enfield Wash, Ponders End
|
Enfield |
| EN4 |
Hadley Wood, Cockfosters, East Barnet, New Barnet
|
Barnet, Enfield |
| EN7 |
Cheshunt, Goffs Oak, Some parts of Enfield
|
Broxbourne, Enfield |
| EN8 |
Waltham Cross, Cheshunt, Some parts of Enfield
|
Broxbourne, Enfield |
| N9 |
Lower Edmonton, Edmonton (part)
|
Enfield |
| N11 |
New Southgate, Friern Barnet, Bounds Green, Arnos Grove (part)
|
Enfield, Barnet, Haringey |
| N13 |
Palmers Green
|
Enfield |
| N14 |
Southgate, Oakwood, Arnos Grove (part)
|
Enfield, Barnet |
| N18 |
Upper Edmonton, Edmonton (part)
|
Enfield |
| N21 |
Winchmore Hill, Bush Hill, Grange Park
|
Enfield |
| N22 |
Wood Green, Bounds Green (part), Bowes Park
|
Haringey, Enfield |
For property market details at post code level please click on Postcode in the table above.
Month-wise Break-up of Total Sales
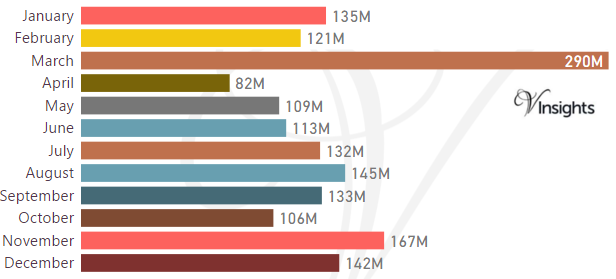
Stamp Duty Hike Impact
- March had property sale spike of £290 millions compared to £121 millions in Feb
- The impetus for it was to avoid the extra 3% in Stamp Duty Tax applicable on buying an additional home, being applicable from April 1 2016
Brexit Impact
- Brexit took place on 23rd June 2016.
- As can be observed from the month-wise break-up there does not seem to have been dip in property sales in the immediate aftermath of Brexit
- Year on Year the property market for Enfield has shown a decline of 5.65% over 2015
Total No Of Properties Sold By Property Type
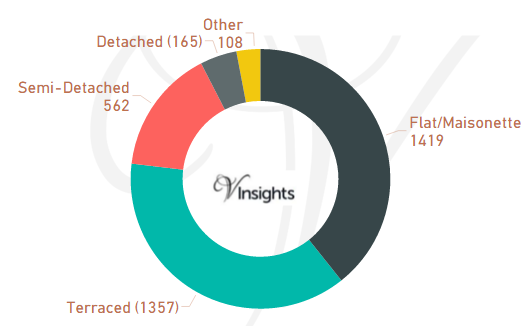
In Enfield the total number of properties sold in year 2016 was 3611. The breakdown by different property types are:
- Terraced 1357 (37.58%)
- Semi-Detached 562 (15.56%)
- Other 108 (2.99%)
- Flat/Maisonette 1419 (39.3%)
- Detached 165 (4.57%)
Year on Year Comparison : Compared to Enfield Property Market 2015 in 2016
- Total number of property sales in Enfield has declined by 13.38%
- All property types have shown decline in number of properties sold except property type Other, Detached
- Other has shown significant increase of 68.75%
Average & Median Sales Price
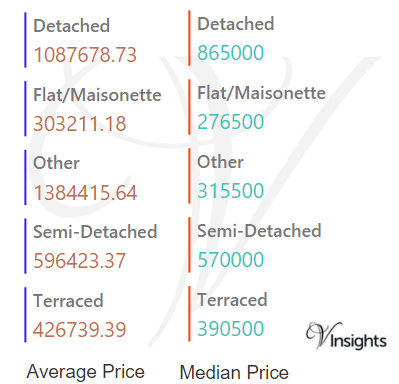
In 2016 the Average property price was £464 K in Enfield. The average price for the different property types are:
- Detached £1.1 millions
- Flat/Maisonette £303 K
- Other £1.38 millions
- Semi-Detached £596 K
- Terraced £427 K
The Median Price was £375 K. The median property price for the different property types are:
- Detached £865 K
- Flat/Maisonette £277 K
- Other £316 K
- Semi-Detached £570 K
- Terraced £391 K
Year on Year Comparison : Compared to Enfield Property Market 2015
- The average and median sales price across all property types have gone up except for others
- Other have shown sharp decline in average and median sales price
New Vs Not New Property Statistics
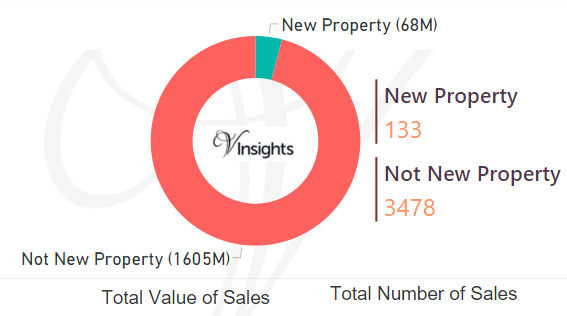
By Value Of Sales
- Not New Property contributed £1.61 billion (95.93%)
- New Property £68 millions (4.07%)
By Number Of Sales
- The number of Not New Property sold was 3478 (96.32%)
- The number of New Property sold was 133 (3.68%)
Year on Year Comparison : Compared to Enfield Property Market 2015 in 2016
- New property market share in property market has gone up in 2016 over 2015
All London Posts
dc8593ff-bfc9-4c3c-ae58-278dd7b37cf5|0|.0|27604f05-86ad-47ef-9e05-950bb762570c
Story Highlights
- Barnet had total property sales of £3.25 Billions in 2016
- The total number of properties sold was 5388
- In 2016 the Average property price was £603 K, while Median Price was £464 K
- Not New Property Contributed 82.7% and New Property 17.3% by Sales Value
- Stamp duty changes caused monthly spike in March
- Brexit coupled with Stamp Duty changes caused decline in total sales value by 3.5%
Barnet is one of the boroughs of North London. It had property sales of £3.25 Billions which was 49.26% of North London Property Market 2016 .
Total Sales By Property Type
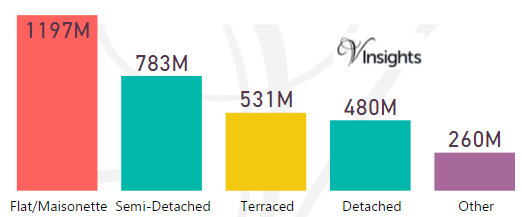
The split of £3.25 Billions across the different property types are:
- Flat/Maisonette £1.2 billions (36.82%)
- Semi-Detached £783 millions (24.08%)
- Terraced £531 millions (16.34%)
- Detached £480 millions (14.77%)
- Other £260 millions (7.99%)
Year on Year Comparison : Compared to Barnet Property Market 2015 in 2016
- All the property types have shown decline in sales except Flat/Maisonette, Other
- Flat/Maisonette has shown very modest growth of 9%
Barnet Property Market at Postcode level
| Postcode |
Coverage Area
|
Local Authority Area |
| EN4 |
Hadley Wood, Cockfosters, East Barnet, New Barnet
|
Barnet, Enfield |
| EN5 |
High Barnet, Arkley
|
Barnet, Hertsmere |
| HA7 |
Stanmore, Queensbury, Belmont (part)
|
Harrow, Brent, Barnet |
| HA8 |
Edgware, Burnt Oak, Canons Park, Queensbury
|
Barnet, Brent, Harrow |
| N2 |
East Finchley, Fortis Green, Hampstead Garden Suburb (part)
|
Barnet, Haringey |
| N3 |
Finchley, Church End, Finchley Central
|
Barnet |
| N10 |
Muswell Hill
|
Haringey, Barnet |
| N11 |
New Southgate, Friern Barnet, Bounds Green, Arnos Grove (part)
|
Enfield, Barnet, Haringey |
| N12 |
North Finchley, Woodside Park
|
Barnet |
| N14 |
Southgate, Oakwood, Arnos Grove (part)
|
Enfield, Barnet |
| NW2 |
Cricklewood district: Cricklewood, Dollis Hill, Childs Hill, Golders Green (part), Brent Cross (part), Willesden (north), Neasden (north)
|
Barnet, Brent, Camden |
| NW3 |
Hampstead district: Hampstead, Belsize Park, Frognal, Childs Hill (east), South Hampstead (north), Swiss Cottage (east), Primrose Hill (north), Chalk Farm (west), Gospel Oak
|
Camden, Barnet |
| NW4 |
Hendon district: Hendon, Brent Cross (part)
|
Barnet |
| NW7 |
Mill Hill district: Mill Hill, Arkley (part), Edgware (part)
|
Barnet |
| NW9 |
The Hyde district: The Hyde, Colindale, Kingsbury, West Hendon, Queensbury (part)
|
Barnet, Brent, Harrow |
| NW11 |
Golders Green district: Golders Green, Temple Fortune, Hampstead Garden Suburb (west), Hendon (part), Brent Cross (part)
|
Barnet |
For property market details at post code level please click on Postcode in the table above.
Month-wise Break-up of Total Sales
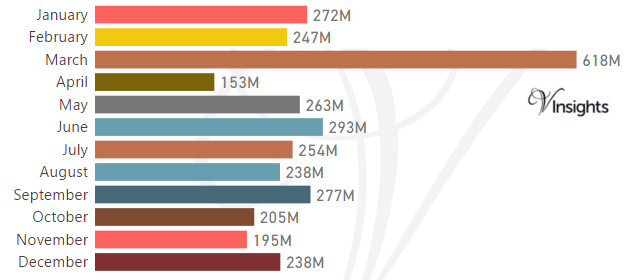
Stamp Duty Hike Impact
- March had property sale spike of £ 618 millions compared to £247 millions in Feb
- The impetus for it was to avoid the extra 3% in Stamp Duty Tax applicable on buying an additional home, being applicable from April 1 2016
Brexit Impact
- Brexit took place on 23rd June 2016.
- As can be observed from the month-wise break-up there has been dip in property sales in the immediate aftermath of Brexit
- Year on Year the property market for Barnet has shown a decline of 3.45% over 2015
Total No Of Properties Sold By Property Type
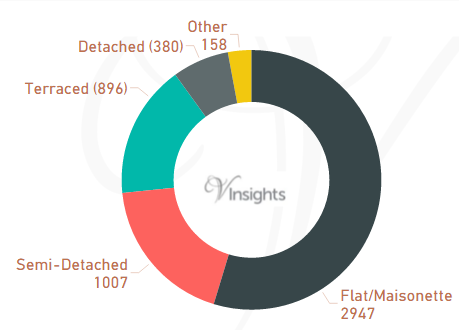
In Barnet the total number of properties sold in year 2016 was 5388. The breakdown by different property types are:
- Terraced 896 (16.63%)
- Semi-Detached 1007 (18.69%)
- Other 158 (2.93%)
- Flat/Maisonette 2947 (54.7%)
- Detached 380 (7.05%)
Year on Year Comparison : Compared to Barnet Property Market 2015 in 2016
- Total number of property sales in Barnet has declined by 3.9%
- All property types have shown decline in number of properties sold except property type Other, Flat/Maisonette
- Other has shown significant growth of 68% in number of properties sold
Average & Median Sales Price
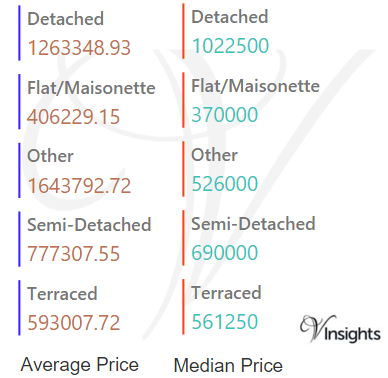
In 2016 the Average property price was £603 K in Barnet. The average price for the different property types was:
- Detached £1.26 millions
- Flat/Maisonette £406 K
- Other £1.64 millions
- Semi-Detached £777 K
- Terraced £593 K
The Median Price in Barnet was £464 K. The median property price for the different property types was:
- Detached £1.02 million
- Flat/Maisonette £370 K
- Other £526 K
- Semi-Detached £690 K
- Terraced £561 K
Year on Year Comparison : Compared to Barnet Property Market 2015
- The average and median sales price across all property types have gone up except for Others, Detached
New Vs Not New Property Statistics
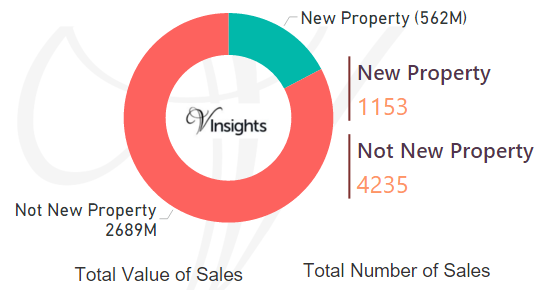
By Value Of Sales
- Not New Property contributed £2.7 billions (82.7%)
- New Property £562 millions (17.3%)
By Number Of Sales
- The number of Not New Property sold was 4235 (78.6%)
- The number of New Property sold was 1153 (21.4%)
Year on Year Comparison : Compared to Barnet Property Market 2015 in 2016
- New property market share in property market has gone up in 2016 over 2015
All London Posts
64e1c0f4-e213-41e9-9c33-cfa697bf4890|0|.0|27604f05-86ad-47ef-9e05-950bb762570c
For 2016 details - Haringey Property Market 2016
Story Highlights
- Haringey had total Property Sales of £1.85 billions in 2015.
- The total number of properties sold in year 2015 was 3049.
- The Average property price was £605 K in Haringey while Median was was £430 K.
- Not New Property Contributed 96.87% and New Property 3.13% by sales value.
Total Sales By Property Type
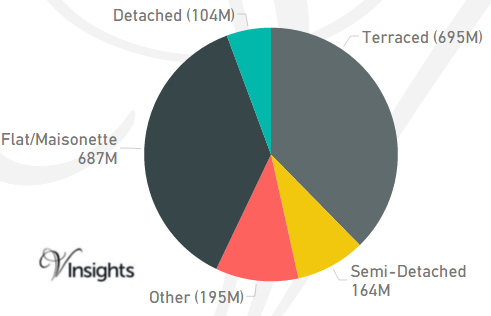
Haringey is one of the Boroughs of North London. It had total Property Sales of £1.85 billions which was 26.43% of North London Property Market 2015.
The split across the different property types are:
- Terraced £695 millions (37.66%)
- Semi-Detached £164 millions (8.87%)
- Other £195 millions (10.57%)
- Flat/Maisonette £687 millions (37.25%)
- Detached £104 millions (5.66%)
Total No Of Properties Sold By Property Type
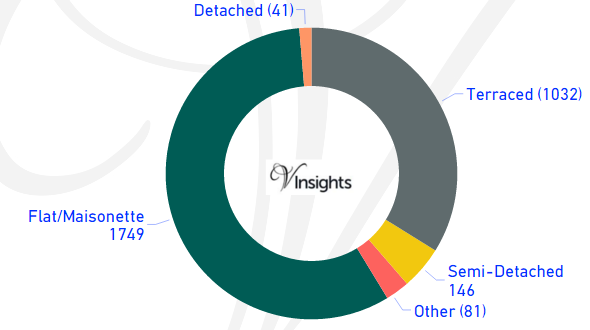
In Haringey the total number of properties sold in year 2015 was 3049. The breakdown by different property types are:
- Terraced 1032 (33.85%)
- Semi-Detached 146 (4.79%)
- Other 81 (2.66%)
- Flat/Maisonette 1749 (57.36%)
- Detached 41 (1.34%)
Average & Median Sales Price
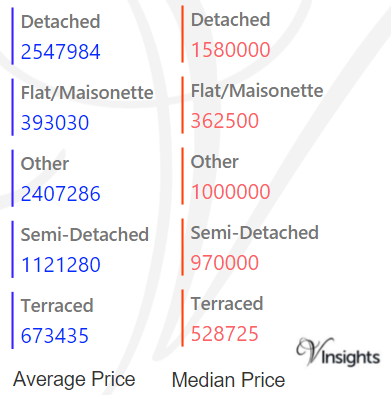
In 2015 the Average property price was £605 K in Haringey. The average price for the different property types are:
- Detached £2.55 millions
- Flat/Maisonette £393 K
- Other £2.41 millions
- Semi-Detached £1.12 millions
- Terraced £673 K.
The Median Price was £430 K. The median property price for the different property types are:
- Detached £1.58 millions
- Flat/Maisonette £363 K
- Other £1 million
- Semi-Detached £970 K
- Terraced £529 K
New Vs Not New Property Statistics
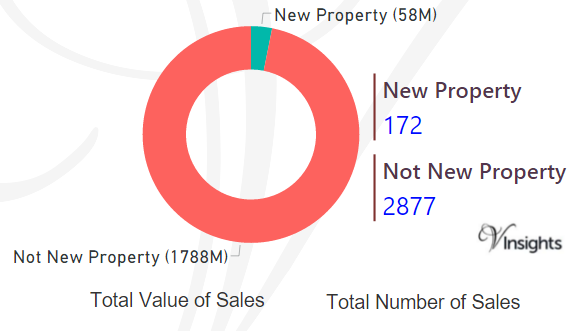
By Value Of Sales
- Not New Property contributed £1.79 billion (96.87%)
- New Property 58 millions (3.13%) giving combined total of £1.77 billions.
By Number Of Sales
- The number of Not New Property sold was 2877 (94.36%)
- The number of New Property sold was 172 (5.64%) giving combined total of 3049.
All London Posts
7e7b2162-46bb-4939-b2ec-7009228604dd|0|.0|27604f05-86ad-47ef-9e05-950bb762570c