Story Highlights
- Hounslow had total Property Sales of £1.86 billions in 2016
- The total number of properties sold in year 2016 was 3072
- The average property price was £607 K while median was was £380 K
- Not New Property contributed 85.94% and New Property 14.06% by sales value
- Stamp duty changes caused monthly spike in March
- Brexit coupled with Stamp Duty changes caused Hounslow Property Market to stagnate and there was no appreciable change in 2016 compared to 2015
Hounslow is one of the Boroughs of West London. It had total Property Sales of £1.86 billions which was 13.27% of West London Property Market 2016.
Total Sales By Property Type
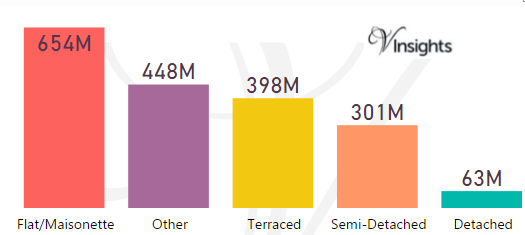
The split of £1.86 billions across the different property types are:
- Flat/Maisonette: £654 millions (35.1%)
- Other: £448 millions (24.03%)
- Terraced: £398 millions (21.37%)
- Semi-Detached: £301 millions (16.15%)
- Detached: £63 millions (3.36%)
Year on Year Comparison : Compared to Hounslow Property Market 2015 in 2016
- All the property types have shown decline in sales except Other
- Others has shown growth of 79.2% in total sales value in 2016 over 2015
- Total sales value has remained fairly constant in 2016 compared to 2015
Hounslow Property Market at Postcode level
| Postcode |
Coverage Area
|
Local Authority Area |
| TW1 |
Twickenham, St. Margarets, Strawberry Hill (east)
|
Hounslow, Richmond upon Thames |
| TW3 |
Hounslow, Lampton, Whitton (north) |
Hounslow, Richmond upon Thames |
| TW4 |
Hounslow West, Hounslow Heath, Whitton (west), Cranford (south) |
Hounslow, Richmond upon Thames |
| TW5 |
Heston, Cranford (north), Osterley (west) |
Hounslow |
| TW7 |
Isleworth, Osterley (east and centre) |
Hounslow,Richmond Upon Thames |
| TW8 |
Brentford, Kew Bridge, Syon Park |
Hounslow, Ealing |
| TW13 |
Feltham, Hanworth |
Hounslow, Richmond upon Thames |
| TW14 |
Feltham (part of the station area), North Feltham, East Bedfont, Hatton |
Hillingdon, Hounslow, Spelthorne |
| TW15 |
Ashford |
Hounslow, Spelthorne |
| UB2 |
Southall (south), Norwood Green |
Ealing, Hounslow |
| W3 |
Acton, West Acton, North Acton (part), South Acton, East Acton (west), Park Royal (south), Hanger Hill Garden Estate, Gunnersbury Park |
Ealing, Hounslow, Hammersmith and Fulham |
| W4 |
Chiswick, Gunnersbury, Turnham Green, Acton Green, South Acton (part), Bedford Park |
Hounslow, Ealing, Hammersmith and Fulham |
| W5 |
Ealing, South Ealing, Ealing Common, North Ealing, Northfields, (south and east), Pitshanger, Hanger Lane |
Ealing, Hounslow |
| W6 |
Hammersmith, Ravenscourt Park, Stamford Brook (part) |
Hammersmith and Fulham, Hounslow |
Month-wise Break-up of Total Sales
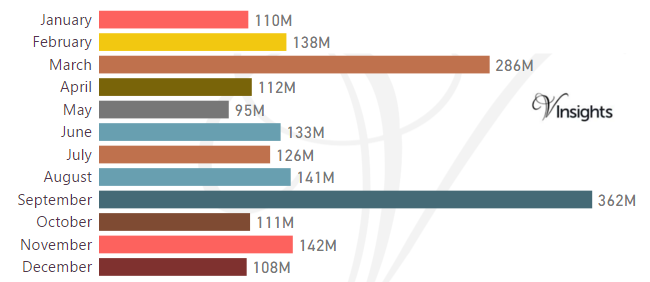
Stamp Duty Hike Impact
- March had property sale spike of £286 millions compared to £138 millions in Feb
- The impetus for it was to avoid the extra 3% in Stamp Duty Tax applicable on buying an additional home, being applicable from April 1 2016
Brexit Impact
- Brexit took place on 23rd June 2016.
- As can be observed from the month-wise break-up there does not seem to have been dip in property sales in the immediate aftermath of Brexit
- Year on Year the property market for Hounslow has remained fairly constant in 2016 over 2015
Total No Of Properties Sold By Property Type
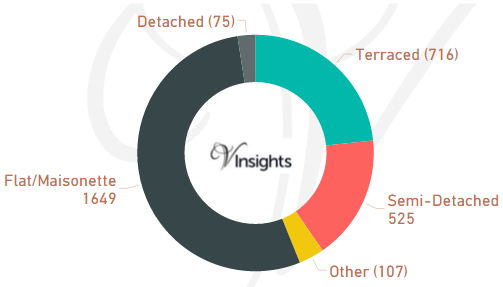
In Hounslow the total number of properties sold in year 2016 was 3072. The breakdown by different property types are:
- Terraced: 716 (23.31%)
- Semi-Detached: 525 (17.09%)
- Other : 107 (3.48%)
- Flat/Maisonette:1649 (53.68%)
- Detached : 75 (2.44%).
Year on Year Comparison : Compared to Hounslow Property Market 2015 in 2016
- Total number of property sales in West London has declined by 14.76%
- All property types have shown decline in number of properties sold except property type Other
- Other has shown significant growth of 18.9%
Average & Median Sales Pric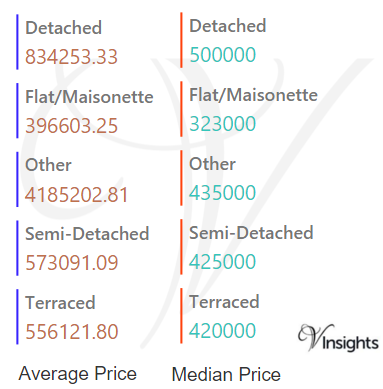
In 2016 the Average property price was £607 K in Hounslow. The average price for the different property types are:
- Detached £834 K
- Flat/Maisonette £396 K
- Other £4.19 millions
- Semi-Detached £573 K
- Terraced £556 K
The Median property price was £380 K. The median property price for the different property types are:
- Detached £500 K
- Flat/Maisonette £323 K
- Other £435 K
- Semi-Detached £425 K
- Terraced £420 K
Year on Year Comparison : Compared to Hounslow Property Market 2015 in 2016
- The average sales price for all property types have gone up except for Detached, Semi-Detached
- The median sales price for all property types have gone up except for Detached, Other
New Vs Not New Property Statistics
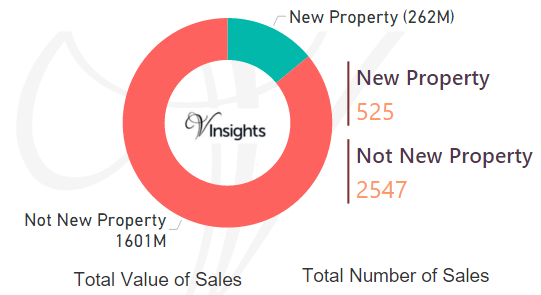
By Value Of Sales
- Not New Property contributed £1.6 billion (85.94%)
- New Property £262 millions (14.06%)
By Number Of Sales
- The number of Not New Property sold was 2547 (82.91%)
- whereas the number of New Properties sold were 525 (17.09%)
Year on Year Comparison : Compared to Hounslow Property Market 2015 in 2016
- New property market share in property market has not shown appreciable change in 2016 over 2015
All London Posts
e47afba4-cc3c-4400-8e39-5f2ed0ce1fbb|0|.0|27604f05-86ad-47ef-9e05-950bb762570c
Story Highlights
- Ealing had total Property Sales of £2.18 billions in 2016
- The total number of properties sold in year 2016 was 3,424
- The Average property price was £636 K in Ealing, while Median was £446 K
- The sales value contributed by New Property was 5.57%, whereas Not New Property 94.43%
- Stamp duty changes caused monthly spike in March
- Brexit coupled with Stamp Duty changes caused decline of 7% in total sales compared to 2015
Ealing is one of the Boroughs of West London. It had total Property Sales of £2.18 billions which was 15.51% of West London Property Market 2016.
Total Sales By Property Type
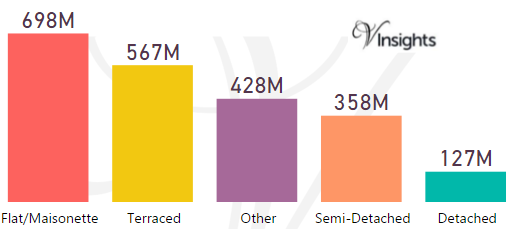
The split of £2.18 billions across the different property types are:
- Flat/Maisonette: £698 millions (32.04%)
- Terraced: £567 millions (26.03%)
- Other: £428 millions (19.66%)
- Semi-Detached: £358 millions (16.45%)
- Detached: £127 millions (5.83%)
Year on Year Comparison : Compared to Ealing Property Market 2015 in 2016
- All the property types have shown decline in sales except Other, Detached
- Others has shown growth of 35.44% in the total sales value
- Year on Year the property market for Ealing has declined by 7.23% over 2015
Ealing Property Market at Postcode level
| Postcode |
Coverage Area
|
Local Authority Area |
| HA0 |
Alperton, Sudbury, Sudbury Hill, Wembley Central and North Wembley
|
Brent, Harrow, Ealing |
| NW10 |
Willesden district: Willesden, Harlesden, Kensal Green, Brent Park, College Park, Stonebridge, North Acton (part), West Twyford, Neasden (south), Old Oak Common, Park Royal (north) |
Brent, Ealing, Hammersmith and Fulham, Kensington and Chelsea |
| TW8 |
Brentford, Kew Bridge, Syon Park |
Hounslow, Ealing |
| UB1 |
Southall (north) |
Ealing |
| UB2 |
Southall (south), Norwood Green |
Ealing, Hounslow |
| UB5 |
Northolt |
Ealing, Harrow, Hillingdon |
| UB6 |
Greenford, Perivale |
Ealing |
| W3 |
Acton, West Acton, North Acton (part), South Acton, East Acton (west), Park Royal (south), Hanger Hill Garden Estate, Gunnersbury Park |
Ealing, Hounslow, Hammersmith and Fulham |
| W4 |
Chiswick, Gunnersbury, Turnham Green, Acton Green, South Acton (part), Bedford Park |
Hounslow, Ealing, Hammersmith and Fulham |
| W5 |
Ealing, South Ealing, Ealing Common, North Ealing, Northfields, (south and east), Pitshanger, Hanger Lane |
Ealing, Hounslow |
| W7 |
Hanwell, Boston Manor (part) |
Ealing, Hounslow |
| W12 |
Shepherds Bush, White City, Wormwood Scrubs, East Acton (east) |
Hammersmith and Fulham, Ealing |
| W13 |
West Ealing, Northfields (north and west) |
Ealing |
For property market details at post code level please click on Postcode in the table above.
Month-wise Break-up of Total Sales
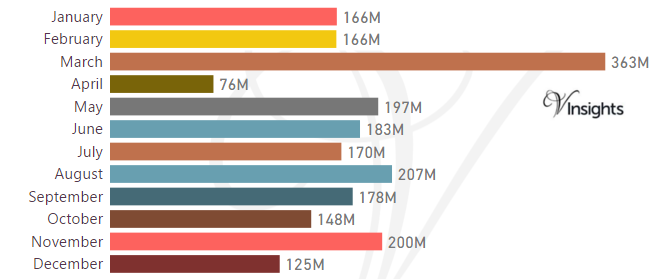
Stamp Duty Hike Impact
- March had property sale spike of £363 millions compared to £166 millions in Feb
- The impetus for it was to avoid the extra 3% in Stamp Duty Tax applicable on buying an additional home, being applicable from April 1 2016
Brexit Impact
- Brexit took place on 23rd June 2016.
- As can be observed from the month-wise break-up there does not seem to have been dip in the property sales in the immediate aftermath of Brexit
- Year on Year the property market for Ealing has declined by 7.23% over 2015
Total No Of Properties Sold By Property Type
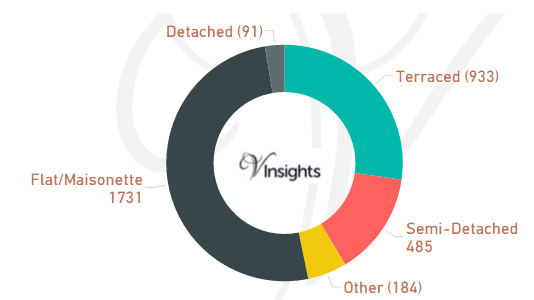
The total number of properties sold in Ealing 2016 was 3,424
- Terraced 933 (27.25%)
- Semi-Detached 485 (14.16%)
- Other 184 (5.37%)
- Flat/Maisonette 1,731 (50.55%)
- Detached 91 (2.66%)
Year on Year Comparison : Compared to Ealing Property Market 2015 in 2016
- Total number of property sales in London has declined by 15%
- All property types have shown decline in number of properties sold except property type Other
- Other has shown significant increase of 48.4% over 2015
Average & Median Sales Price
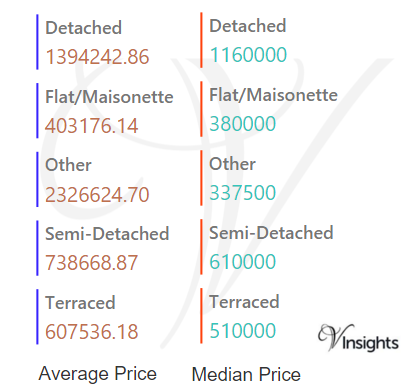
In 2016 the average property price was £636 K in Ealing. The average property price for the different property types are:
- Detached: £1.39 millions
- Flat/Maisonette: £403 K
- Other: £2.3 millions
- Semi-Detached: £739 K
- Terraced: £608 K
The median property price was £446 K. The median property price for the different property types are:
- Detached: £1.16 millions
- Flat/Maisonette: £380 K
- Other: £338 K
- Semi-Detached: £610 K
- Terraced: £510 K
Year on Year Comparison : Compared to Ealing Property Market 2015 in 2016
- The sales price across all property types have gone up except for Flat/Maisonette, Other
New Vs Not New Property Statistics
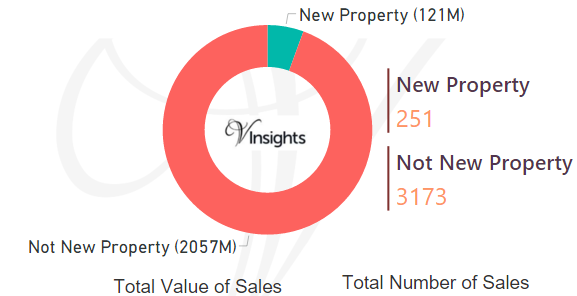
By Value Of Sales
- The sales value contributed by New Property was £121 millions (5.57%)
- Not New Property contributed £2.06 billions (94.43%)
By Number Of Sales
- New properties sold were 251 (7.33%)
- where as not new property sold were 3,173 (92.67%)
All London Posts
6b2ef156-221c-4d73-9fe5-c241e96ca0da|0|.0|27604f05-86ad-47ef-9e05-950bb762570c
Please click here for the updated version of this post
This Post covers
- Coverage Area of Postcode W2 to W9
- Total Sales By Postcode W2 to W9
- Average & Median Sales Price By Postcode W2 to W9
- Total Number of Sales By Postcode W2 to W9
- Multi Year Property Trend Analysis By Postcode W2 to W9
- Schools for Postcode Area W
- Posts for Postcode Area W
Coverage Area of Postcode W2 to W9
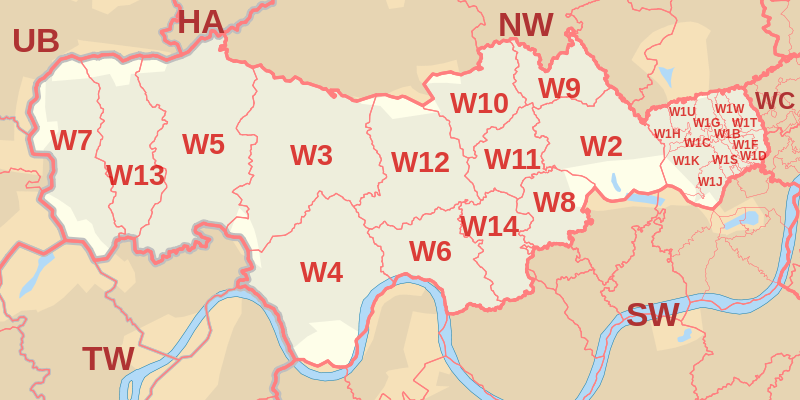 |
| Postcode |
Coverage Area |
Local Authority Area |
| W2 |
Paddington, Bayswater, Hyde Park, Westbourne Green, Little Venice (part), Notting Hill (part) |
Westminster, Kensington and Chelsea |
| W3 |
Acton, West Acton, North Acton (part), South Acton, East Acton (west), Park Royal (south), Hanger Hill Garden Estate, Gunnersbury Park |
Ealing, Hounslow, Hammersmith and Fulham |
| W4 |
Chiswick, Gunnersbury, Turnham Green, Acton Green, South Acton (part), Bedford Park |
Hounslow, Ealing, Hammersmith and Fulham |
| W5 |
Ealing, South Ealing, Ealing Common, North Ealing, Northfields, (south and east), Pitshanger, Hanger Lane |
Ealing, Hounslow |
| W6 |
Hammersmith, Ravenscourt Park, Stamford Brook (part) |
Hammersmith and Fulham, Hounslow |
| W7 |
Hanwell, Boston Manor (part) |
Ealing, Hounslow |
| W8 |
Kensington, Holland Park (part) |
Kensington and Chelsea |
| W9 |
Maida Hill, Maida Vale, Little Venice (part) |
Westminster, Brent, Camden |
Total Sales By Postcode in 2016
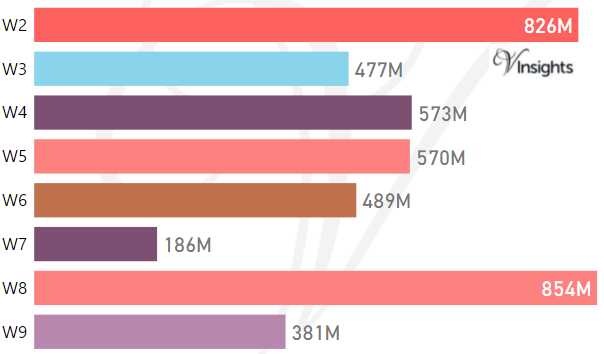
The Total Sales by the Postcodes are:
- W2 £826 millions, W3 £477 millions , W4 £573 millions
- W5 £570 millions, W6 £489 millions , W7 £186 millions
- W8 £854 millions, W9 £381 millions
Average & Median Sales Price By Postcode in 2016
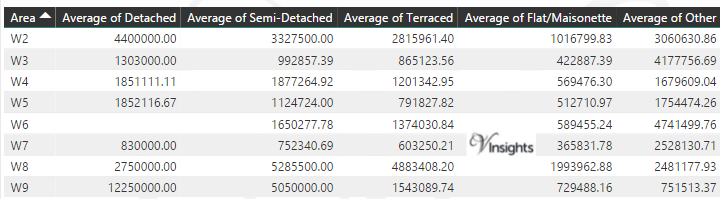
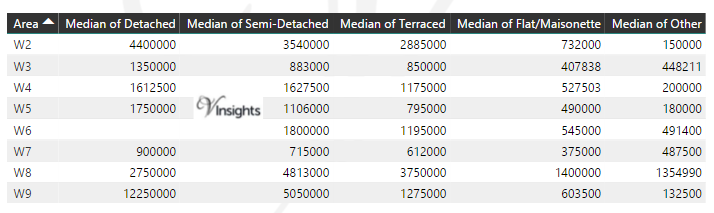
Total Number Of Sales By Postcode in 2016
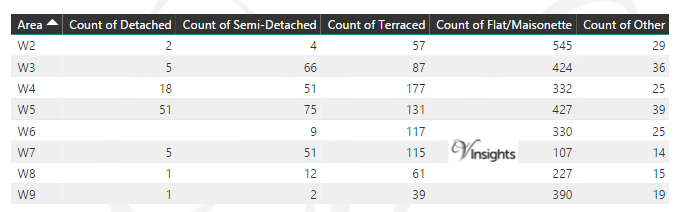
Multi Year Property Trend Analysis By Postcode
Schools for Postcode Area W
- London W Postcode Area - W1B, W1C, W1D, W1F, W1G, W1H, W1J, W1K, W1S, W1T, W1U, W1W School Details
- London W Postcode Area - W2, W3, W4, W5, W6, W7, W8, W9 School Details
- London W Postcode Area - W10, W11, W12, W13, W14 School Details
Posts for Postcode Area W
All W Postcodes Yearly & Trend Analysis Posts
Reference
W Postcode Area As Per Wikipedia
b0422be0-783a-48d6-9d16-0f7ba1ece8a2|0|.0|27604f05-86ad-47ef-9e05-950bb762570c
Please click here for the updated version of this post
This Post covers
- Coverage Area of Postcode W1B to W1W
- Total Sales By Postcode W1B to W1W
- Average & Median Sales Price By Postcode W1B to W1W
- Total Number of Sales By Postcode W1B to W1W
- Multi Year Property Trend Analysis By Postcode W1B to W1W
- Schools for Postcode Area W
- Posts for Postcode Area W
Coverage Area of Postcode W1B to W1W
Total Sales By Postcode in 2016
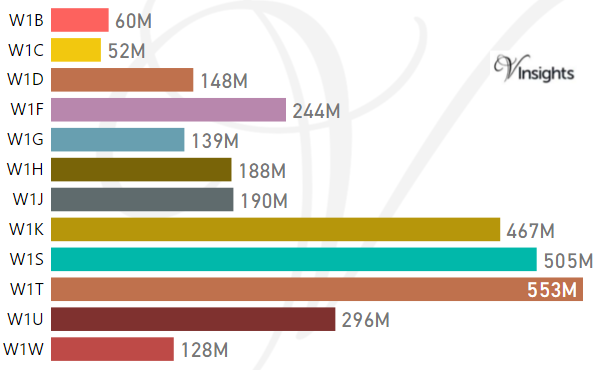
The Total Sales by the Postcodes are:
- W1B £60 millions, W1C £52 millions , W1D £148 millions, W1F £244 millions
- W1G £139 millions, W1H £188 millions , W1J £190 millions, W1K £467 millions
- W1S £505 millions, W1T £553 millions , W1U £296 millions, W1W £128 millions
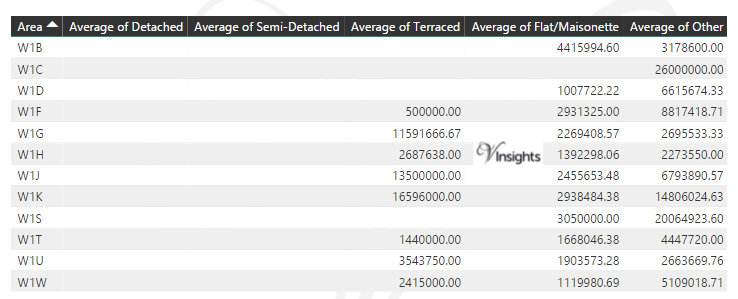
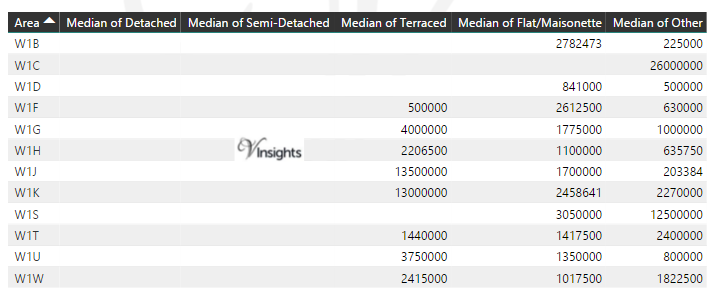
Average & Median Sales Price By Postcode in 2016
Total Number Of Sales By Postcode in 2016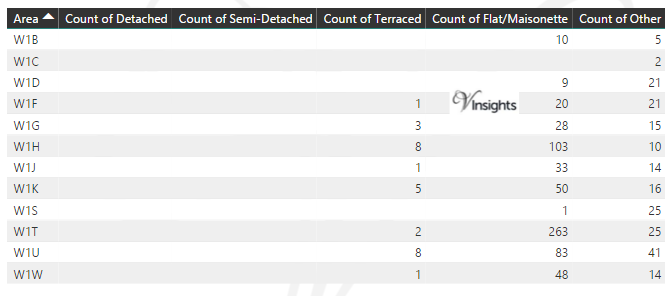
Multi Year Property Trend Analysis By Postcode
Schools for Postcode Area W
- London W Postcode Area - W1B, W1C, W1D, W1F, W1G, W1H, W1J, W1K, W1S, W1T, W1U, W1W School Details
- London W Postcode Area - W2, W3, W4, W5, W6, W7, W8, W9 School Details
- London W Postcode Area - W10, W11, W12, W13, W14 School Details
Posts for Postcode Area W
All Postcode Area Posts
Reference
W Postcode Area As Per Wikipedia
a8046eb2-cf8b-45e7-988a-f2955861273f|0|.0|27604f05-86ad-47ef-9e05-950bb762570c
Tags :
W1B Property Sales ,
W1C Property Sales ,
W1D Property Sales ,
W1F Property Sales ,
W1G Property Sales ,
W1H Property Sales ,
W1J Property Sales ,
W1K Property Sales ,
W1S Property Sales ,
W1T Property Sales ,
W1U Property Sales ,
W1W Property Sales
Please click here for the updated version of this post
This Post covers
- Coverage Area of Postcode UB7 to UB11
- Total Sales By Postcode UB7 to UB11
- Average & Median Sales Price By Postcode UB7 to UB11
- Total Number of Sales By Postcode UB7 to UB11
- Multi Year Property Trend Analysis By Postcode UB1 to UB6
- Schools for Postcode Area UB
- Posts for Postcode Area UB
Coverage Area of Postcode UB7 to UB11
Total Sales By Postcode UB7 to UB11 in 2016
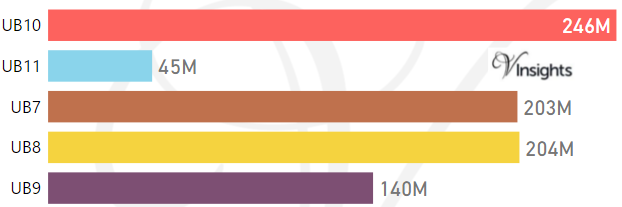
The Total Sales by the Postcodes are:
- UB10 £246 millions, UB11 £45 millions
- UB7 £203 millions, UB8 £204 millions , UB9 £140 millions
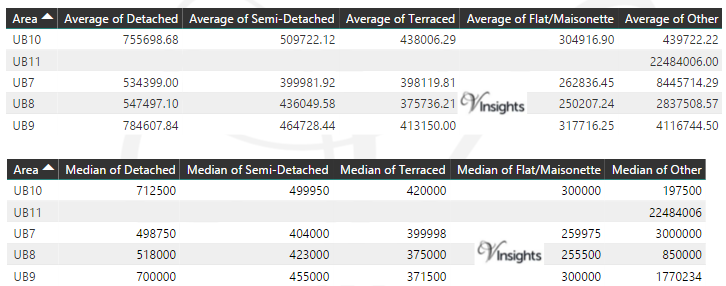
Average & Median Sales Price By Postcode in 2016
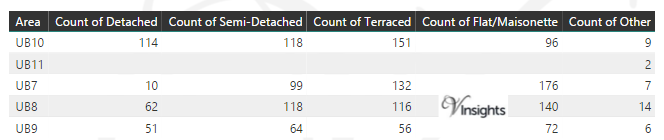
Total Number Of Sales By Postcode in 2016
Multi Year Property Trend Analysis By Postcode
Schools for Postcode Area UB
Posts for Postcode Area UB
All Postcode Area Posts
Reference
UB Postcode Area As Per Wikipedia
7f9c0f86-f4b2-40ac-ba60-972b0ca59a4f|0|.0|27604f05-86ad-47ef-9e05-950bb762570c