
Story Highlights
- West London had total property sales of approx. £14 billions in 2016
- The maximum sales was in Richmond Upon Thames at £2.55 billions
- The total number of West London properties sold in 2016 was 21,484
- The average sales price in West London was £654 K, whereas median was £457 K
- By borough the average price was maximum in Hammersmith And Fulham at £991 K
- New Property sales were 10.43% by value, whereas Not New Property contributed 89.57%
- Stamp duty changes caused monthly spike in March
- Brexit coupled with Stamp Duty changes caused significant decline in West London Property Market 2016 over 2015
West London boroughs are Brent, Ealing, Hammersmith & Fulham, Harrow, Hillingdon, Hounslow, Richmond upon Thames
Total Sales By Borough
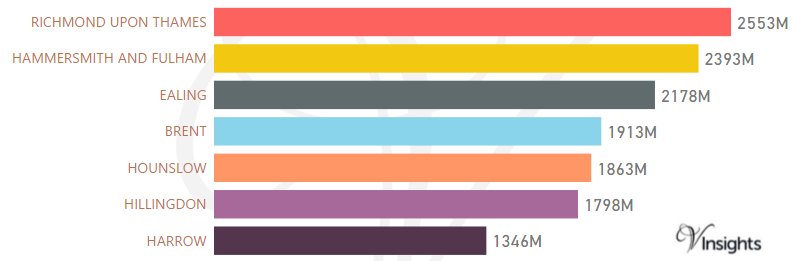
West London in 2016 had total property sales of £14 billions. It was 18.48% of the London Property Market 2016.
The split of £14 billions across the different property types are:
Year on Year Comparison : Compared to West London Property Market 2015 in 2016
- All the boroughs have shown decline in total sales by value.
- The decline in West London property market has been 7.14%
Total Sales By Property Types
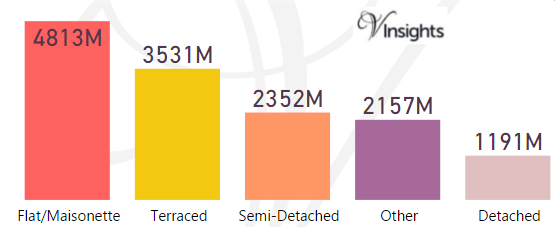
The split across the different property types are:
- Detached at £1.19 billions (8.48%)
- Other at £2.16 billions (15.36%)
- Semi-Detached at £2.35 billions (16.75%)
- Terraced at £3.5 billions (25.14%)
- Flat/Maisonette at £4.8 billions (34.27%)
Year on Year Comparison : Compared to West London Property Market 2015 in 2016
- All the property types have shown decline in sales except Other
- Others has shown growth of 6.93% in total sales value
Month-wise Break-up of Total Sales
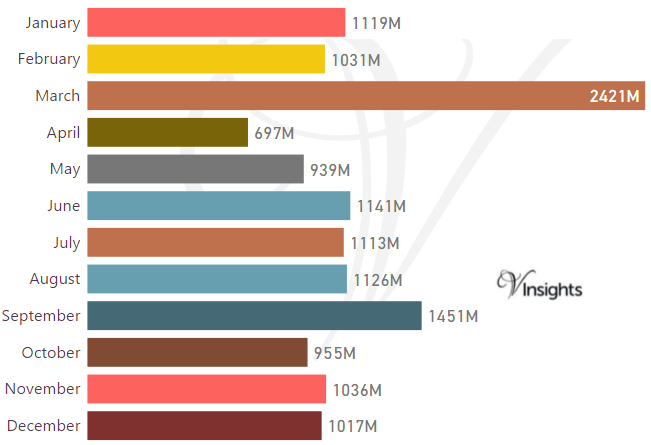
Stamp Duty Hike Impact
- March had property sale spike of £2.42 billions compared to £1.03 billions in Feb
- The impetus for it was to avoid the extra 3% in Stamp Duty Tax applicable on buying an additional home, being applicable from April 1 2016
Brexit Impact
- Brexit took place on 23rd June 2016.
- As can be observed from the month-wise break-up there does not seem to have been dip in property sales in the immediate aftermath of Brexit
- Year on Year the property market for West London has declined by £1 billions i.e. 6.93% over 2015
Total Number Of Sales By Property Types
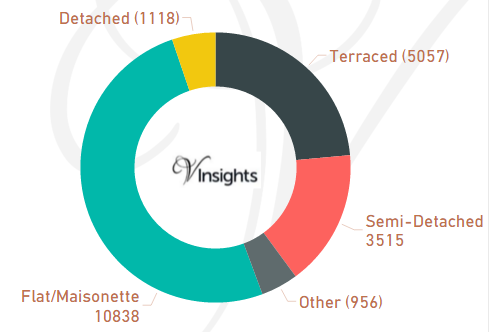
The total number of properties sold in West London 2016 was 21,484
- Detached 1,118 (5.2%)
- Semi-Detached 3,515 (16.36%)
- Terraced 5,057 (23.54%)
- Flat/Maisonette 10,838 (50.45%)
- Other 956 (4.45%)
Year on Year Comparison : Compared to West London Property Market 2015 in 2016
- Total number of property sales in West London has decreased by 3,404 which is 15.84% decline
- All property types have shown decline in number of properties sold except property type Other
- Other has shown significant increase of 53% from 627 in 2015 to 956 in 2016.
Average & Median Sales Price
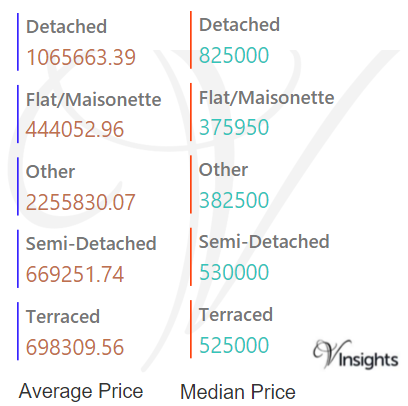
The average sales price in West London was £654 K. For the different property types it was:
- Detached £1.07 millions
- Semi-Detached £670 K
- Terraced £698 K
- Flat/Maisonette £444 K
- Other it was £2.26 millions.
Similarly the median sales price in West London was £457 K. For the different property types it was:
- Detached £825 K
- Semi-Detached £530 K
- Terraced £525 K
- Flat/Maisonette £376 K
- Other it was £383 K
Year on Year Comparison : Compared to West London Property Market 2015 in 2016
- The average and median sales price across all property types have gone up except for others
Average & Median Sales Price By Borough
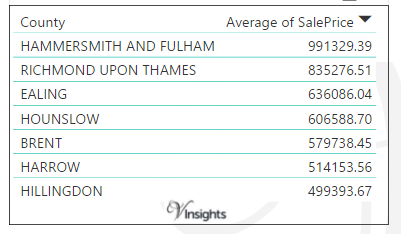
The average sales prices in West London at Borough level is as above.
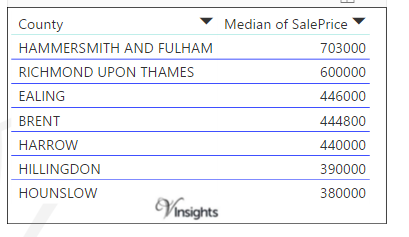
The median sales prices in West London at Borough level is as above:
Year on Year Comparison : Compared to West London Property Market 2015 in 2016
New Vs Not New Property Statistics
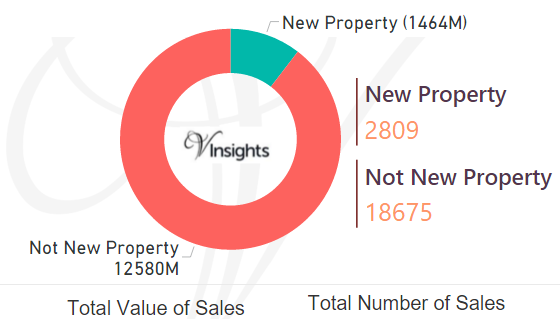
By Value Of Sales
- The sales value contributed by New Property was £1.46 billions (10.43%)
- where as Not New Property contributed £12.6 billions (89.57%)
By Number Of Sales
- New properties sold were 2,809 (13.07%)
- where as not new property sold were 18,675 (86.93%).
Year on Year Comparison : Compared to West London Property Market 2015 in 2016
- New property market share in property market has gone slightly up in 2016 over 2015
All London Posts
4c32ba13-545c-4e31-8ce9-95b8dd618478|0|.0|27604f05-86ad-47ef-9e05-950bb762570c