For 2016 details - Merton Property Market 2016
Story Highlights
- Merton had total Property Sales of £1.92 billions in 2015
- The total number of properties sold in year 2015 was 3245
- The Average property price was £592 K in while Median was £410 K
- Not New Property Contributed 95.59% and New Property 4.41% by sales value
Total Sales By Property Type
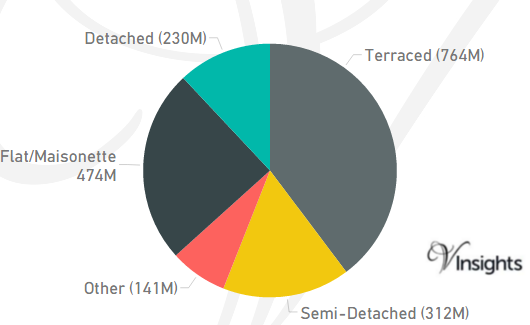
Merton is one of the Boroughs of South London. It had total Property Sales of £1.92 billions which was 13.05% of South London Property Market 2015.
The split across the different property types are:
- Terraced £764 millions (39.73%)
- Semi-Detached £312 millions (16.26%)
- Other £141 millions (7.33%)
- Flat/Maisonette £474 millions (24.69%)
- Detached £230 millions (11.99%)
Total No Of Properties Sold By Property Type
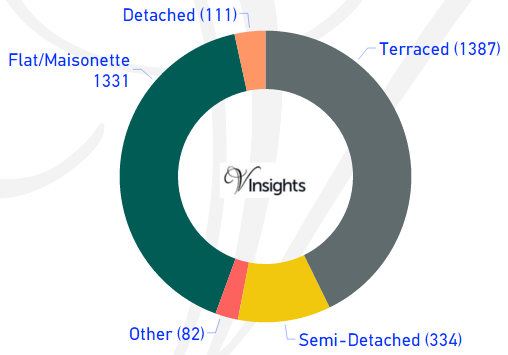
In Merton the total number of properties sold in year 2015 was 3245.
The breakdown by different property types are:
- Terraced 1387 (42.74%)
- Semi-Detached 334 (10.29%)
- Other 82 (2.08%)
- Flat/Maisonette 1331 (41.02%)
- Detached 111 (3.42%)
Average & Median Sales Price
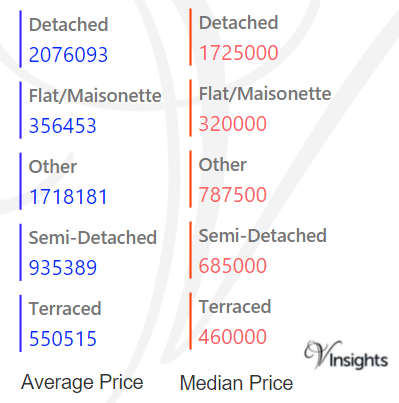
In 2015 the Average property price was £592 K in Merton. The average price for the different property types are:
- Detached £2.08 million
- Flat/Maisonette £356 K
- Other £1.72 millions
- Semi-Detached £935 K
- Terraced £551 K
The Median Price was £410 K.The median property price for the different property types are:
- Detached £173 K
- Flat/Maisonette £320 K
- Other £788 K
- Semi-Detached £685 K
- Terraced £460 K
New Vs Not New Property Statistics
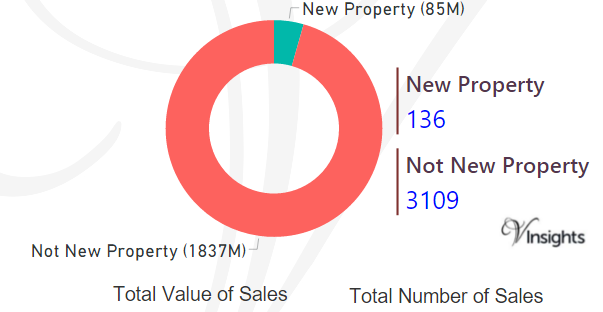
By Value Of Sales
- Not New Property contributed £1.84 billion (95.59%)
- New Property 85 millions (4.41%) giving combined total of £1.92 billions.
By Number Of Sales
- The number of Not New Property sold was 3109 (95.81%)
- The number of New Properties sold was 136 (4.19%) giving combined total of 3245.
All London Posts
de4244ca-dddb-4a41-98a9-14fd053290a1|0|.0|27604f05-86ad-47ef-9e05-950bb762570c
For 2016 details - Lewisham Property Market 2016
Story Highlights
- Lewisham had total Property Sales of £2.286 billions in 2015.
- The total number of properties sold in year 2015 was 5004.
- The Average property price was £457 K in Lewisham while Median was was £355 K.
- Not New Property Contributed 88.65% by value and New Property 11.35%
Total Sales By Property Type
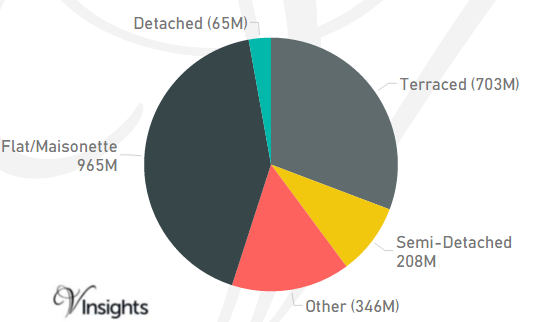
Lewisham is one of the Boroughs of East London. It had total Property Sales of £2.286 billions which was 13.97% of East London Property Market 2015.
The split across the different property types are:
- Terraced £703 millions (30.75%)
- Semi-Detached £208 millions (9.11%)
- Other £346 millions (15.12%)
- Flat/Maisonette £965 millions (42.19%)
- Detached £65 millions (2.83%).
Total No Of Properties Sold By Property Type
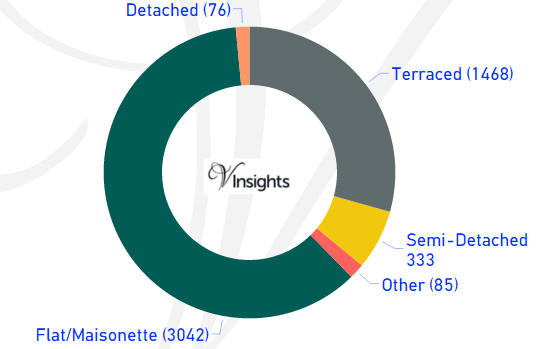
In Lewisham the total number of properties sold in year 2015 was 5004. The breakdown by different property types are:
- Terraced 1468 (29.34%)
- Semi-Detached 333 (6.65%)
- Other 85 (1.7%)
- Flat/Maisonette 3042 (60.79%)
- Detached 76 (1.52%).
Average & Median Sales Price
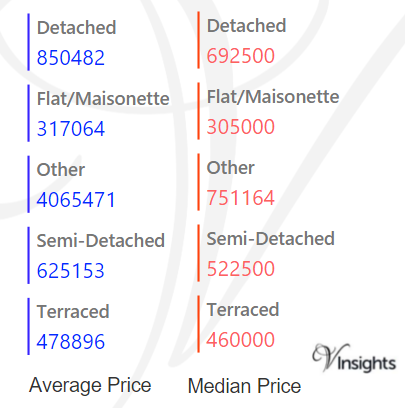
In 2015 the Average property price was £457 K in Lewisham. The average price for the different property types are:
- Detached £851 K
- Flat/Maisonette £317 K
- Other £4.07 millions
- Semi-Detached £625 K
- Terraced £479 K.
The Median Price was £355 K. The median property price for the different property types are:
- Detached £693 K
- Flat/Maisonette £305 K
- Other £751 K
- Semi-Detached £523 K
- Terraced £460 K.
New Vs Not New Property Statistics
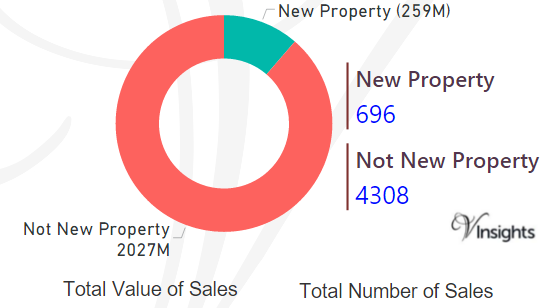
By Value Of Sales
- Not New Property contributed £2.03 billion (88.65%)
- New Property £259 millions (11.35%) giving combined total of £2.286 billions .
By Number Of Sales
- The number of Not New Property sold was 4308 (86.09%)
- The number of New Properties sold was 696 (13.91%) giving combined total of 4464.
All London Posts
77824cd2-ae44-4ec6-a8ec-06fb0cde7e57|0|.0|27604f05-86ad-47ef-9e05-950bb762570c
For 2016 details - Lambeth Property Market 2016
Story Highlights
- Lambeth had total Property Sales of £3.1 billions in 2015.
- The total number of properties sold in year 2015 was 5045.
- The Average property price was £606 K in Lambeth, while Median was £450 K.
-
Not New Property contributed £2.8 billions (91.3%) and New Property 266 millions (8.7%) giving combined total of £3.1 billions.
-
The number of Not New Property sold was 4486 (88.92%), whereas the number of New Property sold was 559 (11.08%) giving combined total of 5045.
Total Sales By Property Type
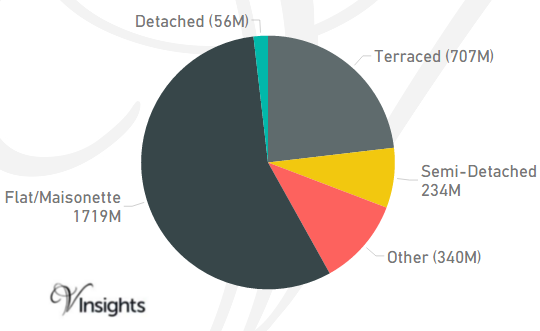
Lambeth is one of the Boroughs of Central London. It had total Property Sales of £3.1 billions which was 10.92% of Central London Property Market 2015.
The split across the different property types are:
- Terraced £707 millions (13.81%)
- Semi-Detached £234 millions (5.41%)
- Other £340 millions (26%)
- Flat/Maisonette £1.72 billions (50.05%)
- Detached £56 millions (4.74%)
Total No Of Properties Sold By Property Type
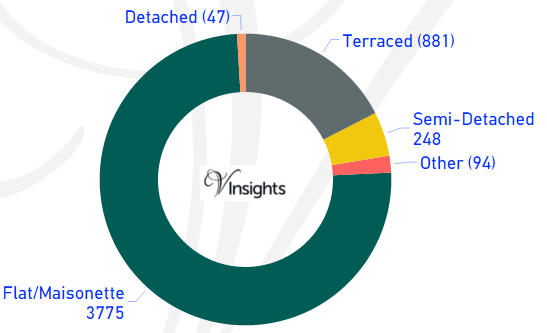
In Lambeth the total number of properties sold in year 2015 was 5045. The breakdown by different property types are:
- Terraced 881 (17.46%)
- Semi-Detached 248 (4.92%)
- Other 94 (1.86%)
- Flat/Maisonette 3775 (74.83%)
- Detached 47 (0.93%)
Average & Median Sales Price
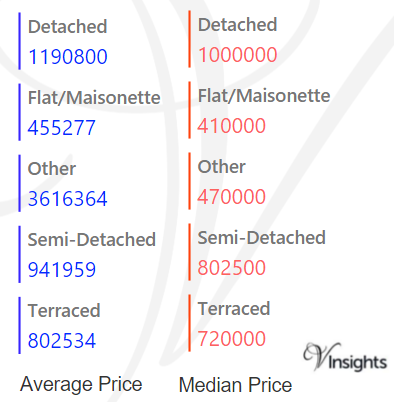
In 2015 the Average property price was £606 K in Lambeth . The average price for the different property types are:
- Detached £1.19 millions
- Flat/Maisonette £455 K
- Other £3.6 millions
- Semi-Detached £942 K
- Terraced £803 K
The Median Price was £450 K. The median property price for the different property types are:
- Detached £1 millions
- Flat/Maisonette £410 K
- Other £470 K
- Semi-Detached £803 K
- Terraced £720 K
New Vs Not New Property Statistics
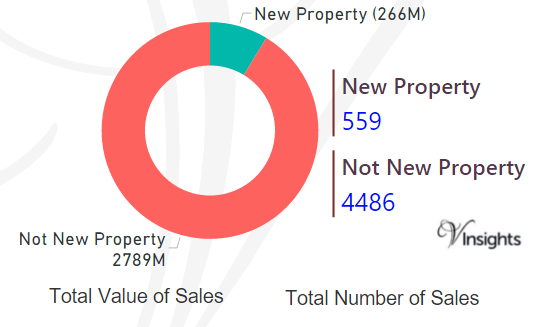
By Value Of Sales
- Not New Property contributed £2.8 billions (91.3%)
- New Property 266 millions (8.7%) giving combined total of £3.1 billions.
By Number Of Sales
- The number of Not New Property sold was 4486 (88.92%)
- The number of New Properties sold was 559 (11.08%) giving combined total of 5045.
All London Posts
2cce0d16-9d0f-45b4-a2d0-1d2dcb2c8c36|0|.0|27604f05-86ad-47ef-9e05-950bb762570c
For 2016 details - Kingston Upon Thames Property Market 2016
Story Highlights
- Kingston Upon Thames had total Property Sales of £1.6 billions in 2015.
- The total number of properties sold in year 2015 was 2740.
- The Average property price was £569 K in while Median was £409 K.
- Not New Property Contributed 95.71% and New Property 4.29% by sales value
Total Sales By Property Type
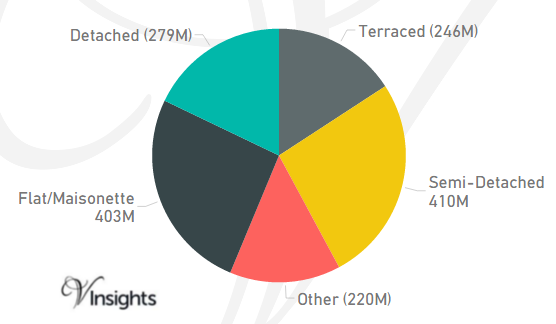
Kingston Upon Thames is one of the Boroughs of South London. It had total Property Sales of £1.6 billions which was 10.58% of South London Property Market 2015.
The split across the different property types are:
- Terraced £246 millions (15.81%)
- Semi-Detached £410 millions (26.34%)
- Other £220 millions (14.14%)
- Flat/Maisonette £403 millions (25.84%)
- Detached £279 millions (17.89%)
Total No Of Properties Sold By Property Type
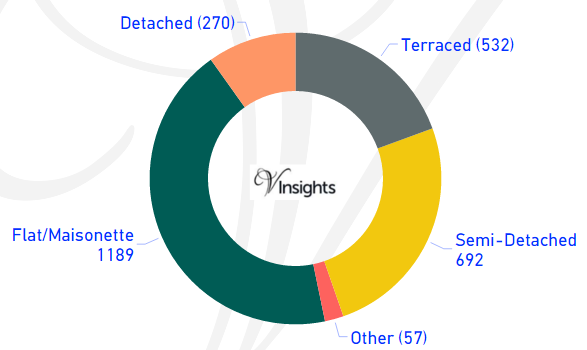
In Kingston Upon Thames the total number of properties sold in year 2015 was 2740.
The breakdown by different property types are:
- Terraced 532 (19.42%)
- Semi-Detached 692 (25.26%)
- Other 57 (2.08%)
- Flat/Maisonette 1189 (43.39%)
- Detached 270 (9.85%)
Average & Median Sales Price
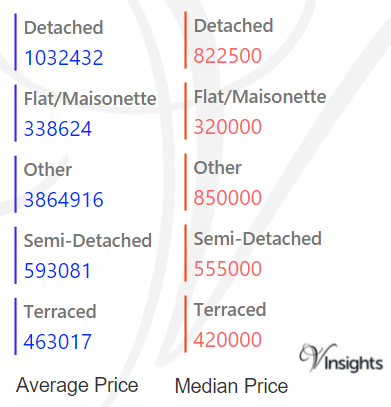
In 2015 the Average property price was £569 K in Kingston Upon Thames. The average price for the different property types are:
- Detached £1.03 million
- Flat/Maisonette £339 K
- Other £3.9 millions
- Semi-Detached £593 K
- Terraced £463 K
The Median Price was £409 K.The median property price for the different property types are:
- Detached £823 K
- Flat/Maisonette £320 K
- Other £850 K
- Semi-Detached £555 K
- Terraced £420 K
New Vs Not New Property Statistics
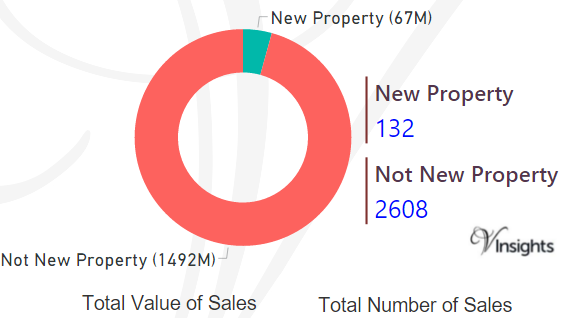
By Value Of Sales
- Not New Property contributed £1.49 billion (95.71%)
- New Property 67 millions (4.29%) giving combined total of £1.6 billions.
By Number Of Sales
- The number of Not New Property sold was 2608 (95.18%)
- The number of New Property sold was 132 (4.82%) giving combined total of 2740.
All London Posts
45b01061-e790-4886-9d6c-769678e50fc5|0|.0|27604f05-86ad-47ef-9e05-950bb762570c
For 2016 details - Kensington And Chelsea Property Market 2016
Story Highlights
- Kensington And Chelsea had total Property Sales of £5.9 billions in 2015.
- The total number of properties sold in year 2015 was 2682.
- The Average property price was £2.18 millions, while Median was £1.2 millions.
-
Not New Property contributed £5.06 billion (86.43%) and New Property 795 millions (13.57%) giving combined total of £5.9 billions.
-
The number of Not New Property sold was 2384 (88.89%), whereas the number of New Property sold was 298 (11.11%) giving combined total of 2682.
Total Sales By Property Type
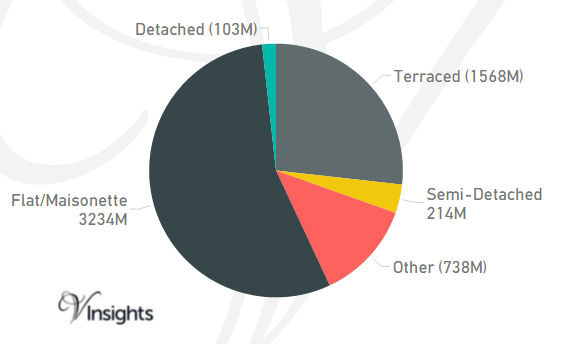
Kensington And Chelsea is one of the Boroughs of Central London. It had total Property Sales of £5.9 billions which was 20.94% of Central London Property Market 2015.
The split across the different property types are:
- Terraced £1568 millions (26.77%)
- Semi-Detached £214 millions (3.66%)
- Other £738 millions (12.6%)
- Flat/Maisonette £3.234 billions (55.2%)
- Detached £103 millions (1.76%)
Total No Of Properties Sold By Property Type
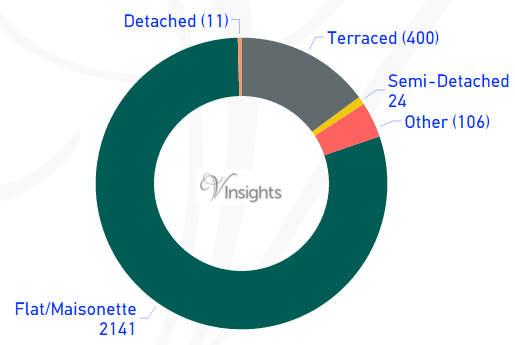
In Kensignton and Chelsea the total number of properties sold in year 2015 was 2682. The breakdown by different property types are:
- Terraced 400 (14.91%)
- Semi-Detached 24 (0.89%)
- Other 106 (3.95%)
- Flat/Maisonette 2141 (79.83%)
- Detached 11 (0.41%)
Average & Median Sales Price
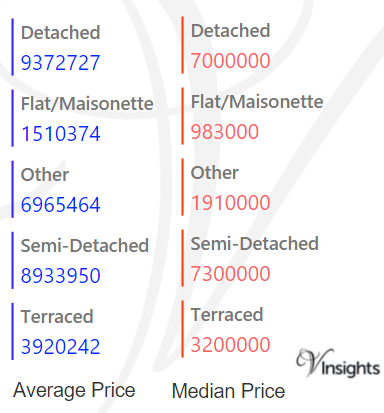
In 2015 the Average property price was £2.18 millions in Kensington and Chlesea. The average property price for the different property types are:
- Detached £9.4 millions
- Flat/Maisonette £1.51 millions
- Other £6.97 millions
- Semi-Detached £8.9 millions
- Terraced £3.9 millions
The Median Price was £1.2 millions. The median property price for the different property types are:
- Detached £7.00 millions
- Flat/Maisonette £983 K
- Other £1.91 millions
- Semi-Detached £7.30 millions
- Terraced £3.2 millions
New Vs Not New Property Statistics
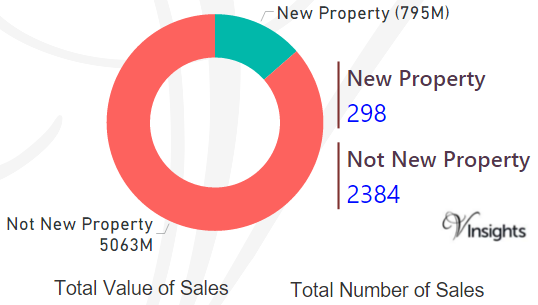
By Value Of Sales
- Not New Property contributed £5.06 billion (86.43%)
- New Property 795 millions (13.57%) giving combined total of £5.9 billions.
By Number Of Sales
- The number of Not New Property sold was 2384 (88.89%)
- The number of New Properties sold was 298 (11.11%) giving combined total of 2682.
All London Posts
ebbeebc7-f85f-45e9-b9f3-07e5acd724a3|0|.0|27604f05-86ad-47ef-9e05-950bb762570c