For 2016 details - Hampshire Property Market 2016
Story Highlights
- Hampshire had total property sales of £8.88 Billions in 2015
- The total number of properties sold in 2015 was 26,452 properties
- The average sales price in Hampshire was £336 K
- Across its districts average sales price was maximum for Winchester at £437 K
- New Property sales were 9.49% by value, where as Not New 90.51%
Hampshire is one of the counties of South East England. The districts of Hampshire are New Forest, Basingstoke and Deane, Winchester, East Hampshire, Test Valley, Fareham, Hart, Eastleigh, Rushmoor, Havant, Gosport.
Total Sales By Districts
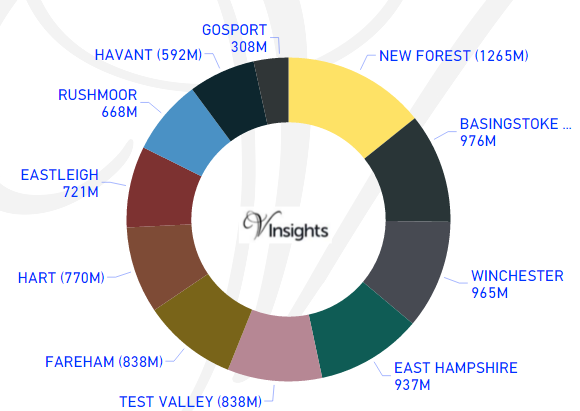
Hampshire had total property sales of £8.88 Billions, which was 14.49% of the total South East property Market in 2015.
The split of the sales across the different districts was:
- New Forest £1.27 billions (14.25%)
- Basingstoke And Deane £976 millions (10.99%)
- Winchester £965 millions (10.87%)
- East Hampshire £937 millions (10.55%)
- Test Valley £838 millions (9.44%)
- Fareham £838 millions (9.44%)
- Hart £770 millions (8.67%)
- Eastleigh £721 millions (8.12%)
- Rushmoor £668 millions (7.53%)
- Havant £592 millions (6.67%)
- Gosport £308 millions (3.47%)
Total Sales By Property Type
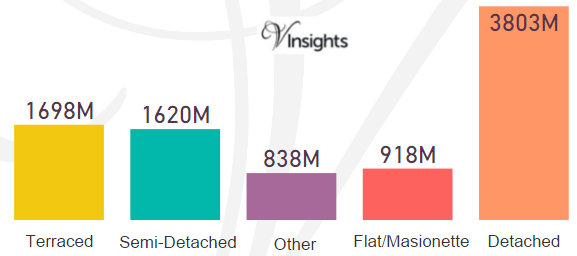
Hampshire had total property sales of £8.88 Billions. The split across the different property types are:
- Detached £3.8 Billions (42.84%)
- Terraced £1.7 Billions (19.13%)
- Semi-Detached £1.62 Billions (18.25%)
- Flat/Maisonette £918 millions (10.34 %)
- Other £838 millions (9.44%)
Total No Of Properties Sold By Property Type
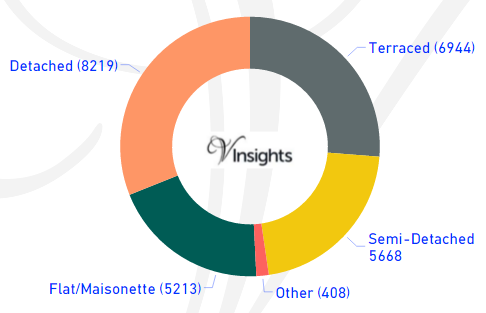
The total property sales of £8.88 Billions in 2015 was spread over 26,452 properties.
- Terraced properties was 6,944 (26.25%)
- Detached 8,219 (31.07%)
- Semi-Detached 5,668 (21.43%)
- Flat/Maisonette 5,213 (19.71%)
- Others 408 (1.54%)
Average & Median Sales Price
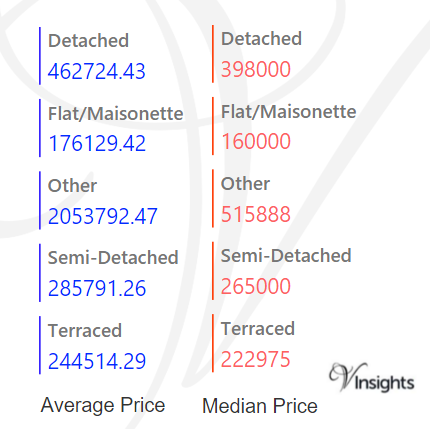
The average sales price in Hampshire was £336 K and for the different property types it was:
- Detached £463 K
- Semi-Detached £286 K
- Terraced £245 K
- Flat/Maisonette £176 K
- Other it is £2.05 million
Similarly median sales price in Hampshire was £265 K and for different property types are:
- Detached £398 K
- Semi-Detached £265 K
- Terraced £223 K
- Flat/Maisonette £160 K
- Other it is £516 K
Average & Median Sales Price By Districts
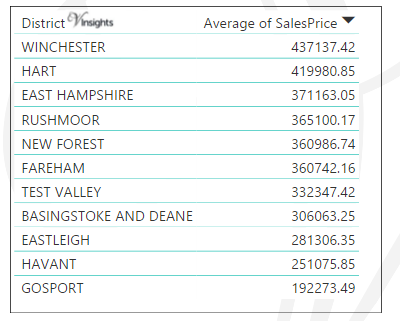
Across the Hampshire districts the average price is as above.
- Winchester £437 K
- Hart £420 K
- East Hampshire £371 K
- Rushmoor £365 K
- New Forest £361 K
- Fareham £361 K
- Test Valley £332 K
- Basingstoke And Deane £306 K
- EastLeigh £281 K
- Havant £251 K
- Gosport £192 K
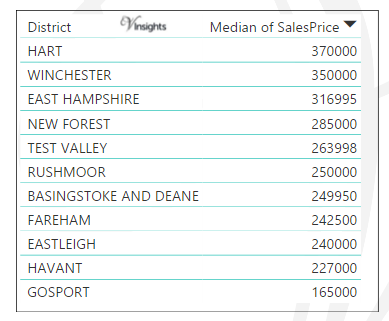
Across districts the median price is as above.
- Hart £370 K
- Winchester £350 K
- East Hampshire £317 K
- New Forest £285 K
- Test Valley £264 K
- Rushmoor £250 K
- Basingstoke And Deane £250 K
- Fareham £243 K
- EastLeigh £240 K
- Havant £227 K
- Gosport £165 K
New Vs Not New Property Statistics
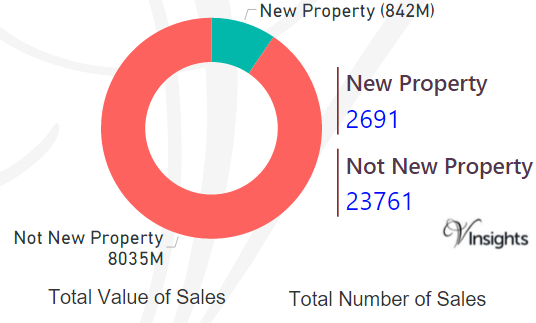 By Sales Values the split is as follows:
- New Property contributed £842 millions (9.49%)
- Not New Property contributed £8.04 billions (90.51%)
By Total Number the split is as follows:
- New properties sold were 2,691 (10.17%)
- Not new property sold were 23,761 (89.83%).
All Hampshire Posts

0b447b83-22fa-4fd4-9c57-e2bdcd7872b9|0|.0|27604f05-86ad-47ef-9e05-950bb762570c