For 2016 details - Sutton Property Market 2016
Story Highlights
- Sutton had total Property Sales of £1.34 billions in 2015.
- The total number of properties sold in year 2015 was 3498.
- The Average property price was £382 K in Sutton while Median was £318 K .
-
Not New Property Contributed £1.28 billion (96.03%) and New Property 53 millions (3.97%) giving combined total of £1.34 billions .
-
The number of Not New Property sold was 3346 (95.65%), whereas the number of New Property sold was 152 (4.35%) giving combined total of 3498.
Total Sales By Property Type
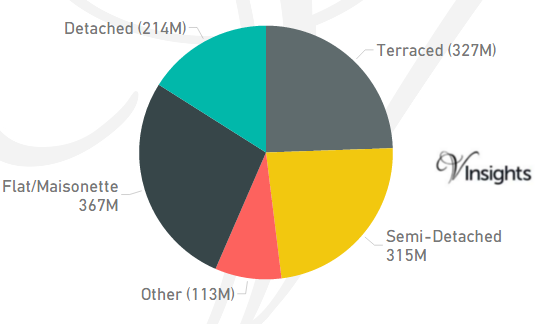
Sutton is one of the Boroughs of South London. It had total Property Sales of £1.34 billions which was 9.07% of South London Property Market 2015.
The split across the different property types are:
- Terraced £327 millions (24.46%)
- Semi-Detached £315 millions (23.59%)
- Other £113 millions (8.47%)
- Flat/Maisonette £367 millions (27.46%)
- Detached £214 millions (16.03%)
Total No Of Properties Sold By Property Type
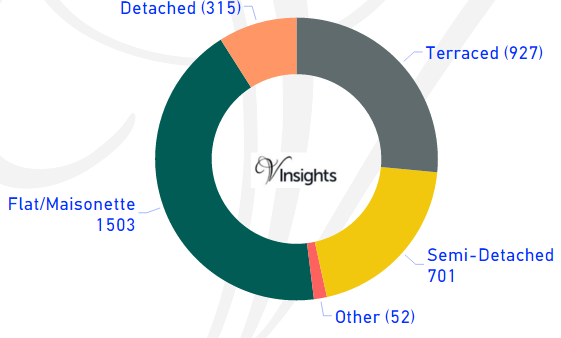
In Sutton the total number of properties sold in year 2015 was 3498.
The breakdown by different property types are:
- Terraced 927 (26.5%)
- Semi-Detached 701 (20.04%)
- Other 52 (1.49%)
- Flat/Maisonette 1503 (42.97%)
- Detached 315 (9.01%)
Average & Median Sales Price
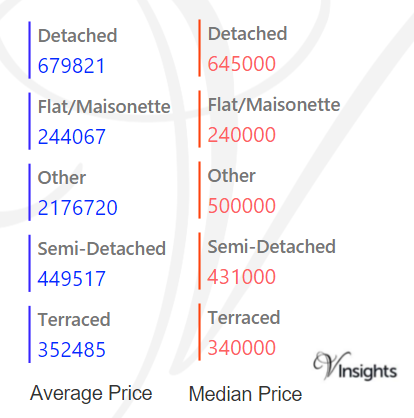
In 2015 the Average property price was £382 K in Sutton. The average price for the different property types are:
- Detached £680 K
- Flat/Maisonette £244 K
- Other £2.18 millions
- Semi-Detached £450 K
- Terraced £352 K
The Median Price was £318 K.The median property price for the different property types are:
- Detached £645 K
- Flat/Maisonette £240 K
- Other £500 K
- Semi-Detached £431 K
- Terraced £340 K
New Vs Not New Property Statistics
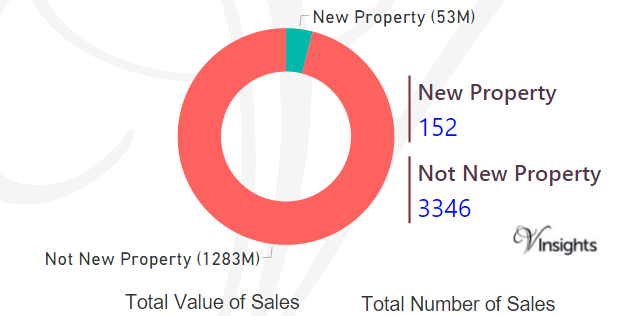
By Value Of Sales:
- Not New Property contributed £1.28 billion (96.03%)
- New Property 53 millions (3.97%) giving combined total of £1.34 billions .
By Number Of Sales
- The number of Not New Property sold was 3346 (95.65%)
- The number of New Property sold was 152 (4.35%) giving combined total of 3498.
All London Posts
29ec46cf-e9db-4a03-8bfc-3cd6ac8bf67d|0|.0|27604f05-86ad-47ef-9e05-950bb762570c
For 2016 details - Southwark Property Market 2016
Story Highlights
- Southwark had total Property Sales of £2.9 billions in 2015.
- The total number of properties sold in year 2015 was 4600.
- The Average property price was £637 K while Median was £470 K.
-
Not New Property contributed £2.42 billions (82.55%) and New Property 511 millions (17.45%) giving combined total of £2.9 billions.
-
The number of Not New Property sold was 3779 (82.15%), whereas the number of New Property sold was 821 (17.85%) giving combined total of 4600.
Total Sales By Property Type
Southwark is one of the Boroughs of Central London. It had total Property Sales of £2.9 billions which was 10.47% of Central London Property Market 2015.
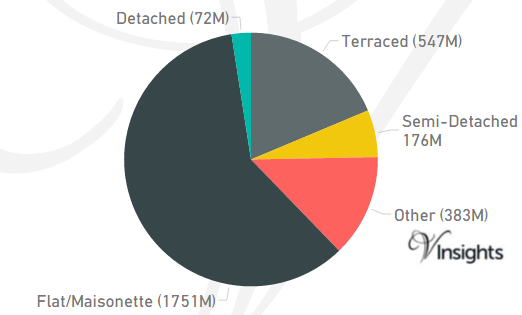
The split across the different property types are:
- Terraced £547 millions (18.68%)
- Semi-Detached £176 millions (6.02%)
- Other £383 millions (13.08%)
- Flat/Maisonette £1.75 billions (59.76%)
- Detached £72 millions (2.47%)
Total No Of Properties Sold By Property Type
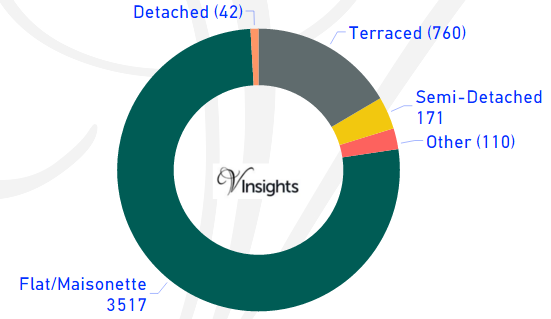
In Southwark the total number of properties sold in year 2015 was 4600. The breakdown by different property types are:
- Terraced 760 (16.52%)
- Semi-Detached 171 (3.72%)
- Other 110 (2.39%)
- Flat/Maisonette 3517 (76.46%)
- Detached 42 (0.91%)
Average & Median Sales Price
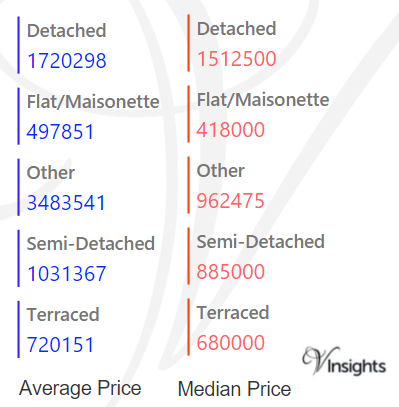
In 2015 the Average property price was £637 K in Southwark. The average price for the different property types are:
- Detached £1.72 millions
- Flat/Maisonette £498 K
- Other £3.5 millions
- Semi-Detached £1.03 million
- Terraced £720 K
The Median Price was £470 K. The median property price for the different property types are:
- Detached £1.5 millions
- Flat/Maisonette £418 K
- Other £962 K
- Semi-Detached £885 K
- Terraced £680 K
New Vs Not New Property Statistics
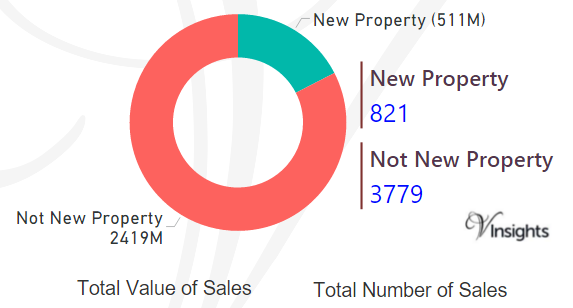
By Value Of Sales
- Not New Property contributed £2.42 billions (82.55%)
- New Property 511 millions (17.45%) giving combined total of £2.9 billions.
By Number Of Sales
- The number of Not New Property sold was 3779 (82.15%)
- The number of New Properties sold was 821 (17.85%) giving combined total of 4600.
All London Posts
01b86b10-4a32-413d-bfc3-4e7825acfd38|0|.0|27604f05-86ad-47ef-9e05-950bb762570c
For 2016 details - Richmond Upon Thames Property Market 2016
Story Highlights
- Richmond Upon Thames had total Property Sales of £2.76 billions in 2015
- The total number of properties sold in year 2015 was 3437
- The Average property price was £804 K while Median was was £573 K
- Not New Property contributed 97.5% and New Property 2.5% by sales value
Total Sales By Property Type
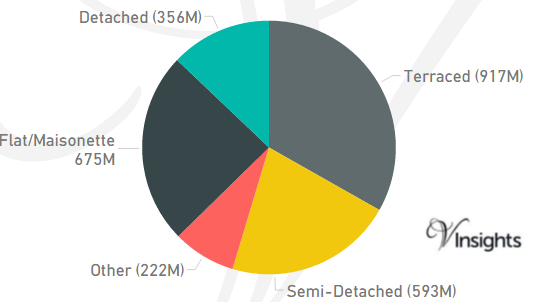
Richmond Upon Thames is one of the Boroughs of West London. It had total Property Sales of £2.76 billions which was 17.85% of West London Property Market 2015.
The split across the different property types are:
- Terraced £917 millions (33.2%)
- Semi-Detached £593 millions (21.45%)
- Other £222 millions (8.02%)
- Flat/Maisonette £675 millions (24.43%)
- Detached £356 millions (12.9%).
Total Number Of Sales By Property Types
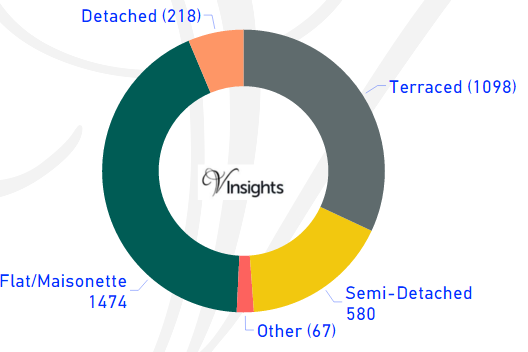
In Richmond Upon Thames the total number of properties sold in year 2015 was 3437. The breakdown by different property types are:
- Terraced 1098 (31.95%)
- Semi-Detached 580 (16.88%)
- Other 67 (1.95%)
- Flat/Maisonette 1474 (42.89%)
- Detached 218 (6.34%).
Average & Median Sales Price
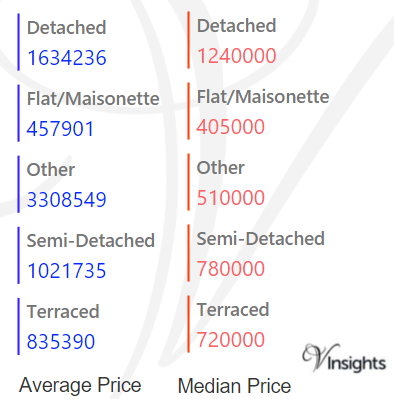
In 2015 the Average property price was £804 K in Richmond Upon Thames. The average property price for the different property types are:
- Detached £1.63 million
- Flat/Maisonette £458 K
- Other £3.3 millions
- Semi-Detached £1.02 million
- Terraced £835 K.
The Median property price was £573 K. The median property price for the different property types are:
- Detached £1.24 million
- Flat/Maisonette £405 K
- Other £510 K
- Semi-Detached £780 K
- Terraced £720 K.
New Vs Not New Property Statistics
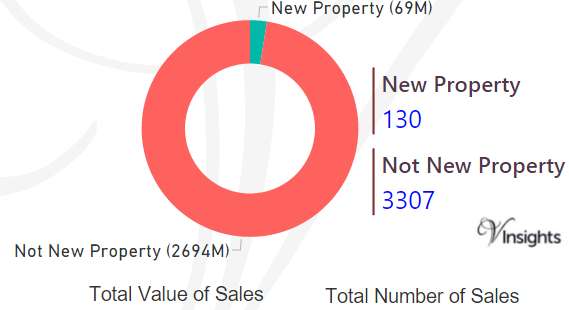
By Value Of Sales
- Not New Property Contributed £2.69 billion (97.5%)
- New Property 69 millions (2.5%) giving combined total of £2.76 billions.
By Number Of Sales
- The number of Not New Property sold was 3307 (96.22%)
- whereas the number of New Properties sold was 130 (3.78%) giving combined total of 3437.
All London Posts
dab44adc-75e8-429e-a746-30c837496ae0|0|.0|27604f05-86ad-47ef-9e05-950bb762570c
For 2016 details - Redbridge Property Market 2016
Story Highlights
- Redbridge had total Property Sales of £1.44 billions in 2015
- The total number of properties sold in year 2015 was 3664
- The Average property price was £393 K while Median was £345 K
- Not New Property contributed 96.78% by value and New Property 3.22%
Total Sales By Property Type
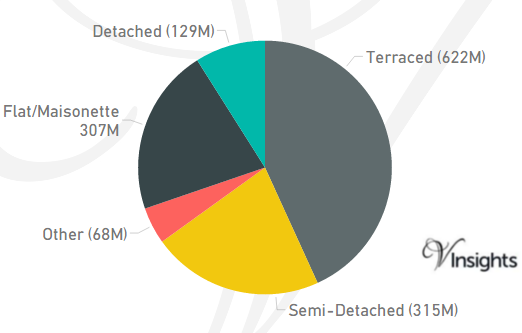
Redbridge is one of the Boroughs of East London. It had total Property Sales of £1.44 billions which was 8.81% of East London Property Market 2015.
The split across the different property types are:
- Terraced £622 millions (43.19%)
- Semi-Detached £315 millions (21.87%)
- Other £68 millions (4.69%)
- Flat/Maisonette £307 millions (21.28%)
- Detached £129 millions (8.97%).
Total No Of Properties Sold By Property Type
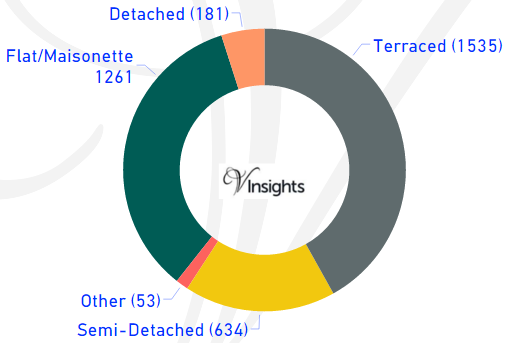
In Redbridge the total number of properties sold in year 2015 was 3664. The breakdown by different property types are:
- Terraced 1535 (41.89%)
- Semi-Detached 634 (17.3%)
- Other 53 (1.45%)
- Flat/Maisonette 1261 (34.42%)
- Detached 181 (4.94%).
Average & Median Sales Price
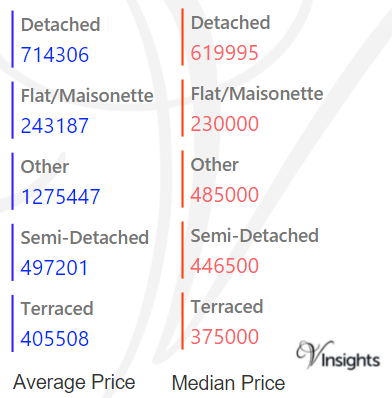
In 2015 the Average property price was £393 K in Redbridge. The average price for the different property types are:
- Detached £714 K
- Flat/Maisonette £243 K
- Other £1.28 millions
- Semi-Detached £497 K
- Terraced £406 K.
The Median Price was £345 K. The median property price for the different property types are:
- Detached £620 K
- Flat/Maisonette £230 K
- Other £485 K
- Semi-Detached £447 K
- Terraced £375 K.
New Vs Not New Property Statistics
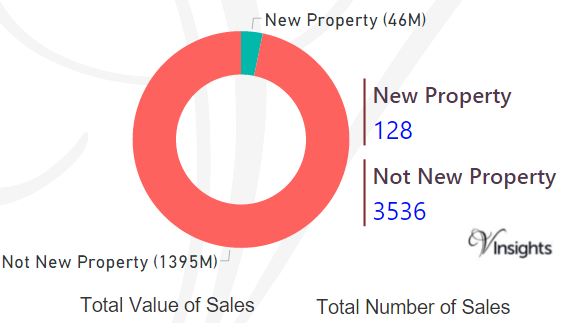
By Value Of Sales
- Not New Property contributed £1.4 billion (96.78%)
- New Property 46 millions (3.22%) giving combined total of £1.44 billions.
By Number Of Sales
- The number of Not New Property sold was 3536 (96.51%)
- The number of New Properties sold was 128 (3.49%) giving combined total of 3664.
All London Posts
9e2cc264-42bb-436b-8e08-bffe2a419da2|0|.0|27604f05-86ad-47ef-9e05-950bb762570c
For 2016 details - Newham Property Market 2016
Story Highlights
- Newham had total Property Sales of £1.2 billions in 2015.
- The total number of properties sold in year 2015 was 3434.
- The Average property price was £348 K while Median was £305 K.
- Not New Property Contributed 84.89% by value and New Property 15.11%
Total Sales By Property Type
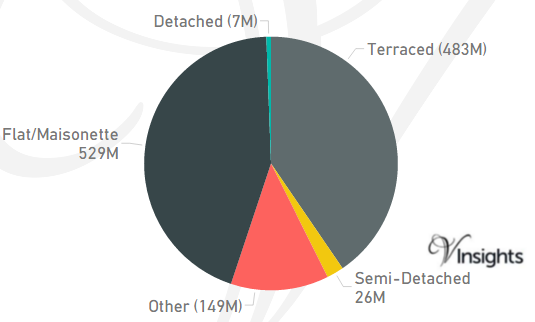
Newham is one of the Boroughs of East London. It had total Property Sales of £1.2 billions which was 7.3% of East London Property Market 2015.
The split across the different property types are:
- Terraced £483 millions (40.46%)
- Semi-Detached £26 millions (2.17%)
- Other £149 millions (12.48%)
- Flat/Maisonette £529 millions (44.3%)
- Detached £7 millions (0.59%).
Total No Of Properties Sold By Property Type
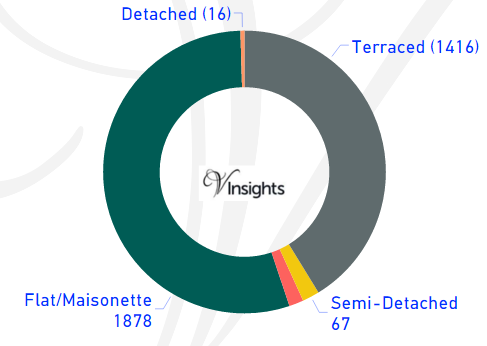
In Newham the total number of properties sold in year 2015 was 3434. The breakdown by different property types are:
- Terraced 1416 (41.23%)
- Semi-Detached 67 (1.95%)
- Other 57 (1.66%)
- Flat/Maisonette 1878 (54.69%)
- Detached 16 (0.47%).
Average & Median Sales Price
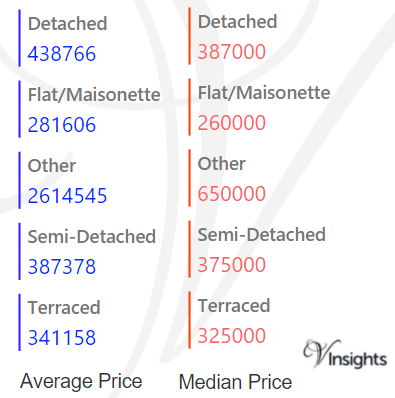
In 2015 the Average property price was £348 K in Newham. The average price for the different property types are:
- Detached £439 K
- Flat/Maisonette £282 K
- Other £2.6 millions
- Semi-Detached £387 K
- Terraced £341 K.
The Median Price was £305 K. The median property price for the different property types are:
- Detached £387 K
- Flat/Maisonette £260 K
- Other £650 K
- Semi-Detached £375 K
- Terraced £325 K.
New Vs Not New Property Statistics
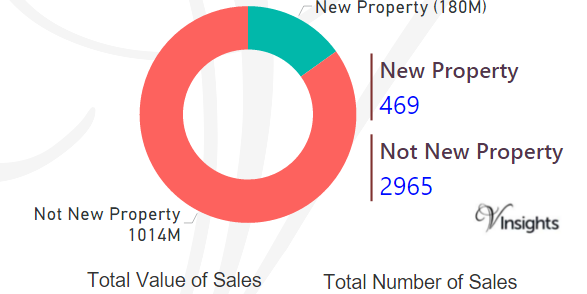
By Value Of Sales
- Not New Property contributed £1.01 billion (84.89%)
- New Property 180 millions (15.11%) giving combined total of £1.2 billions.
By Number Of Sales
- The number of Not New Property sold was 2965 (86.34%)
- The number of New Properties sold was 469 (13.66%) giving combined total of 3434.
All London Posts
3726dad9-1a31-4293-995d-f56738a55937|0|.0|27604f05-86ad-47ef-9e05-950bb762570c