For 2016 details - Berkshire Property Market 2016
Story Highlights
- Berkshire had total property sales of £6.74 Billions in 2015
- Across the districts maximum sales was in Wokingham at £1.46 billions
- The total number of properties sold in 2015 was 16,311 properties
- The average sales price in Berkshire was £413 K, whereas median was £307 K
- Across its districts average sales price was maximum for Windsor And Maidenhead at £550 K
- New Property sales were 12.25% by value, where as Not New Property contributed 87.75 %
Berkshire is one of the counties of South East England. The districts of Berkshire are Wokingham, Windsor And Maidenhead, Reading, West Berkshire, Bracknell Forest, Slough. Let us look at the Berkshire Property Market for 2015 in detail.
Total Sales By Districts
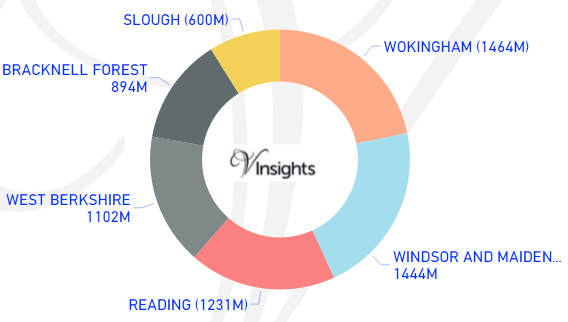
Berkshire had total property sales of £6.74 Billions which was 10.99% of the total South East property Market in 2015.
The split of the sales across the different districts was:
- Wokingham £1.5 billions (21.74%)
- Windsor And Maidenhead £1.44 billions (21.44%)
- Reading £1.2 billions (18.28%)
- West Berkshire £1.1 billions (16.36%)
- Bracknell Forest £894 millions (13.27%)
- Slough £600 millions (8.9%)
Total Sales By Property Type
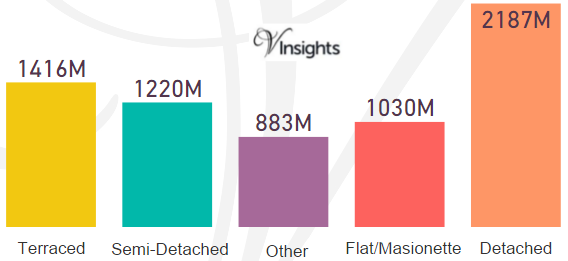
The split across the different property types in Berkshire are:
- Terraced £1.42 billions (21.02%)
- Semi-Detached £1.22 billions (18.11%)
- Other £883 millions (13.11%)
- Flat/Maisonette £1.03 billions (15.28%)
- Detached £2.19 billions (32.47%)
Total No Of Properties Sold By Property Type
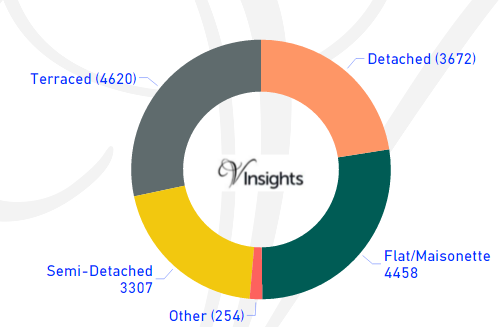
Berkshire had total property sales of 16,311. The split across the different property types are:
- Detached 3672 (22.51%)
- Flat/Maisonette 4458 (27.33%)
- Other 254 (1.56%)
- Semi-Detached 3307 (20.27%)
- Terraced 4620 (28.32%)
Average & Median Sales Price
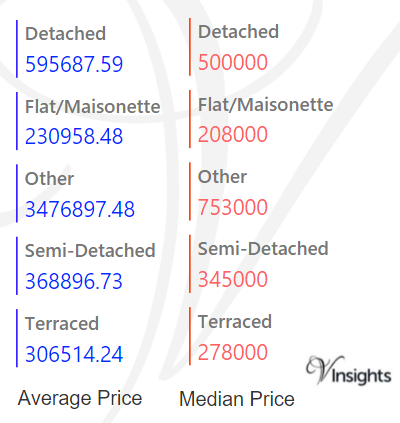
The average sales price in Berkshire was £413 K and for the different property types it was:
- Detached £596 K
- Semi-Detached £369 K
- Terraced £307 K
- Flat/Maisonette £231 K
- Other it is £3.48 million
Similarly median sales price in Berkshire was £307 K and for different property types are:
- Detached £500 K
- Semi-Detached £345 K
- Terraced £278 K
- Flat/Maisonette £208 K
- Other it is £753 k
Average & Median Sales Price By Districts
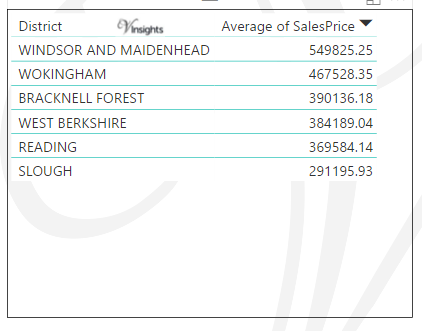
Across districts the average sales price is as above.
- Windsor And Maidenhead £550 K
- Wokingham £468 K
- Bracknell Forest £390 K
- West Berkshire £384 K
- Reading £370 K
- Slough £291 K
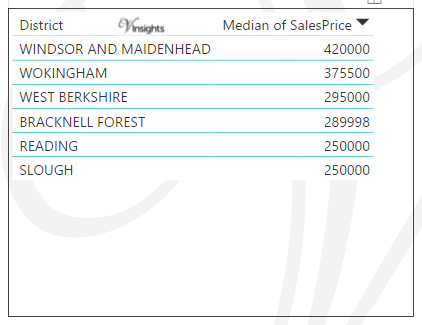
Across districts the median sales price is as above.
- Windsor And Maidenhead £420 K
- Wokingham £376 K
- West Berkshire £295 K
- Bracknell Forest £290 K
- Reading £250 K
- Slough £250 K
New Vs Not New Property Statistics
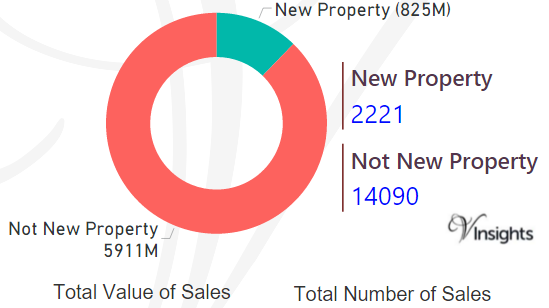
By Sales Values the split is as follows:
- New Property contributed £825 millions (12.25%)
- Not New Property contributed £5.9 billions (87.75%)
By Total Number the split is as follows:
- New properties sold were 2,221 (13.62%)
- Not new property sold were 14,090(86.38%)
All Berkshire Posts

5a8caff7-1c38-4862-88cb-dc544d792fd8|0|.0|27604f05-86ad-47ef-9e05-950bb762570c
Story Highlights
- Surrey had total property sales of £11.16 Billions in 2015
- The total number of properties sold in 2015 was 22,170.
- The average sales price in Surrey was £503.67 K, whereas median was £375 K
- Across its districts average sales price in Surrey was maximum for Elmbridge at £748 K and was minimum for Spelthrone £385 K
- Similarly the median sales price in Surrey was maximum for Elmbridge £501 K and was minimum for Woking £340 K
- New Property sales were 6.69% by value, where as Not New Property contributed 93.31%
Surrey is one of the counties of South East England. The districts of Surrey are Elmbridge, Reigate and Banstead, Guildford, Waverley, Working, Mole Valley, Tandridge, Runnymede, Surrey Heath, Spelthorne, Epsom and Ewell. Let us look at the Surrey Property Market in 2015 in detail.
Total Sales By Districts
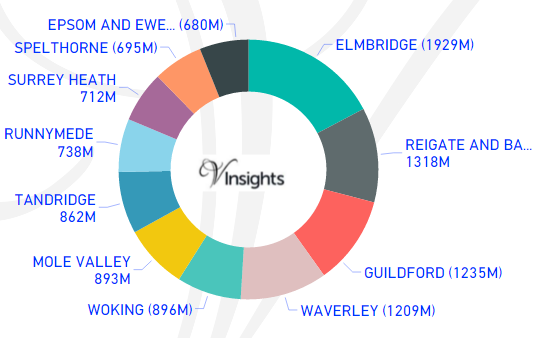
Surrey had total property sales of £11.16 Billions which was 18.23% of the total South East property Market in 2015.
The split of the sales across the different districts was:
- Elmbridge £1.93 billions (17.28%)
- Reigate and Banstead £1.32 billions (11.8%)
- Guildford £1.24 billions (11.06%)
- Waverley £1.21 billions (10.83%)
- Woking £896 millions (8.03%)
- Mole Valley £893 millions (7.99%)
- Tandridge £862 millions (7.72%)
- Runnymede £738 millions (6.61%)
- Surrey Heath £712 millions (6.37%)
- Spelthorne £695 millions (6.22%)
- Epsom and Ewell £680 millions (6.09%)
Total Sales By Property Type
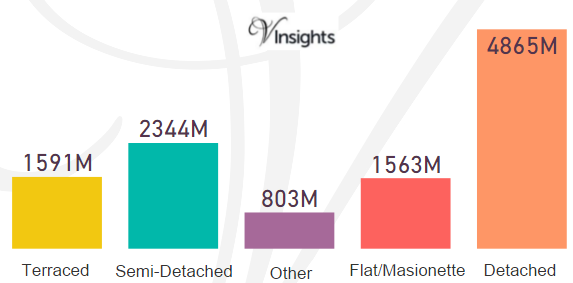
The split across the different property types in Surrey are:
- Terraced £1.59 billions (14.25%)
- Semi-Detached £2.34 billions (20.99%)
- Other £803 millions (7.19%)
- Flat/Maisonette £1.56 billions (14%)
- Detached £4.87 billions (43.57%)
Total No Of Properties Sold By Property Type
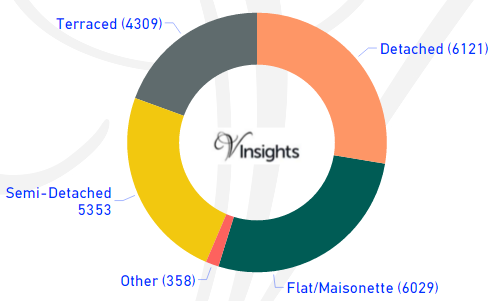
Surrey had total property sales of 22,170. The split across the different property types are:
- Detached 6121 (27.61%)
- Flat/Maisonette 6029 (27.19%)
- Other 358 (1.61%)
- Semi-Detached 5353 (24.15%)
- Terraced 4309 (19.44%)
Average & Median Sales Price
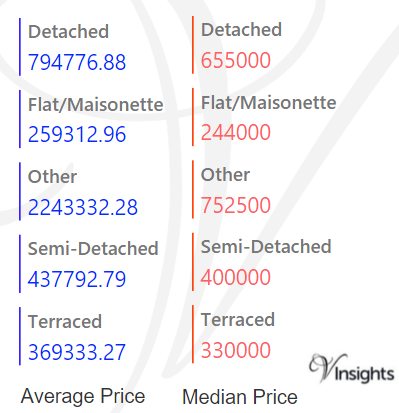
The average sales price in Surrey was £503.67 K and for the different property types it was:
- Detached £795 K
- Semi-Detached £438 K
- Terraced £369 K
- Flat/Maisonette £259 K
- Other it is £2.24 million
Similarly median sales price in Surrey was £375 K and for different property types are:
- Detached £655 K
- Semi-Detached £400 K
- Terraced £330 K
- Flat/Maisonette £244 K
- Other it is £753 k
Average & Median Sales Price By Districts
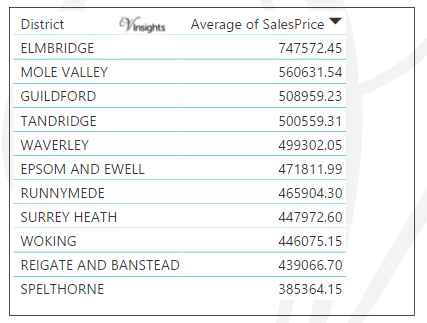
Across districts the average price is as above.
- Elmbridge £748 K
- Mole Valley £561 K
- Guildford £509 K
- Tandridge 501 K
- Waverley £499 K
- Epsom and Ewell £472 K
- Runnymede £466 K
- Surrey Heath £448 K
- Woking £446 K
- Reigate And Banstead £439 K
- Spelthorne £385 K
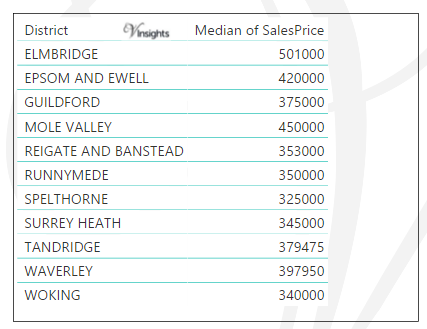
Across districts the median price is as above.
- Elmbridge £501 K
- Mole Valley £450 K
- Epsom and Ewell £420 K
- Guildford £375 K
- Reigate And Banstead £353 K
- Runnymede £350 K
- Spelthorne £325 K
- Surrey Heath £345 K
- Tandridge £380 K
- Waverley £398 K
- Woking £340 K
New Vs Not New Property Statistics
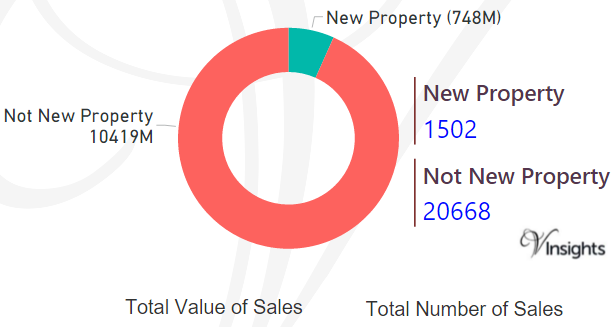
By Sales Values the split is as follows:
- New Property contributed £748 millions (6.69%)
- Not New Property contributed £10.42 billions (93.31 %)
By Total Number the split is as follows:
- New properties sold were 1,502 (6.77%)
- Not new property sold were 20,668 (93.23%)
All Surrey Posts
83057dc6-7f3b-42e9-8d48-6cda691ded8c|0|.0|27604f05-86ad-47ef-9e05-950bb762570c
For 2016 details - Wandsworth Property Market 2016
Story Highlights
- Wandsworth had total Property Sales of £4.6 billions in 2015.
- The total number of properties sold in year 2015 was 6487.
- The Average property price was £703 K while Median was £556 K.
-
Not New Property Contributed £3.72 billion (81.72%) and New Property 833 millions (18.28%) giving combined total of £4.6 billions .
-
The number of Not New Property sold was 5241 (80.79%), whereas the number of New Property sold was 1246 (19.21%) giving combined total of 6487.
Total Sales By Property Type
Wandsworth is one of the Boroughs of South London. It had total Property Sales of £4.6 billions which was 30.94% of South London Property Market 2015.
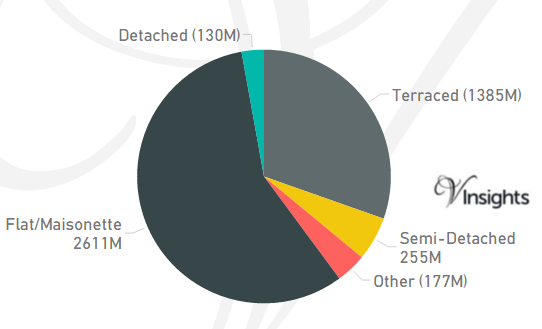
The split across the different property types are:
- Terraced £1.39 billion (30.39%)
- Semi-Detached £255 millions (5.6%)
- Other £177 millions (3.88%)
- Flat/Maisonette £2.6 billions (57.29%)
- Detached £130 millions (2.84%)
Total No Of Properties Sold By Property Type
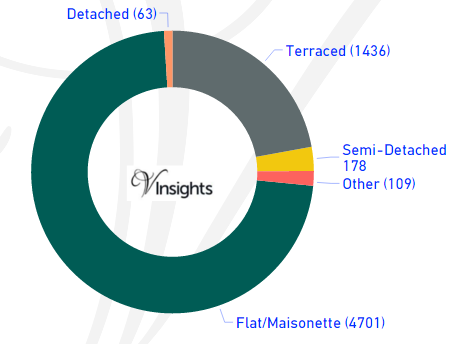
In Wandsworth the total number of properties sold in year 2015 was 6487.
The breakdown by different property types are:
- Terraced 1436 (22.14%)
- Semi-Detached 178 (2.74%)
- Other 109 (1.68%)
- Flat/Maisonette 4701 (72.47%)
- Detached 63 (0.97%)
Average & Median Sales Price
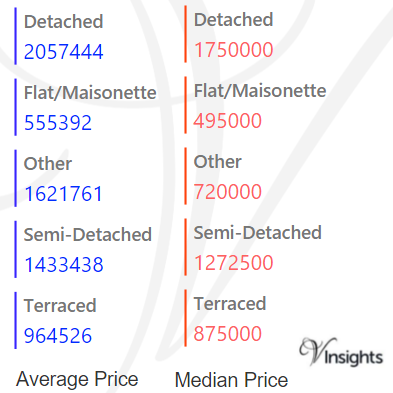
In 2015 the Average property price was £703 K in Wandsworth. The average price for the different property types are:
- Detached £2.06 millions
- Flat/Maisonette £555 K
- Other £1.62 millions
- Semi-Detached £1.4 millions
- Terraced £965 K
The Median Price was £556 K.The median property price for the different property types are:
- Detached £1.75 millions
- Flat/Maisonette £495 K
- Other £720 K
- Semi-Detached £1.27 millions
- Terraced £875 K.
New Vs Not New Property Statistics
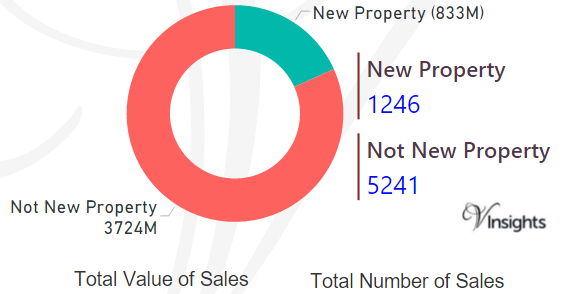
By Value Of Sales
- Not New Property contributed £3.72 billion (81.72%)
- New Property 833 millions (18.28%) giving combined total of £4.6 billions .
By Number Of Sales
- The number of Not New Property sold was 5241 (80.79%)
- The number of New Property sold was 1246 (19.21%) giving combined total of 6487.
All London Posts
1b5f751a-1398-4434-96fc-9ef0120dff12|0|.0|27604f05-86ad-47ef-9e05-950bb762570c
For 2016 details - Waltham Forest Property Market 2016
Story Highlights
- Waltham Forest had total Property Sales of £1.51 billions in 2015.
- The total number of properties sold in year 2015 was 3837.
- The Average property price was £393 K while Median was £365 K .
- Not New Property contributed 94.69% by value and New Property 5.31%
Total Sales By Property Type
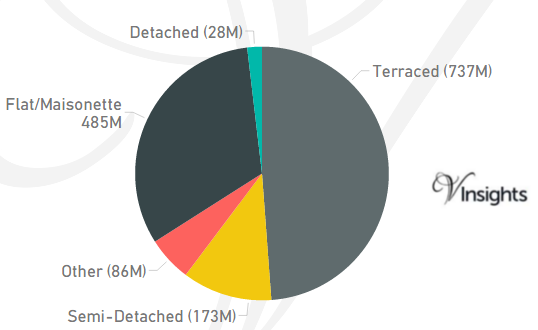
Waltham Forest is one of the Boroughs of East London. It had total Property Sales of £1.51 billions, which was 9.22% of East London Property Market 2015.
The split across the different property types are:
- Terraced £737 millions (48.82%)
- Semi Detached 173 millions (11.45%)
- Other £86 millions (5.71%)
- Flat/Maisonette £485 millions (32.15%)
- Detached £28 millions (1.87%).
Total No Of Properties Sold By Property Type
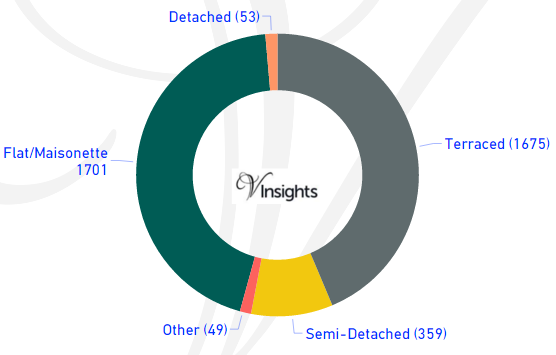
In Waltham Forest the total number of properties sold in year 2015 was 3837. The breakdown by different property types are:
- Terraced 1675 (43.65%)
- Semi Detached 359 (9.36%)
- Other 49 (1.28%)
- Flat/Maisonette 1701 (44.33%)
- Detached 53 (1.38%)
Average & Median Sales Price
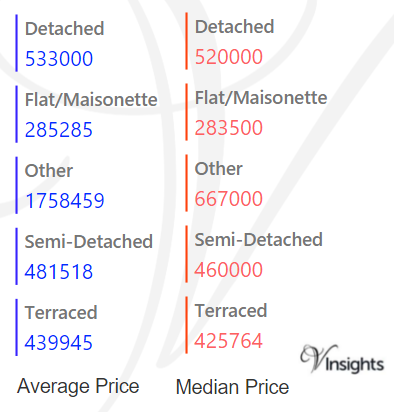
In 2015 the Average property price was £393 K in Waltham Forest. The average price for the different property types are:
- Detached £533 K
- Flat/Maisonette £285 K
- Other £1.76 millions
- Semi-Detached £482 K
- Terraced £440 K.
The Median Price was £365 K. The median property price for the different property types are:
- Detached £520 K
- Flat/Maisonette £284 K
- Other £667 K
- Semi-Detached £460 K
- Terraced £426 K.
New Vs Not New Property Statistics
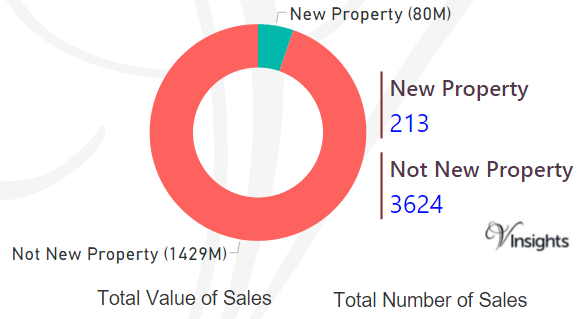
By Value Of Sales
- Not New Property contributed £1.43 billion (94.69%)
- New Property 80 millions (5.31%) giving combined total of £1.51 billions.
By Number Of Sales
- The number of Not New Property sold was 3624 (94.45%)
- The number of New Properties sold was 213 (5.55%) giving combined total of 3837.
All London Posts
f9a4b0ec-f0fa-43cb-a430-af74540a028a|0|.0|27604f05-86ad-47ef-9e05-950bb762570c
For 2016 details - Tower Hamlets Property Market 2016
Story Highlights
- Tower Hamlets had total Property Sales of £2.6 billions in 2015
- The total number of properties sold in year 2015 was 4597
- The Average property price was £557 K while Median was £418 K
- Not New Property contributed 82.18% by value and New Property 17.82%
Total Sales By Property Type
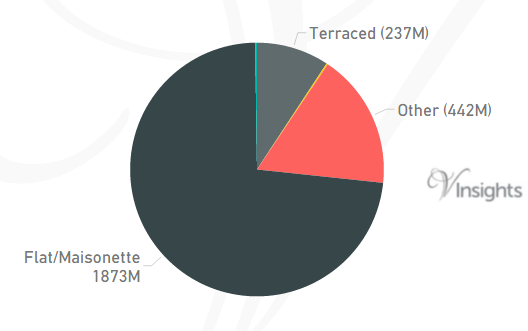
Tower Hamlets is one of the Boroughs of East London. It had total Property Sales of £2.6 billions which was 15.66% of East London Property Market 2015.
The split across the different property types are:
- Terraced £237 millions (9.24%)
- Other £442 millions (17.25%)
- Flat/Maisonette £1.87 billions (73.08%)
- Detached £5.98 millions (0.23%)
Total No Of Properties Sold By Property Type
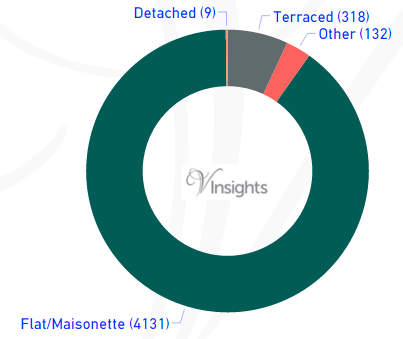
In Tower Hamlets the total number of properties sold in year 2015 was 4597. The breakdown by different property types are:
- Terraced 318 (6.92%)
- Other 132 (2.87%)
- Flat/Maisonette 4131 (89.86%)
- Detached 9 (0.2%).
Average & Median Sales Price
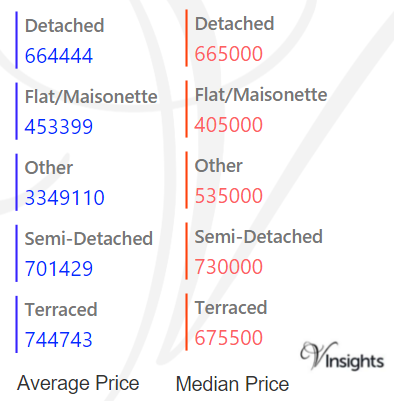
In 2015 the Average property price was £557 K in Tower Hamlets. The average price for the different property types are:
- Detached £664 K
- Flat/Maisonette £453 K
- Other £3.35 millions
- Semi-Detached £701 K
- Terraced £745 K.
The Median Price was £418 K. The median price for the different property types are:
- Detached £665 K
- Flat/Maisonette £405 K
- Other £535 K
- Semi-Detached £730 K
- Terraced £676 K.
New Vs Not New Property Statistics
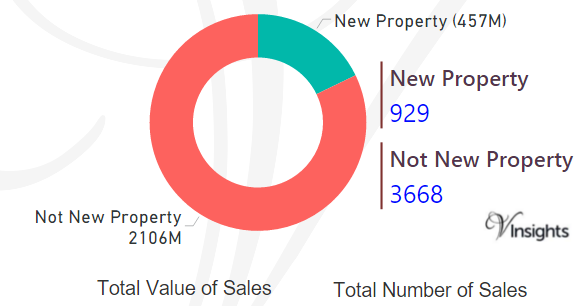
By Value Of Sales
- Not New Property contributed £2.1 billion (82.18%)
- New Property 457 millions (17.82%) giving combined total of £2.6 billions.
By Number Of Sales
- The number of Not New Property sold was 3668 (79.79%)
- The number of New Properties sold was 929 (20.21%) giving combined total of 4597.
All London Posts
82504cd4-237e-41ee-a5b8-4a1af6a2f283|0|.0|27604f05-86ad-47ef-9e05-950bb762570c