Please click here for the updated version of this post
This Post covers
- Coverage Area of Postcode UB1 to UB6
- Total Sales By Postcode UB1 to UB6
- Average & Median Sales Price By Postcode UB1 to UB6
- Total Number of Sales By Postcode UB1 to UB6
- Multi Year Property Trend Analysis By Postcode UB1 to UB6
- Schools for Postcode Area UB
- Posts for Postcode Area UB
Coverage Area of Postcode UB1 to UB6
Total Sales By Postcode UB1 to UB6 in 2016
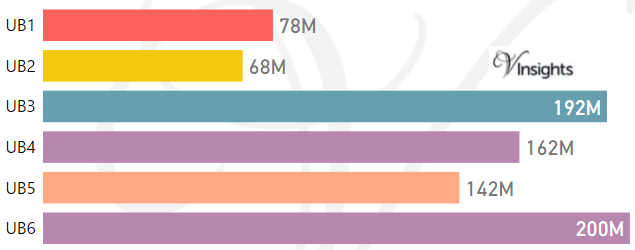
The Total Sales by the Postcodes are:
- UB1 £78 millions, UB2 £68 millions , UB3 £192 millions
- UB4 £162 millions, UB5 £142 millions , UB6 £200 millions
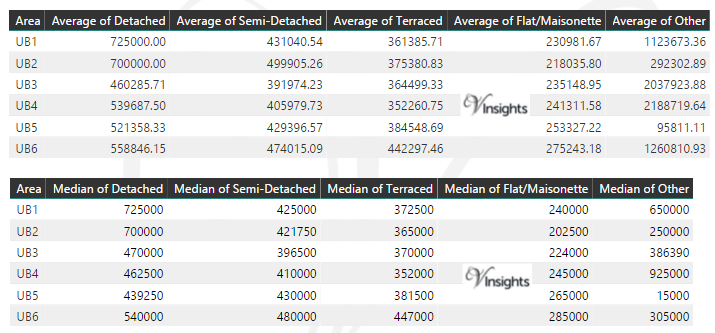
Average & Median Sales Price By Postcode in 2016
Total Number Of Sales By Postcode in 2016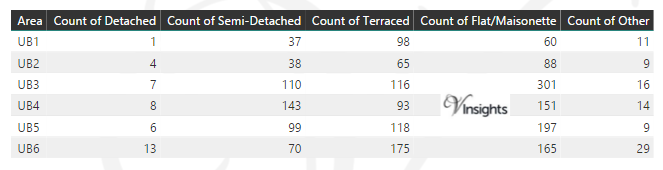
Multi Year Property Trend Analysis By Postcode
Schools for Postcode Area UB
Posts for Postcode Area UB
All Postcode Area Posts

Reference
UB Postcode Area As Per Wikipedia
9607f20d-d039-47bc-99c2-1a9e6057c8c6|0|.0|27604f05-86ad-47ef-9e05-950bb762570c
Story Highlights
- Richmond Upon Thames had total Property Sales of £2.55 billions in 2016
- The total number of properties sold in year 2016 was 3,057
- The Average property price was £835 K, while Median was £600 K
- Not New Property contributed 96.46% and New Property 3.54% by sales value
- Stamp duty changes caused monthly spike in March
- Brexit coupled with Stamp Duty changes caused significant decline of 7.6% in total sales over 2015
Richmond Upon Thames is one of the Boroughs of West London. It had total Property Sales of £2.55 billions which was 18.18% of West London Property Market 2016.
Total Sales By Property Type
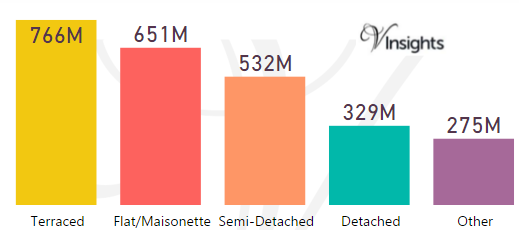
The split of £2.55 billions across the different property types are:
- Terraced £766 millions (30%)
- Flat/Maisonette £651 millions (25.5%)
- Semi-Detached £532 millions (20.83%)
- Detached £329 millions (12.88%).
- Other £275 millions (10.79%)
Year on Year Comparison : Compared to Richmond Upon Thames Property Market 2015 in 2016
- All the property types have shown decline in sales except Other
- Others has shown growth of 23.9% in total sales value
- Total sales has declined by 7.6% compared to 2015
Richmond Upon Thames Property Market at Postcode Level
| Postcode |
Coverage Area
|
Local Authority Area |
| KT1 |
Kingston upon Thames, Hampton Wick, Norbiton
|
Kingston Upon Thames, Richmond upon Thames |
| KT2 |
Kingston upon Thames, Canbury, Coombe
|
Kingston Upon Thames, Richmond upon Thames |
| SW13 |
Barnes
|
Richmond Upon Thames,Merton |
| SW14 |
Mortlake, East Sheen
|
Richmond Upon Thames,Merton |
| SW15 |
Kingston Vale, Putney, Putney Heath, Putney Vale, Richmond Park, Roehampton, Roehampton Vale
|
Kingston Upon Thames, Richmond Upon Thames, Wandsworth,Merton |
| TW1 |
Twickenham, St. Margarets, Strawberry Hill (east)
|
Hounslow, Richmond upon Thames |
| TW2 |
Twickenham, Whitton, Strawberry Hill (west), Fulwell (north)
|
Richmond Upon Thames |
| TW3 |
Hounslow, Lampton, Whitton (north)
|
Hounslow, Richmond upon Thames |
| TW4 |
Hounslow West, Hounslow Heath, Whitton (west), Cranford (south)
|
Hounslow, Richmond upon Thames |
| TW7 |
Isleworth, Osterley (east and centre)
|
Hounslow, Richmond upon Thames |
| TW9 |
Richmond, Kew, North Sheen (north)
|
Richmond Upon Thames |
| TW10 |
Ham, Petersham, Richmond Hill, North Sheen (south), Richmond Park
|
Kingston Upon Thames, Richmond upon Thames |
| TW11 |
Teddington, Fulwell (east), Bushy Park
|
Richmond Upon Thames |
| TW12 |
Hampton, Hampton Hill, Fulwell (west)
|
Richmond Upon Thames |
| TW13 |
Feltham, Hanworth
|
Hounslow, Richmond upon Thames |
Month-wise Break-up of Total Sales
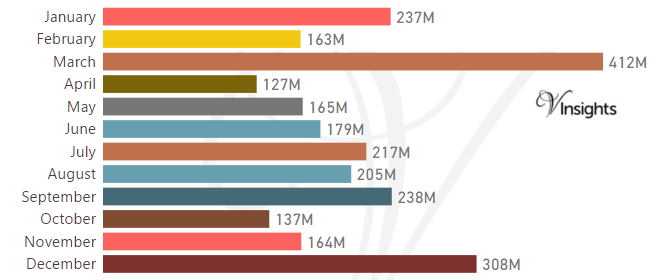
Stamp Duty Hike Impact
- March had property sale spike of £412 millions compared to £163 millions in Feb
- The impetus for it was to avoid the extra 3% in Stamp Duty Tax applicable on buying an additional home, being applicable from April 1 2016
Brexit Impact
- Brexit took place on 23rd June 2016.
- As can be observed from the month-wise break-up there does not seem to have dip in property sales in the immediate aftermath of Brexit
- Year on Year the property market for Richmond Upon Thames has declined by 7.6% over 2015
Total No Of Properties Sold By Property Type
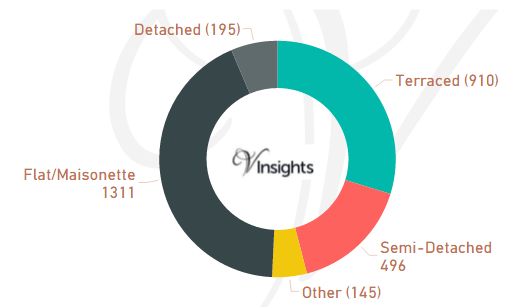
In Richmond Upon Thames the total number of properties sold in year 2016 was 3,057. The breakdown by different property types are:
- Terraced 910 (29.77%)
- Semi-Detached 496 (16.23%)
- Other 145 (4.74%)
- Flat/Maisonette 1,311 (42.89%)
- Detached 195 (6.38%).
Year on Year Comparison : Compared to Richmond Upon Thames Property Market 2015 in 2016
- Total number of property sales in Richmond Upon Thames has declined by 11.05%
- All property types have shown decline in number of properties sold except property type Other
- Other has shown significant growth of 116% over 2015
Average & Median Sales Price
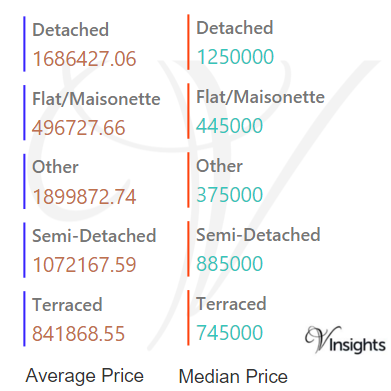
In 2016 the Average property price was £835 K in Richmond Upon Thames. The average property price for the different property types are:
- Detached £1.69 million
- Flat/Maisonette £497 K
- Other £1.9 millions
- Semi-Detached £1.07 million
- Terraced £842 K.
The Median property price was £600 K. The median property price for the different property types are:
- Detached £1.25 millions
- Flat/Maisonette £445 K
- Other £375 K
- Semi-Detached £885 K
- Terraced £745 K.
Year on Year Comparison : Compared to Richmond Upon Thames Property Market 2015 in 2016
- The average and median sales price across all property types have gone up except for Other
- Other has shown sharp decline in average and median sales price
New Vs Not New Property Statistics
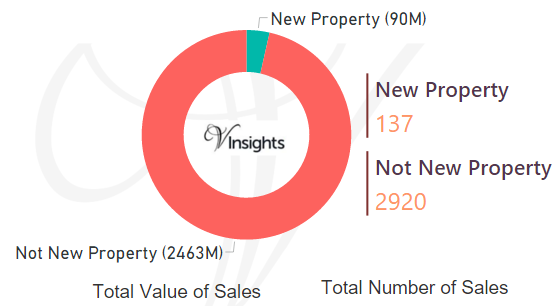
By Value Of Sales
- Not New Property contributed £2.5 billion (96.46%)
- New Property contributed £90 millions (3.54%)
By Number Of Sales
- The number of Not New Property sold was 2,920 (95.52%)
- whereas the number of New Properties sold was 137 (4.48%)
Year on Year Comparison : Compared to Richmond Upon Thames Property Market 2015 in 2016
- New property market share in property market has gone up in 2016 over 2015
All London Posts
acaebdec-4c1d-4400-90d3-15f6f780b9ee|0|.0|27604f05-86ad-47ef-9e05-950bb762570c
Story Highlights
- Hillingdon had total Property Sales of £1.8 billions in 2016
- The total number of properties sold in year 2016 was 3,600
- The average property price was £499 K, while median was £390 K
- Not New Property contributed 90.62% and New Property 9.38% by sales value
- Stamp duty changes caused monthly spike in March
- Brexit coupled with Stamp Duty changes caused decline of 5.56% in total sales compared to 2015
Hillingdon is one of the Boroughs of West London. It had total Property Sales of £1.8 billions which was 12.8% of West London Property Market 2016.
Total Sales By Property Type
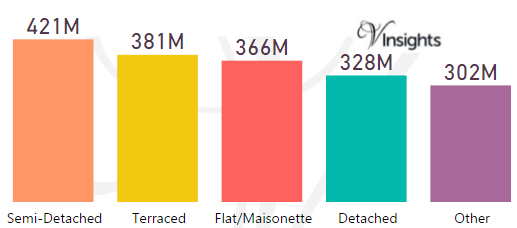
The split of £1.8 billions across the different property types are:
- Semi-Detached: £421 millions (23.42%)
- Terraced: £381 millions (21.2%)
- Flat/Maisonette: £366 millions (20.35%)
- Detached: £328 millions (18.23%).
- Other: £302 millions (16.8%)
Year on Year Comparison : Compared to Hillingdon Property Market 2015 in 2016
- All the property types have shown decline in sales except Other
- Others has shown growth of 1.34% in total sales value
- Total sales value decreased by 5.56% in 2016 over 2015
Hillingdon Property Market at Postcode level
| Postcode |
Coverage Area
|
Local Authority Area |
| HA4 |
Ruislip, Eastcote (west and south), South Ruislip, Ruislip Manor, Ruislip Gardens
|
Hillingdon, Harrow |
| HA5 |
Pinner, Eastcote (north and east), Hatch End, Rayners Lane (north), Carpenders Park (part) |
Harrow, Hillingdon, Three Rivers |
| HA6 |
Pinner, Eastcote (north and east), Hatch End, Rayners Lane (north), Carpenders Park (part) |
Hillingdon, Three Rivers |
| TW6 |
Heathrow Airport |
Hillingdon |
| UB3 |
Hayes (south), Harlington |
Hillingdon |
| UB4 |
Hayes (north), Yeading |
Hillingdon |
| UB5 |
Northolt |
Ealing, Harrow, Hillingdon |
| UB7 |
West Drayton, Harmondsworth, Sipson, Yiewsley, Longford |
Hillingdon |
| UB8 |
Uxbridge, Cowley, Hillingdon (part) |
Hillingdon |
| UB9 |
Denham, Harefield |
South Bucks, Hillingdon |
| UB10 |
Hillingdon, Ickenham |
Hillingdon |
| UB11 |
Stockley Park |
Hillingdon |
| WD3 |
Rickmansworth, Chorleywood, Croxley Green, Loudwater, Mill End, Maple Cross, Sarratt, Batchworth, Chenies, Harefield (part), West Hyde, Heronsgate, Chandler's Cross |
Three Rivers, Chiltern, Hillingdon |
Month-wise Break-up of Total Sales
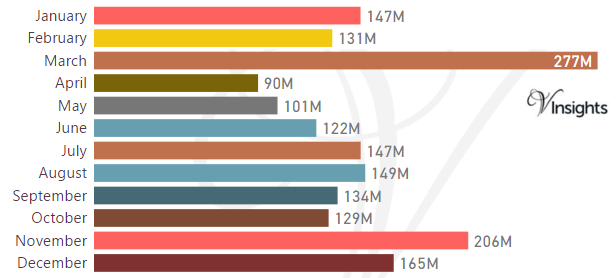
Stamp Duty Hike Impact
- March had property sale spike of £277 millions compared to £131 millions in Feb
- The impetus for it was to avoid the extra 3% in Stamp Duty Tax applicable on buying an additional home, being applicable from April 1 2016
Brexit Impact
- Brexit took place on 23rd June 2016.
- As can be observed from the month-wise break-up there does not seem to have been dip in property sales in the immediate aftermath of Brexit
- Total sales value decreased by 5.56% in 2016 over 2015
Total No Of Properties Sold By Property Type
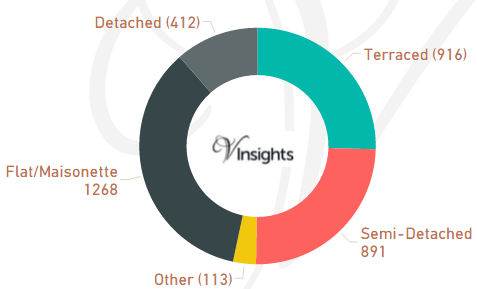
In Hillingdon the total number of properties sold in year 2016 was 3,600. The breakdown by different property types are:
- Terraced: 916 (25.44%)
- Semi-Detached: 891 (24.75%)
- Other: 113 (3.14%)
- Flat/Maisonette: 1,268 (35.22%)
- Detached: 412 (11.44%)
Year on Year Comparison : Compared to Hillingdon Property Market 2015 in 2016
- Total number of property sales in Hillingdon has declined by 12.71%
- All property types have shown decline in number of properties sold except property type Other
- Other has shown significant increase of 31.4%
Average & Median Sales Price
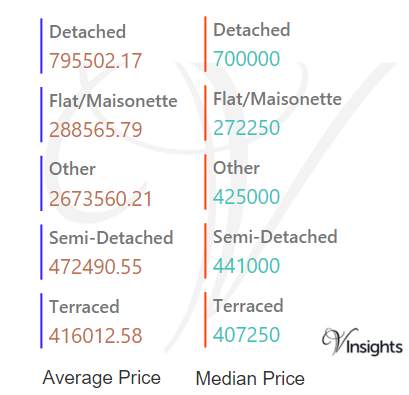
In 2016 the Average price was £499 K in Hillingdon. The average property price for the different property types are:
- Detached: £796 K
- Flat/Maisonette: £289 K
- Other: £2.67 millions
- Semi-Detached: £473 K
- Terraced: £416 K
The Median property price was £390 K. The median property price for the different property types are:
- Detached: £700 K
- Flat/Maisonette: £272 K
- Other: £425 K
- Semi-Detached: £441 K
- Terraced: £407 K
Year on Year Comparison : Compared to Hillingdon Property Market 2015 in 2016
- The average and median sales price across all property types have gone up except for others
New Vs Not New Property Statistics
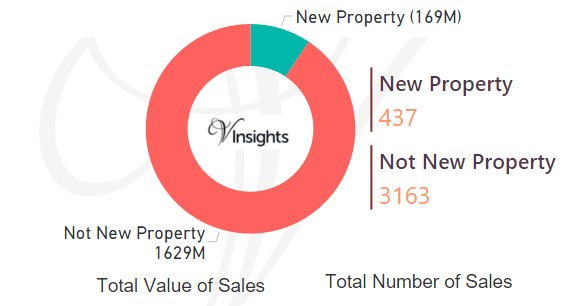
By Value Of Sales
- Not New Property contributed £1.63 billion (90.62%)
- New Property contributed £169 millions (9.38%)
By Number Of Sales
- The number of Not New Property sold was 3,163 (87.86%)
- whereas the number of New Properties sold were 437 (12.14%)
Year on Year Comparison : Compared to Hillingdon Property Market 2015 in 2016
- New property market share in property market has gone slightly up in 2016 over 2015
All London Posts
924a1136-a438-49d2-9397-51e765b2dbe6|0|.0|27604f05-86ad-47ef-9e05-950bb762570c
Story Highlights
- Harrow had total Property Sales of £1.35 billions in 2016
- The total number of properties sold in year 2016 was 2,617
- The average property price was £514 K, while median was £440 K
- Not New Property contributed 92.77% and New Property contributed 7.23% by sales value
- Stamp duty changes caused monthly spike in March
- Brexit coupled with Stamp Duty changes caused decline of 15.6% in Total Sales compared to 2015
Harrow is one of the Boroughs of West London. It had total Property Sales of £1.35 billions which was 9.58% of West London Property Market 2016.
Total Sales By Property Type
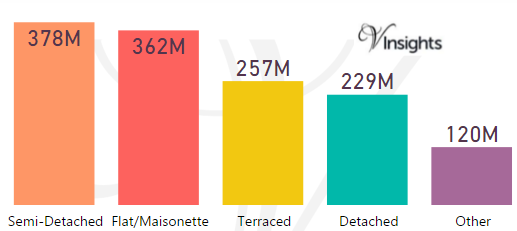
The split of £1.35 billions across the different property types are:
- Semi-Detached: £378 millions (28.11%)
- Flat/Maisonette: £362 millions (26.87%)
- Terraced: £257 millions (19.08%)
- Detached: £229 millions (16.99%).
- Other: £120 millions (8.95%)
Year on Year Comparison : Compared to Harrow Property Market 2015 in 2016
- All the property types have shown decline in sales except Other
- Others has shown growth of 30.43% in total sales value
- Total sales value has shown a decline by 15.6% year on year
Harrow Property Market at Postcode Level
| Postcode |
Coverage Area
|
Local Authority Area |
| HA0 |
Alperton, Sudbury, Sudbury Hill, Wembley Central and North Wembley
|
Brent, Harrow, Ealing |
| HA1 |
Harrow, Harrow on the Hill, North Harrow, Northwick Park, Sudbury, Sudbury Hill
|
Harrow, Brent |
| HA2 |
North Harrow, South Harrow, West Harrow, Rayners Lane (south)
|
Harrow |
| HA3 |
Harrow Weald, Kenton, Wealdstone, Queensbury, Belmont (part)
|
Harrow, Brent |
| HA4 |
Ruislip, Eastcote (west and south), South Ruislip, Ruislip Manor, Ruislip Gardens
|
Hillingdon, Harrow |
| HA5 |
Pinner, Eastcote (north and east), Hatch End, Rayners Lane (north), Carpenders Park (part)
|
Harrow, Hillingdon, Three Rivers |
| HA7 |
Stanmore, Queensbury, Belmont (part)
|
Harrow, Brent, Barnet |
| HA8 |
Edgware, Burnt Oak, Canons Park, Queensbury
|
Barnet, Brent, Harrow |
| N16 |
Stoke Newington, Stamford Hill (part), Shacklewell, Dalston (part), Newington Green (part)
|
Islington, Hackney, Harrow |
| UB5 |
Northolt
|
Ealing, Harrow, Hillingdon |
| WD23 |
Bushey, Bushey Heath
|
Hertsmere, Watford, Harrow |
For property market details at post code level please click on Postcode in the table above.
Month-wise Break-up of Total Sales
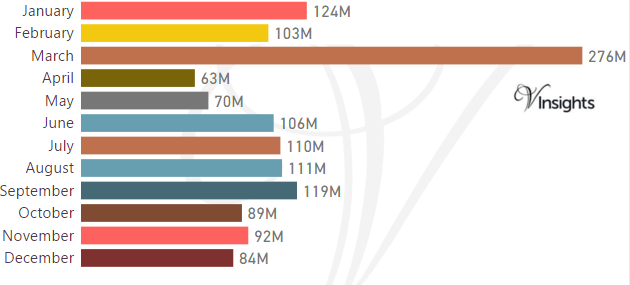
Stamp Duty Hike Impact
- March had property sale spike of £276 millions compared to £103 millions in Feb
- The impetus for it was to avoid the extra 3% in Stamp Duty Tax applicable on buying an additional home, being applicable from April 1 2016
Brexit Impact
- Brexit took place on 23rd June 2016.
- As can be observed from the month-wise break-up there does not seem to have been dip in property sales in the immediate aftermath of Brexit
- Year on Year the property market for Harrow has declined by 15.6% over 2015
Total No Of Properties Sold By Property Type
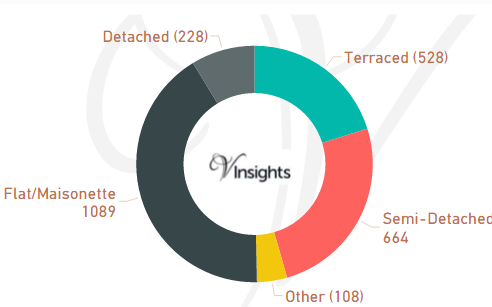
In Harrow the total number of properties sold in year 2015 was 2,617. The breakdown by different property types are:
- Terraced: 528 (20.18%)
- Semi-Detached: 664 (25.37%)
- Other: 108 (4.13%)
- Flat/Maisonette: 1,089 (41.61%)
- Detached: 228 (8.71%).
Year on Year Comparison : Compared to Harrow Property Market 2015 in 2016
- Total number of property sales in Harrow has declined by 22.18%
- All property types have shown decline in number of properties sold except property type Other
- Other has shown significant increase of 108% from 2015 to 2016
Average & Median Sales Price
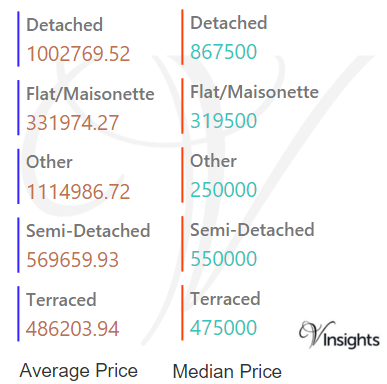
In 2016 the Average property price was £514 K in Harrow. The average property price for the different property types are:
- Detached: £1 millions
- Flat/Maisonette: £332 K
- Other: £1.12 millions
- Semi-Detached: £570 K
- Terraced: £486 K
The Median property price was £440 K. The median property price for the different property types are:
- Detached: £868 K
- Flat/Maisonette: £320 K
- Other: £250 K
- Semi-Detached: £550 K
- Terraced: £475 K
Year on Year Comparison : Compared to Harrow Property Market 2015 in 2016
- The average and median prices have gone up for all property types except Others.
New Vs Not New Property Statistics
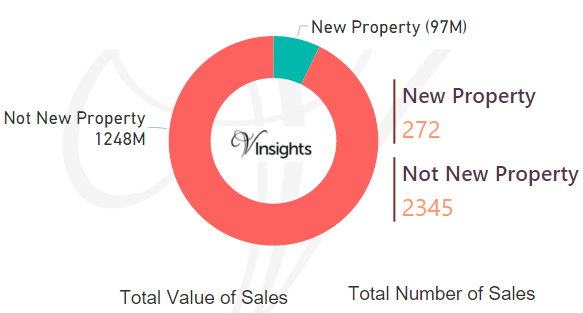
By Value Of Sales
- Not New Property contributed £1.25 billion (92.77%)
- New Property contributed £97 millions (7.23%)
By Number Of Sales
- The number of Not New Property sold were 272 (10.39%)
- whereas the number of New Property sold were 2,345 (89.61%)
Year on Year Comparison : Compared to Harrow Property Market 2015 in 2016
- New property market share in property market has gone down in 2016 over 2015
All London Posts
16d5b263-b2cc-4422-b2b8-7a4b00c1e964|0|.0|27604f05-86ad-47ef-9e05-950bb762570c
Story Highlights
- Hammersmith and Fulham had total Property Sales of £2.39 billions in 2016
- The total number of properties sold in year 2016 was 2,414
- The Average property price was £991 K, while Median was £703 K
- Not New Property contributed 84.97% and New Property 15.03% by sales value
- Stamp duty changes caused monthly spike in March
- Brexit coupled with Stamp Duty changes caused a very significant decline of 23.6% in total sales compared to 2015
Hammersmith and Fulham is one of the Boroughs of West London. It had total Property Sales of £2.39 billions which was 17.04% of West London Property Market 2016.
Total Sales By Property Type
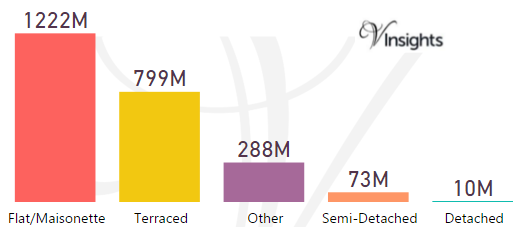
The split of £2.39 billions across the different property types are:
- Flat/Maisonette: £1.22 billions (51.07%)
- Terraced: £799 millions (33.41%)
- Other: £288 millions (12.05%)
- Semi-Detached: £73 millions (3.06%)
- Detached: £10 millions (0.41%)
Year on Year Comparison : Compared to Hammersmith and Fulham Property Market 2015 in 2016
- All the property types have shown decline in sales except Semi-Detached.
- Total sales value declined by 23.62% in 2016 compared to 2015
Hammersmith and Fulham Property Market at Postcode Level
| Postcode |
Coverage Area
|
Local Authority Area |
| NW10 |
Willesden district: Willesden, Harlesden, Kensal Green, Brent Park, College Park, Stonebridge, North Acton (part), West Twyford, Neasden (south), Old Oak Common, Park Royal (north)
|
Brent, Ealing, Hammersmith and Fulham, Kensington and Chelsea |
| SW6 |
Fulham, Parsons Green
|
Hammersmith and Fulham |
| SW10 |
West Brompton, Chelsea (west)
|
Hammersmith and Fulham, Kensington and Chelsea |
| W3 |
Acton, West Acton, North Acton (part), South Acton, East Acton (west), Park Royal (south), Hanger Hill Garden Estate, Gunnersbury Park
|
Ealing, Hounslow, Hammersmith and Fulham |
| W4 |
Chiswick, Gunnersbury, Turnham Green, Acton Green, South Acton (part), Bedford Park
|
Hounslow, Ealing, Hammersmith and Fulham |
| W6 |
Hammersmith, Ravenscourt Park, Stamford Brook (part)
|
Hammersmith and Fulham, Hounslow |
| W10 |
North Kensington, Kensal Town, Ladbroke Grove (north), Queen's Park (part)
|
Kensington and Chelsea, Westminster, Hammersmith and Fulham, Brent |
| W11 |
Notting Hill, Ladbroke Grove (south), Holland Park (part)
|
Kensington and Chelsea, Westminster, Hammersmith and Fulham |
| W12 |
Shepherds Bush, White City, Wormwood Scrubs, East Acton (east)
|
Hammersmith and Fulham |
| W14 |
West Kensington, Kensington Olympia, Holland Park
|
Hammersmith and Fulham, Kensington and Chelsea |
Month-wise Break-up of Total Sales
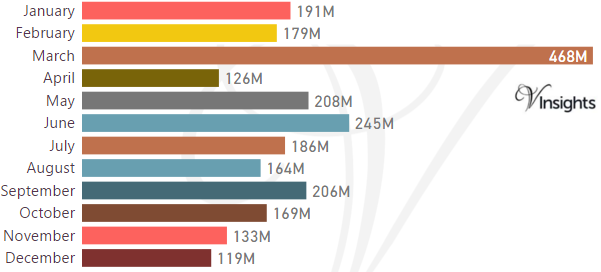
Stamp Duty Hike Impact
- March had property sale spike of £468 millions compared to £179 millions in Feb
- The impetus for it was to avoid the extra 3% in Stamp Duty Tax applicable on buying an additional home, being applicable from April 1 2016
Brexit Impact
- Brexit took place on 23rd June 2016.
- As can be observed from the month-wise break-up there seem to have been significant dip in property sales in the immediate aftermath of Brexit
- Year on Year the property market for Hammersmith and Fulham has declined by 23.62% over 2015
Total No Of Properties Sold By Property Type
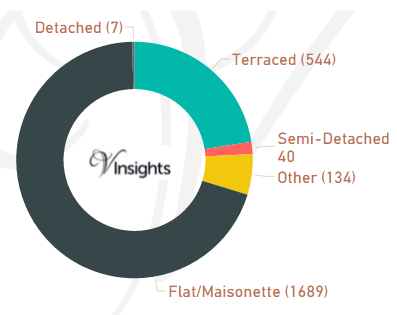
The total number of properties sold in Hammersmith and Fulham 2016 was 2,414
- Detached 7 (0.29%)
- Semi-Detached 40 (1.66%)
- Terraced 544 (22.54%)
- Flat/Maisonette 1,689 (69.97%)
- Other 134 (5.55%)
Year on Year Comparison : Compared to Hammersmith and Fulham Property Market 2015 in 2016
- Total number of property sales in Hammersmith and Fulham has declined by 14%
- All property types have shown decline in number of properties sold except property type Other, Semi-Detached
- Other has shown significant increase of 11.67% in 2016
Average & Median Sales Price
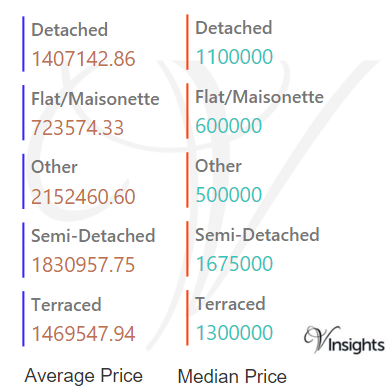
In 2016 the average property price was £991 K in Hammersmith and Fulham. The average property price for the different property types are:
- Detached: £1.41 millions
- Flat/Maisonette: £724 K
- Other: £2.15 millions
- Semi-Detached: £1.83 millions
- Terraced: £1.47 millions.
The median property price was £703 K. The median property price for the different property types are:
- Detached: £1.1 millions
- Flat/Maisonette: £600 K
- Other: £500 K
- Semi-Detached: £1.68 millions
- Terraced: £1.3 millions
Year on Year Comparison : Compared to Hammersmith and Fulham Property Market 2015 in 2016
- The average and median sales price across all property types have gone down except Semi-Detached, Terraced.
New Vs Not New Property Statistics
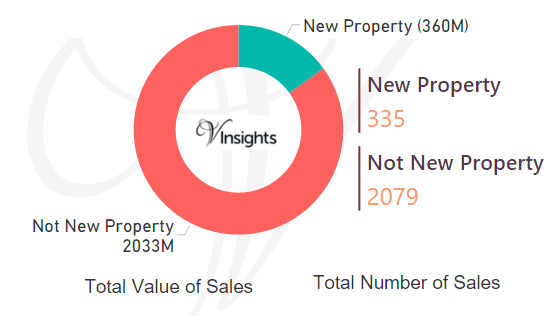
By Value Of Sales
- The sales value contributed by New Property was £360 millions (15.03%)
- where as Not New Property contribute £2.03 billions (84.97%)
By Number Of Sales
- New properties sold were 335 (13.88%)
- where as not new property sold were 2,079 (86.12%).
Year on Year Comparison : Compared to Hammersmith and Fulham Property Market 2015 in 2016
- New property market share in property market has gone slightly up in 2016 over 2015
All London Posts
351aad50-d300-4a84-ad78-6bac236ed74c|0|.0|27604f05-86ad-47ef-9e05-950bb762570c