Story Highlights
- Harrow had total Property Sales of £1.35 billions in 2016
- The total number of properties sold in year 2016 was 2,617
- The average property price was £514 K, while median was £440 K
- Not New Property contributed 92.77% and New Property contributed 7.23% by sales value
- Stamp duty changes caused monthly spike in March
- Brexit coupled with Stamp Duty changes caused decline of 15.6% in Total Sales compared to 2015
Harrow is one of the Boroughs of West London. It had total Property Sales of £1.35 billions which was 9.58% of West London Property Market 2016.
Total Sales By Property Type
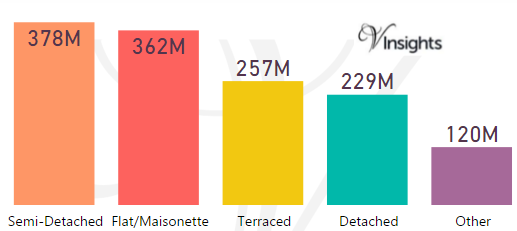
The split of £1.35 billions across the different property types are:
- Semi-Detached: £378 millions (28.11%)
- Flat/Maisonette: £362 millions (26.87%)
- Terraced: £257 millions (19.08%)
- Detached: £229 millions (16.99%).
- Other: £120 millions (8.95%)
Year on Year Comparison : Compared to Harrow Property Market 2015 in 2016
- All the property types have shown decline in sales except Other
- Others has shown growth of 30.43% in total sales value
- Total sales value has shown a decline by 15.6% year on year
Harrow Property Market at Postcode Level
| Postcode |
Coverage Area
|
Local Authority Area |
| HA0 |
Alperton, Sudbury, Sudbury Hill, Wembley Central and North Wembley
|
Brent, Harrow, Ealing |
| HA1 |
Harrow, Harrow on the Hill, North Harrow, Northwick Park, Sudbury, Sudbury Hill
|
Harrow, Brent |
| HA2 |
North Harrow, South Harrow, West Harrow, Rayners Lane (south)
|
Harrow |
| HA3 |
Harrow Weald, Kenton, Wealdstone, Queensbury, Belmont (part)
|
Harrow, Brent |
| HA4 |
Ruislip, Eastcote (west and south), South Ruislip, Ruislip Manor, Ruislip Gardens
|
Hillingdon, Harrow |
| HA5 |
Pinner, Eastcote (north and east), Hatch End, Rayners Lane (north), Carpenders Park (part)
|
Harrow, Hillingdon, Three Rivers |
| HA7 |
Stanmore, Queensbury, Belmont (part)
|
Harrow, Brent, Barnet |
| HA8 |
Edgware, Burnt Oak, Canons Park, Queensbury
|
Barnet, Brent, Harrow |
| N16 |
Stoke Newington, Stamford Hill (part), Shacklewell, Dalston (part), Newington Green (part)
|
Islington, Hackney, Harrow |
| UB5 |
Northolt
|
Ealing, Harrow, Hillingdon |
| WD23 |
Bushey, Bushey Heath
|
Hertsmere, Watford, Harrow |
For property market details at post code level please click on Postcode in the table above.
Month-wise Break-up of Total Sales
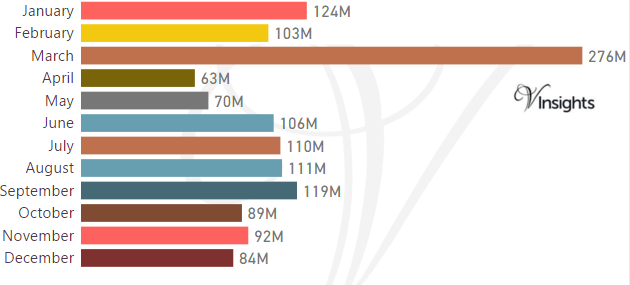
Stamp Duty Hike Impact
- March had property sale spike of £276 millions compared to £103 millions in Feb
- The impetus for it was to avoid the extra 3% in Stamp Duty Tax applicable on buying an additional home, being applicable from April 1 2016
Brexit Impact
- Brexit took place on 23rd June 2016.
- As can be observed from the month-wise break-up there does not seem to have been dip in property sales in the immediate aftermath of Brexit
- Year on Year the property market for Harrow has declined by 15.6% over 2015
Total No Of Properties Sold By Property Type
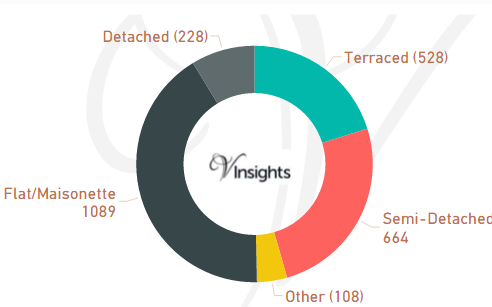
In Harrow the total number of properties sold in year 2015 was 2,617. The breakdown by different property types are:
- Terraced: 528 (20.18%)
- Semi-Detached: 664 (25.37%)
- Other: 108 (4.13%)
- Flat/Maisonette: 1,089 (41.61%)
- Detached: 228 (8.71%).
Year on Year Comparison : Compared to Harrow Property Market 2015 in 2016
- Total number of property sales in Harrow has declined by 22.18%
- All property types have shown decline in number of properties sold except property type Other
- Other has shown significant increase of 108% from 2015 to 2016
Average & Median Sales Price
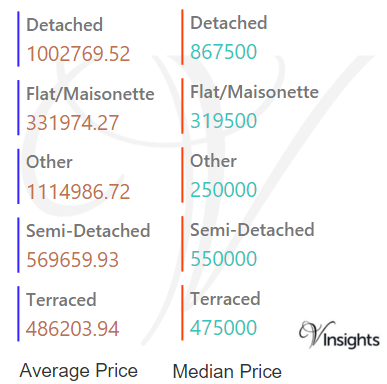
In 2016 the Average property price was £514 K in Harrow. The average property price for the different property types are:
- Detached: £1 millions
- Flat/Maisonette: £332 K
- Other: £1.12 millions
- Semi-Detached: £570 K
- Terraced: £486 K
The Median property price was £440 K. The median property price for the different property types are:
- Detached: £868 K
- Flat/Maisonette: £320 K
- Other: £250 K
- Semi-Detached: £550 K
- Terraced: £475 K
Year on Year Comparison : Compared to Harrow Property Market 2015 in 2016
- The average and median prices have gone up for all property types except Others.
New Vs Not New Property Statistics
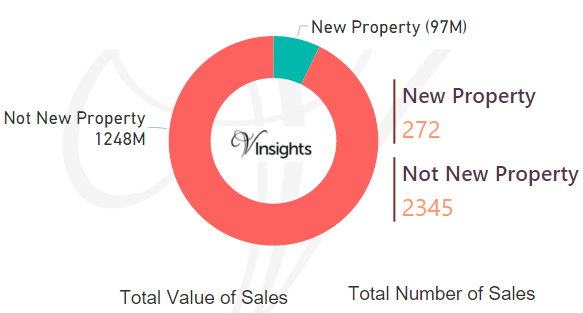
By Value Of Sales
- Not New Property contributed £1.25 billion (92.77%)
- New Property contributed £97 millions (7.23%)
By Number Of Sales
- The number of Not New Property sold were 272 (10.39%)
- whereas the number of New Property sold were 2,345 (89.61%)
Year on Year Comparison : Compared to Harrow Property Market 2015 in 2016
- New property market share in property market has gone down in 2016 over 2015
All London Posts
16d5b263-b2cc-4422-b2b8-7a4b00c1e964|0|.0|27604f05-86ad-47ef-9e05-950bb762570c