Story Highlights
- Richmond Upon Thames had total Property Sales of £2.55 billions in 2016
- The total number of properties sold in year 2016 was 3,057
- The Average property price was £835 K, while Median was £600 K
- Not New Property contributed 96.46% and New Property 3.54% by sales value
- Stamp duty changes caused monthly spike in March
- Brexit coupled with Stamp Duty changes caused significant decline of 7.6% in total sales over 2015
Richmond Upon Thames is one of the Boroughs of West London. It had total Property Sales of £2.55 billions which was 18.18% of West London Property Market 2016.
Total Sales By Property Type
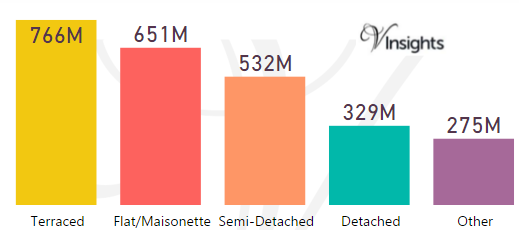
The split of £2.55 billions across the different property types are:
- Terraced £766 millions (30%)
- Flat/Maisonette £651 millions (25.5%)
- Semi-Detached £532 millions (20.83%)
- Detached £329 millions (12.88%).
- Other £275 millions (10.79%)
Year on Year Comparison : Compared to Richmond Upon Thames Property Market 2015 in 2016
- All the property types have shown decline in sales except Other
- Others has shown growth of 23.9% in total sales value
- Total sales has declined by 7.6% compared to 2015
Richmond Upon Thames Property Market at Postcode Level
| Postcode |
Coverage Area
|
Local Authority Area |
| KT1 |
Kingston upon Thames, Hampton Wick, Norbiton
|
Kingston Upon Thames, Richmond upon Thames |
| KT2 |
Kingston upon Thames, Canbury, Coombe
|
Kingston Upon Thames, Richmond upon Thames |
| SW13 |
Barnes
|
Richmond Upon Thames,Merton |
| SW14 |
Mortlake, East Sheen
|
Richmond Upon Thames,Merton |
| SW15 |
Kingston Vale, Putney, Putney Heath, Putney Vale, Richmond Park, Roehampton, Roehampton Vale
|
Kingston Upon Thames, Richmond Upon Thames, Wandsworth,Merton |
| TW1 |
Twickenham, St. Margarets, Strawberry Hill (east)
|
Hounslow, Richmond upon Thames |
| TW2 |
Twickenham, Whitton, Strawberry Hill (west), Fulwell (north)
|
Richmond Upon Thames |
| TW3 |
Hounslow, Lampton, Whitton (north)
|
Hounslow, Richmond upon Thames |
| TW4 |
Hounslow West, Hounslow Heath, Whitton (west), Cranford (south)
|
Hounslow, Richmond upon Thames |
| TW7 |
Isleworth, Osterley (east and centre)
|
Hounslow, Richmond upon Thames |
| TW9 |
Richmond, Kew, North Sheen (north)
|
Richmond Upon Thames |
| TW10 |
Ham, Petersham, Richmond Hill, North Sheen (south), Richmond Park
|
Kingston Upon Thames, Richmond upon Thames |
| TW11 |
Teddington, Fulwell (east), Bushy Park
|
Richmond Upon Thames |
| TW12 |
Hampton, Hampton Hill, Fulwell (west)
|
Richmond Upon Thames |
| TW13 |
Feltham, Hanworth
|
Hounslow, Richmond upon Thames |
Month-wise Break-up of Total Sales
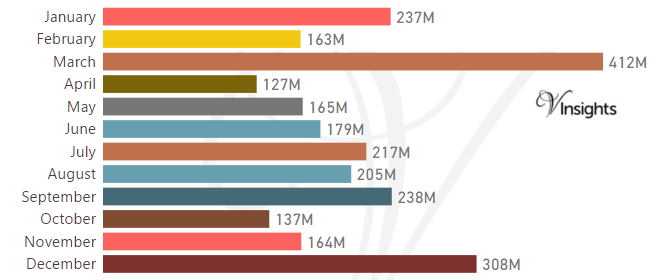
Stamp Duty Hike Impact
- March had property sale spike of £412 millions compared to £163 millions in Feb
- The impetus for it was to avoid the extra 3% in Stamp Duty Tax applicable on buying an additional home, being applicable from April 1 2016
Brexit Impact
- Brexit took place on 23rd June 2016.
- As can be observed from the month-wise break-up there does not seem to have dip in property sales in the immediate aftermath of Brexit
- Year on Year the property market for Richmond Upon Thames has declined by 7.6% over 2015
Total No Of Properties Sold By Property Type
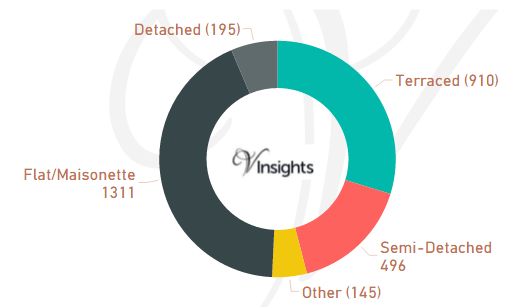
In Richmond Upon Thames the total number of properties sold in year 2016 was 3,057. The breakdown by different property types are:
- Terraced 910 (29.77%)
- Semi-Detached 496 (16.23%)
- Other 145 (4.74%)
- Flat/Maisonette 1,311 (42.89%)
- Detached 195 (6.38%).
Year on Year Comparison : Compared to Richmond Upon Thames Property Market 2015 in 2016
- Total number of property sales in Richmond Upon Thames has declined by 11.05%
- All property types have shown decline in number of properties sold except property type Other
- Other has shown significant growth of 116% over 2015
Average & Median Sales Price
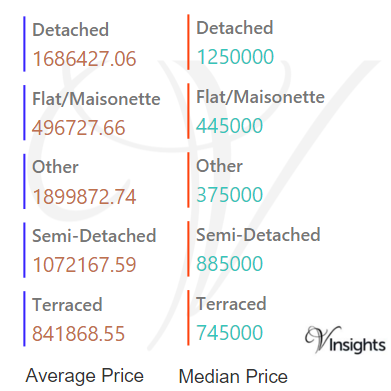
In 2016 the Average property price was £835 K in Richmond Upon Thames. The average property price for the different property types are:
- Detached £1.69 million
- Flat/Maisonette £497 K
- Other £1.9 millions
- Semi-Detached £1.07 million
- Terraced £842 K.
The Median property price was £600 K. The median property price for the different property types are:
- Detached £1.25 millions
- Flat/Maisonette £445 K
- Other £375 K
- Semi-Detached £885 K
- Terraced £745 K.
Year on Year Comparison : Compared to Richmond Upon Thames Property Market 2015 in 2016
- The average and median sales price across all property types have gone up except for Other
- Other has shown sharp decline in average and median sales price
New Vs Not New Property Statistics
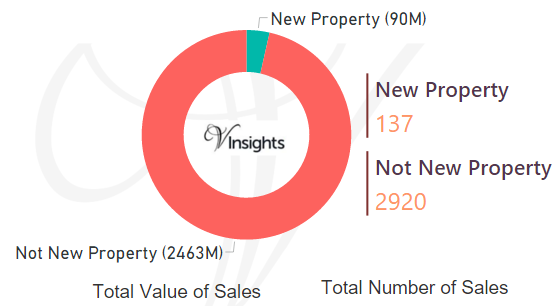
By Value Of Sales
- Not New Property contributed £2.5 billion (96.46%)
- New Property contributed £90 millions (3.54%)
By Number Of Sales
- The number of Not New Property sold was 2,920 (95.52%)
- whereas the number of New Properties sold was 137 (4.48%)
Year on Year Comparison : Compared to Richmond Upon Thames Property Market 2015 in 2016
- New property market share in property market has gone up in 2016 over 2015
All London Posts
acaebdec-4c1d-4400-90d3-15f6f780b9ee|0|.0|27604f05-86ad-47ef-9e05-950bb762570c