For 2016 details - Harrow Property Market 2016
Story Highlights
- Harrow had total Property Sales of £1.6 billions in 2015
- The total number of properties sold in year 2015 was 3363
- The Average property price was £471 K while Median was £394 K
- Not New Property contributed 86.44% and New Property 13.56% by sales value
Total Sales By Property Type
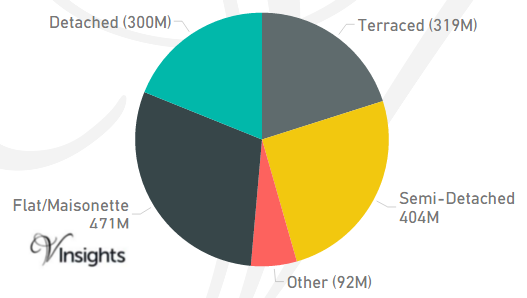
Harrow is one of the Boroughs of West London. It had total Property Sales of £1.6 billions which was 10.24% of West London Property Market 2015.
The split across the different property types are:
- Terraced: £319 millions (20.1%)
- Semi-Detached: £404 millions (25.47%)
- Other: £92 millions (5.84%)
- Flat/Maisonette: £471 millions (29.69%)
- Detached: £300 millions (18.9%).
Total No Of Properties Sold By Property Type
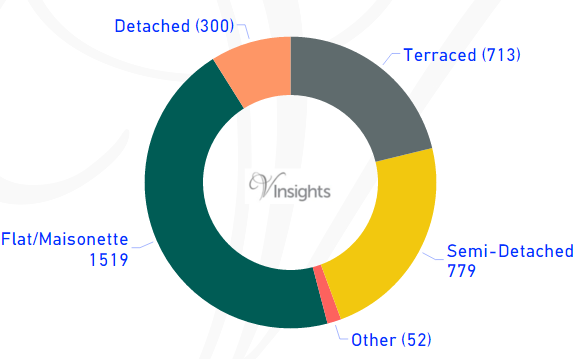
In Harrow the total number of properties sold in year 2015 was 3363. The breakdown by different property types are:
- Terraced: 713 (21.2%)
- Semi-Detached: 779 (23.16%)
- Other: 52 (1.55%)
- Flat/Maisonette: 1519 (45.17%)
- Detached: 300 (8.92%).
Average & Median Sales Price
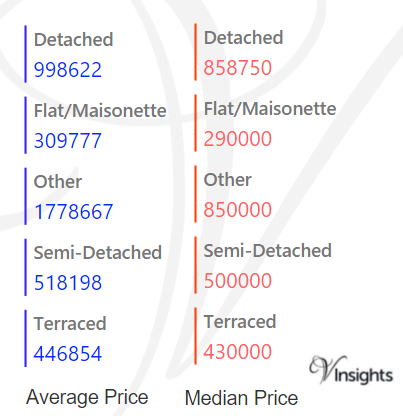
In 2015 the Average property price was £471 K in Harrow. The average property price for the different property types are:
- Detached: £999 K
- Flat/Maisonette: £310 K
- Other: £1.78 millions
- Semi-Detached: £518 K
- Terraced: £447 K.
The Median property price was £394 K. The median property price for the different property types are:
- Detached: £859 K
- Flat/Maisonette: £290 K
- Other: £850 K
- Semi-Detached: £500 K
- Terraced: £430 K.
New Vs Not New Property Statistics
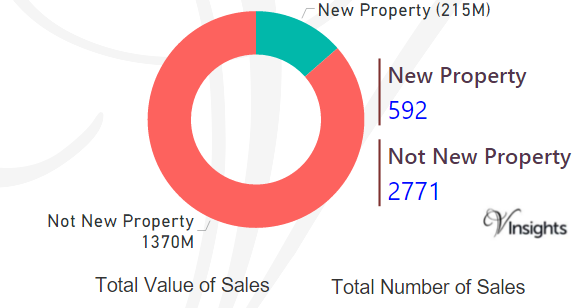
By Value Of Sales
- Not New Property Contributed £1.37 billion (86.44%)
- New Property 215 millions (13.56%) giving combined total of £1.6 billions.
By Number Of Sales
- The number of Not New Property sold were 2771 (82.4%)
- whereas the number of New Property sold were 592 (17.6%) giving combined total of 3363.
All London Posts

574299cc-6581-44fc-86ba-962099b151b6|0|.0|27604f05-86ad-47ef-9e05-950bb762570c
For 2016 details - Hammersmith and Fulham Property Market 2016
Story Highlights
- Hammersmith and Fulham had total Property Sales of £3.13 billions in 2015
- The total number of properties sold in year 2015 was 2808
- The Average property price was £1.1 million while Median was £730 K
- Not New Property contributed 85.97% and New Property 14.03% by sales value
Total Sales By Property Type
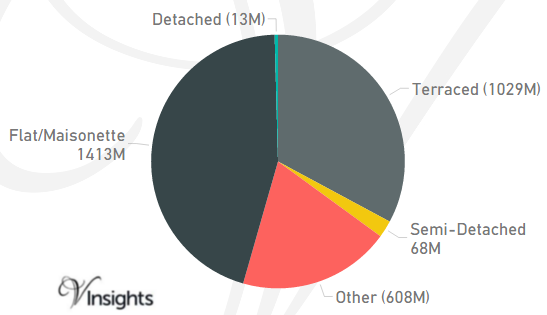
Hammersmith and Fulham is one of the Boroughs of West London. It had total Property Sales of £3.13 billions which was 20.23 % of West London Property Market 2015.
The split across the different property types are:
- Terraced: £1.029 billions (32.85%)
- Semi-Detached: £68 millions (2.18%)
- Other: £608 millions (19.41%)
- Flat/Maisonette: £1.41 billions (45.14%)
- Detached: £13 millions (0.42%).
Total No Of Properties Sold By Property Type
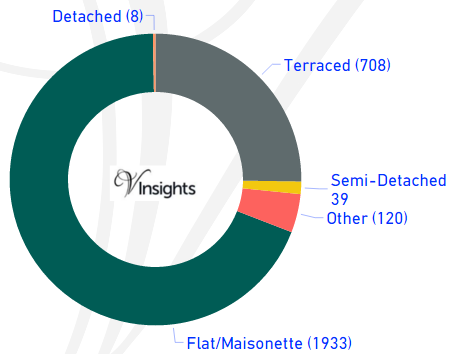
In Hammersmith and Fulham the total number of properties sold in year 2015 was 2808. The breakdown by different property types are:
- Terraced: 708 (25.21%)
- Semi-Detached: 39 (1.39%)
- Other: 120 (4.27%)
- Flat/Maisonette: 1933 (68.84%)
- Detached: 8 (0.28%).
Average & Median Sales Price
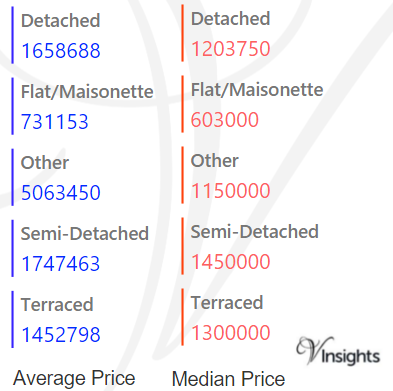
In 2015 the Average property price was £1.1 million in Hammersmith and Fulham. The average property price for the different property types are:
- Detached: £1.66 millions
- Flat/Maisonette: £731 K
- Other: £5.06 millions
- Semi-Detached: £1.75 millions
- Terraced: £1.45 millions.
The Median property price was £730 K. The median property price for the different property types are:
- Detached: £1.2 millions
- Flat/Maisonette: £603 K
- Other: £1.15 millions
- Semi-Detached: £1.45 millions
- Terraced: £1.3 millions.
New Vs Not New Property Statistics
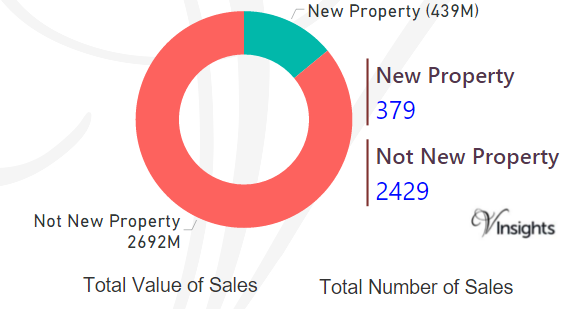
By Value Of Sales
- Not New Property Contributed £2.69 billion (85.97%)
- New Property 439 millions (14.03%) giving combined total of £3.13 billions.
By Number Of Sales
- The number of Not New Property sold was 2429 (86.5%)
- whereas the number of New Properties sold were 379 (13.5%) giving combined total of 2808.
All London Posts
989802da-8c44-41d7-8c5e-3af6599551c8|0|.0|27604f05-86ad-47ef-9e05-950bb762570c
For 2016 details - Ealing Property Market 2016
Story Highlights
- Ealing had total Property Sales of £2.35 billions in 2015
- The total number of properties sold in year 2015 was 4029
- The Average property price was £584 K in Ealing while Median was £430 K
- The sales value contributed by New Property was 10.56% and Not New Property 89.44%
Total Sales By Property Type
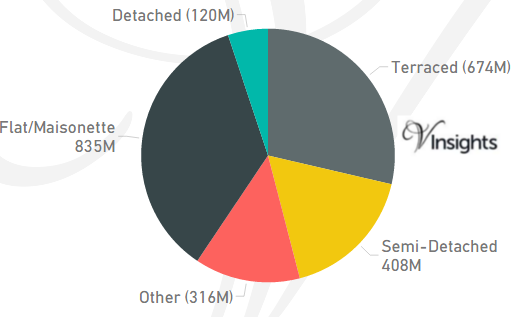
Ealing is one of the Boroughs of West London. It had total Property Sales of £2.35 billions which was 15.2% of West London Property Market 2015.
The split across the different property types are:
- Terraced: £674 millions (28.64%)
- Semi-Detached: £408 millions (17.32%)
- Other: £316 millions (13.45%)
- Flat/Maisonette: £835 millions (35.49%)
- Detached: £120 millions (5.1%).
Total No Of Properties Sold By Property Type
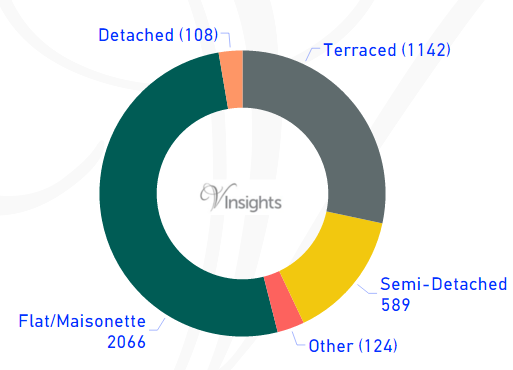
In Ealing the total number of properties sold in year 2015 was 4029. The breakdown by different property types are:
- Terraced: 1142 (28.34%)
- Semi-Detached: 589 (14.62%)
- Other: 124 (3.08%)
- Flat/Maisonette: 2066 (51.28%)
- Detached: 108 (2.68%).
Average & Median Sales Price
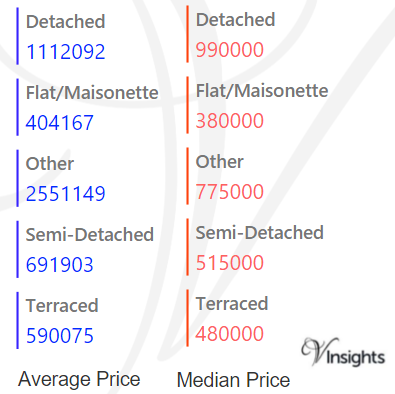
In 2015 the Average property price was £584 K in Ealing. The average property price for the different property types are:
- Detached: £1.1 millions
- Flat/Maisonette: £404 K
- Other: £2.55 millions
- Semi-Detached: £692 K
- Terraced: £590 K.
The Median property price was £430 K. The median property price for the different property types are:
- Detached: £990 K
- Flat/Maisonette: £380 K
- Other: £775 K
- Semi-Detached: £515 K
- Terraced: £480 K.
New Vs Not New Property Statistics
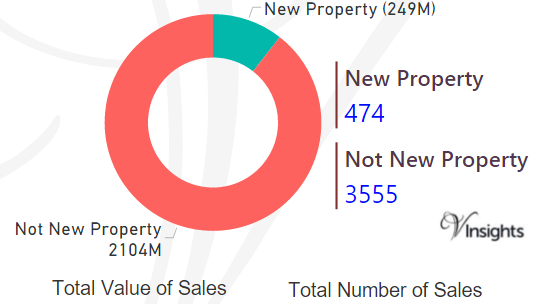
By Value Of Sales
- The sales value contributed by New Property was £249 millions (10.56%)
- Not New Property contributed £2.1 billions (89.44 %) giving combined total of £2.35 billions.
By Number Of Sales
- New properties sold were 474 (11.76%)
- where as not new property sold were 3555 (88.24%) giving combined total of 4029.
All London Posts
f51f305c-2029-4a05-9d50-c6491f1e600a|0|.0|27604f05-86ad-47ef-9e05-950bb762570c
For 2016 details - Brent Property Market 2016
Story Highlights
- Brent had total Property Sales of £1.93 billions in 2015.
- The total number of properties sold in year 2015 was 3253.
- The Average property price was £548 K in Brent while Median was £405 K.
- Not New Property Contributed £1.66 billion (86.05%) and New Property 269 millions (13.95%) giving combined total of £1.93 billions.
- The number of Not New Property sold was 2807 (79.68%), whereas the number of New Property sold was 716 (20.32%) giving combined total of 3523.
Total Sales By Property Type
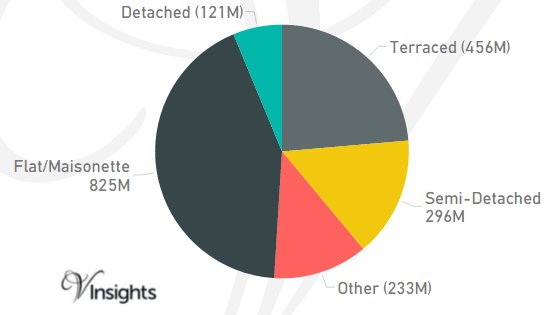
Brent is one of the Boroughs of West London. It had total Property Sales of £1.93 billions which was 12.47% of West London Property Market 2015.
The split across the different property types are:
- Terraced: £456 millions (23.62%)
- Semi-Detached: £296 millions (15.32%)
- Other: £233 millions (12.05%)
- Flat/Maisonette: £825 millions (42.76%)
- Detached: £121 millions (6.25%).
Total No Of Properties Sold By Property Type
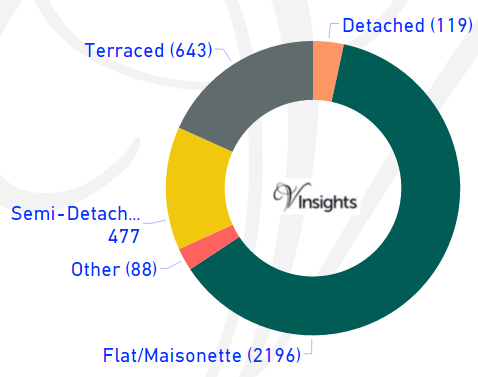
In Brent the total number of properties sold in year 2015 was 3523.
The breakdown by different property types are:
- Terraced: 643 (18.25%)
- Semi-Detached: 477 (13.54%)
- Other: 88 (2.5%)
- Flat/Maisonette: 2196 (62.33%)
- Detached: 119 (3.38%).
Average & Median Sales Price
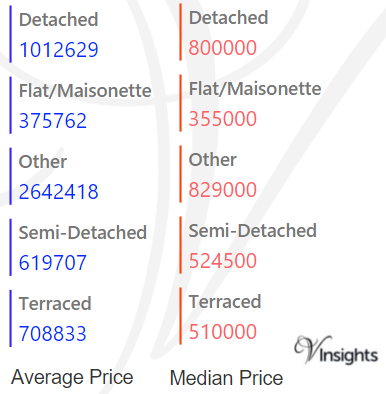
In 2015 the Average property price was £548 K in Brent. The average property price for the different property types are:
- Detached: £1.01 millions
- Flat/Maisonette: £376 K
- Other: £2.64 millions
- Semi-Detached: £620 K
- Terraced: £709 K.
The Median property price was £405 K. The median property price for the different property types are:
- Detached: £800 K
- Flat/Maisonette: £355 K
- Other: £829 K
- Semi-Detached: £525 K
- Terraced: £510 K.
New Vs Not New Property Statistics
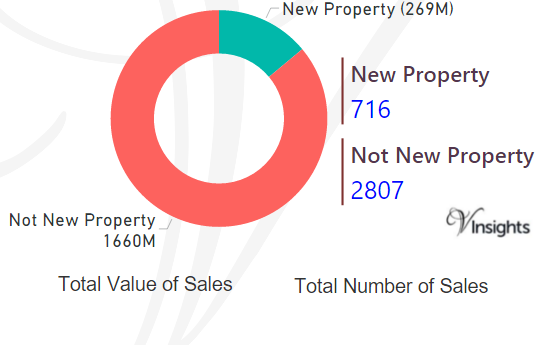
By Value Of Sales
- Not New Property Contributed £1.66 billion (86.05%)
- New Property 269 millions (13.95%) giving combined total of £1.93 billions.
By Number Of Sales
- The number of Not New Property sold was 2807 (79.68%)
- whereas the number of New Property sold was 716 (20.32%) giving combined total of 3523.
All London Posts
b19ac477-a296-4715-b420-ccfabdaa5d9e|0|.0|27604f05-86ad-47ef-9e05-950bb762570c

For 2016 details - West London Property Market 2016
Story Highlights
- West London in 2015 had total property sales of £15 billions
- Hammersmith And Fulham was the leader contributing £3.13 billions (20.23%)
- The total number of properties sold in West London 2015 was 24,888
- The average sales price in West London was £622 K and the median sales price was £425 K
- The average sales price in West London was maximum for the borough of Hammersmith And Fulham £1.12 millions and minimum for Hillingdon at £453 K.
- The median sales price in West London was maximum for the borough of Hammersmith And Fulham £730 K and minimum for Hillingdon at £350 K.
- The sales value contributed by New Property was £1.7 billions (10.2%) where as Not New Property contribute £13.78 billions (89.8 %)
West London boroughs are Brent, Ealing, Hammersmith & Fulham, Harrow, Hillingdon, Hounslow and Richmond upon Thames.
Total Sales By Property Type
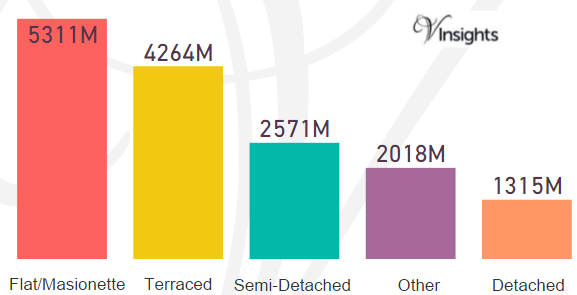
West London in 2015 had total property sales of £15 billions. It was 18.98% of the London Property Market 2015.
The split across the different property types are:
- Detached at £1.32 billions (8.5%)
- Semi-Detached at £2.57 billions (16.6%)
- Terraced at £4.264 billions (27.55 %)
- Other at £2.02 billions (13.04%)
- Flat/Maisonette at £5.3 billions (34.31%).
Total Sales By Borough
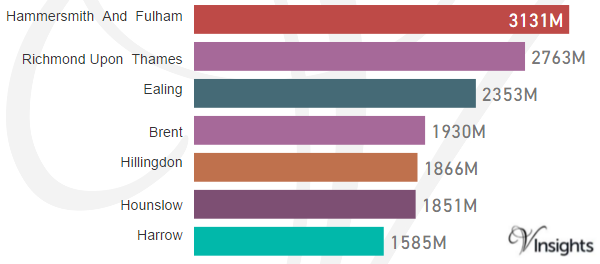
The total sales of £15 billions in 2015 was split across its borough as above.
Total Number Of Sales By Property Types
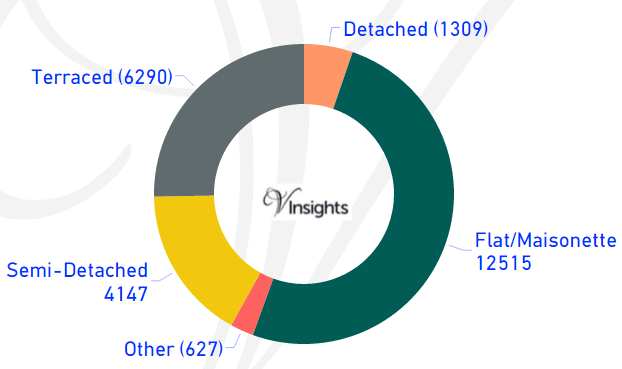
The total number of properties sold in West London 2015 was 24,888.
- Detached 1,309 (5.26%)
- Semi-Detached 4,147 (16.66%)
- Terraced 6,290 (25.27%)
- Flat/Maisonette 12,515 (50.29%)
- Other 627(2.52%)
Average & Median Sales Price
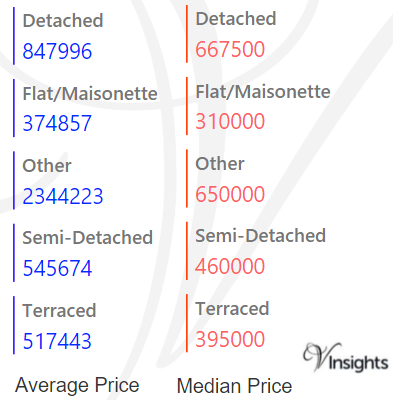
The average sales price in West London was £622 K. For the different property types it was:
- Detached £848 K
- Semi-Detached £546 K
- Terraced £517 K
- Flat/Maisonette £375 K
- Other it was £2.34 millions.
Similarly the median sales price in West London was £425 K. For the different property types it was:
- Detached £668 K
- Semi-Detached £460 K
- Terraced £395 K
- Flat/Maisonette £310 K
- Other it was £650 K.
Average & Median Sales Price By Borough
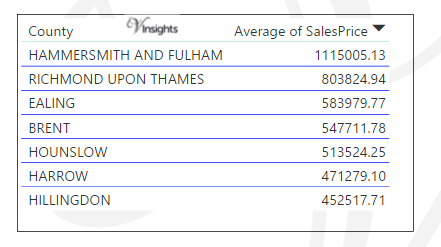
The average sales prices in West London at Borough level is as above.
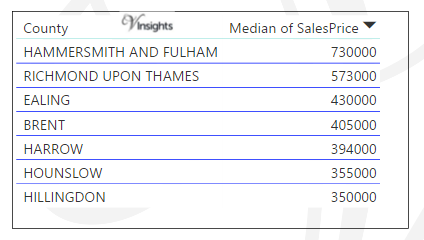
The average median prices in West London at Borough level is as above.
New Vs Not New Property Statistics
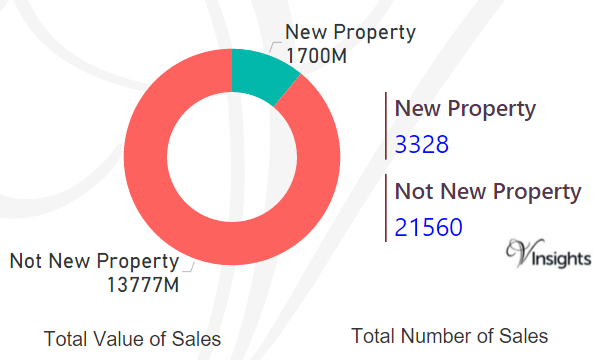
By Value Of Sales
- The sales value contributed by New Property was £1.7 billions (10.2%)
- where as Not New Property contribute £13.78 billions (89.8 %).
By Number Of Sales
- New properties sold were 3,328 (9.35%)
- where as not new property sold were 21,560 (90.65%).
All London Posts
499e2735-ca1b-4014-a0bb-568d3bdfb84b|0|.0|27604f05-86ad-47ef-9e05-950bb762570c