Story Highlights
- Hammersmith and Fulham had total Property Sales of £2.39 billions in 2016
- The total number of properties sold in year 2016 was 2,414
- The Average property price was £991 K, while Median was £703 K
- Not New Property contributed 84.97% and New Property 15.03% by sales value
- Stamp duty changes caused monthly spike in March
- Brexit coupled with Stamp Duty changes caused a very significant decline of 23.6% in total sales compared to 2015
Hammersmith and Fulham is one of the Boroughs of West London. It had total Property Sales of £2.39 billions which was 17.04% of West London Property Market 2016.
Total Sales By Property Type
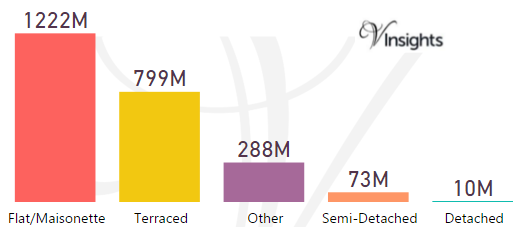
The split of £2.39 billions across the different property types are:
- Flat/Maisonette: £1.22 billions (51.07%)
- Terraced: £799 millions (33.41%)
- Other: £288 millions (12.05%)
- Semi-Detached: £73 millions (3.06%)
- Detached: £10 millions (0.41%)
Year on Year Comparison : Compared to Hammersmith and Fulham Property Market 2015 in 2016
- All the property types have shown decline in sales except Semi-Detached.
- Total sales value declined by 23.62% in 2016 compared to 2015
Hammersmith and Fulham Property Market at Postcode Level
| Postcode |
Coverage Area
|
Local Authority Area |
| NW10 |
Willesden district: Willesden, Harlesden, Kensal Green, Brent Park, College Park, Stonebridge, North Acton (part), West Twyford, Neasden (south), Old Oak Common, Park Royal (north)
|
Brent, Ealing, Hammersmith and Fulham, Kensington and Chelsea |
| SW6 |
Fulham, Parsons Green
|
Hammersmith and Fulham |
| SW10 |
West Brompton, Chelsea (west)
|
Hammersmith and Fulham, Kensington and Chelsea |
| W3 |
Acton, West Acton, North Acton (part), South Acton, East Acton (west), Park Royal (south), Hanger Hill Garden Estate, Gunnersbury Park
|
Ealing, Hounslow, Hammersmith and Fulham |
| W4 |
Chiswick, Gunnersbury, Turnham Green, Acton Green, South Acton (part), Bedford Park
|
Hounslow, Ealing, Hammersmith and Fulham |
| W6 |
Hammersmith, Ravenscourt Park, Stamford Brook (part)
|
Hammersmith and Fulham, Hounslow |
| W10 |
North Kensington, Kensal Town, Ladbroke Grove (north), Queen's Park (part)
|
Kensington and Chelsea, Westminster, Hammersmith and Fulham, Brent |
| W11 |
Notting Hill, Ladbroke Grove (south), Holland Park (part)
|
Kensington and Chelsea, Westminster, Hammersmith and Fulham |
| W12 |
Shepherds Bush, White City, Wormwood Scrubs, East Acton (east)
|
Hammersmith and Fulham |
| W14 |
West Kensington, Kensington Olympia, Holland Park
|
Hammersmith and Fulham, Kensington and Chelsea |
Month-wise Break-up of Total Sales
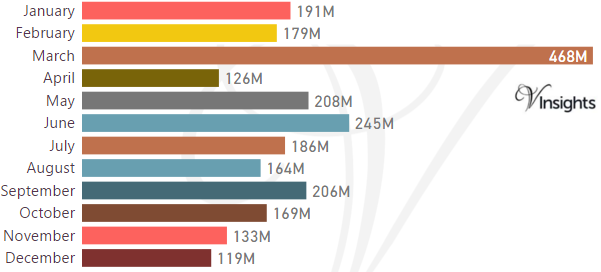
Stamp Duty Hike Impact
- March had property sale spike of £468 millions compared to £179 millions in Feb
- The impetus for it was to avoid the extra 3% in Stamp Duty Tax applicable on buying an additional home, being applicable from April 1 2016
Brexit Impact
- Brexit took place on 23rd June 2016.
- As can be observed from the month-wise break-up there seem to have been significant dip in property sales in the immediate aftermath of Brexit
- Year on Year the property market for Hammersmith and Fulham has declined by 23.62% over 2015
Total No Of Properties Sold By Property Type
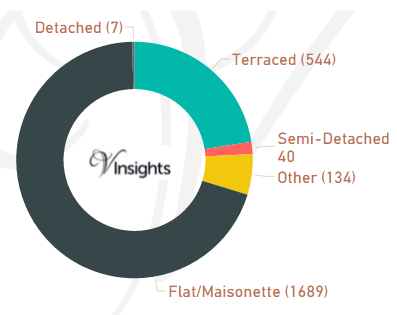
The total number of properties sold in Hammersmith and Fulham 2016 was 2,414
- Detached 7 (0.29%)
- Semi-Detached 40 (1.66%)
- Terraced 544 (22.54%)
- Flat/Maisonette 1,689 (69.97%)
- Other 134 (5.55%)
Year on Year Comparison : Compared to Hammersmith and Fulham Property Market 2015 in 2016
- Total number of property sales in Hammersmith and Fulham has declined by 14%
- All property types have shown decline in number of properties sold except property type Other, Semi-Detached
- Other has shown significant increase of 11.67% in 2016
Average & Median Sales Price
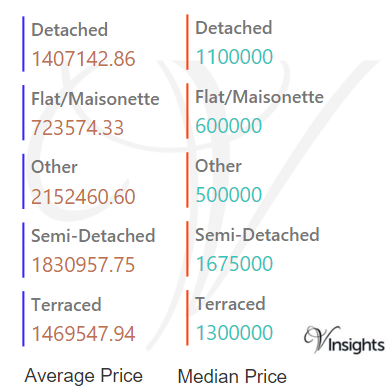
In 2016 the average property price was £991 K in Hammersmith and Fulham. The average property price for the different property types are:
- Detached: £1.41 millions
- Flat/Maisonette: £724 K
- Other: £2.15 millions
- Semi-Detached: £1.83 millions
- Terraced: £1.47 millions.
The median property price was £703 K. The median property price for the different property types are:
- Detached: £1.1 millions
- Flat/Maisonette: £600 K
- Other: £500 K
- Semi-Detached: £1.68 millions
- Terraced: £1.3 millions
Year on Year Comparison : Compared to Hammersmith and Fulham Property Market 2015 in 2016
- The average and median sales price across all property types have gone down except Semi-Detached, Terraced.
New Vs Not New Property Statistics
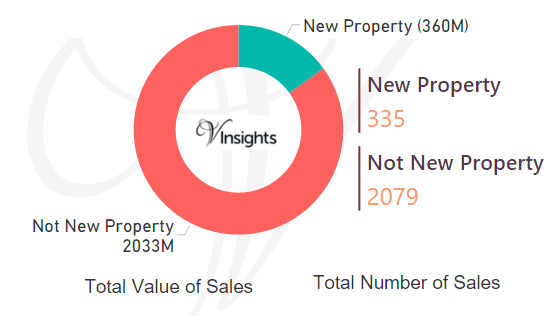
By Value Of Sales
- The sales value contributed by New Property was £360 millions (15.03%)
- where as Not New Property contribute £2.03 billions (84.97%)
By Number Of Sales
- New properties sold were 335 (13.88%)
- where as not new property sold were 2,079 (86.12%).
Year on Year Comparison : Compared to Hammersmith and Fulham Property Market 2015 in 2016
- New property market share in property market has gone slightly up in 2016 over 2015
All London Posts
351aad50-d300-4a84-ad78-6bac236ed74c|0|.0|27604f05-86ad-47ef-9e05-950bb762570c