Story Highlights
- Woking had total property sales of £924 millions in 2016
- The total number of properties sold in 2016 was 1,863
- The average sales price was £496 K, whereas the median was £370 K
- New Property sales were 5.91% by value, whereas Not New Property contributed 94.09%
- Stamp duty changes caused monthly spike in March
- Brexit coupled with Stamp Duty changes did not have negative impact, there was growth of 3.3%
Woking is one of the districts of Surrey.
Total Sales By Property Type
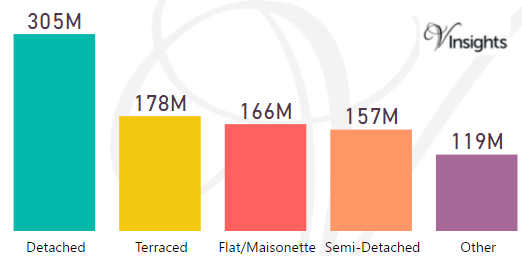
Woking had total property sales of £924 millions which was 8.61% of the total Surrey Property Market 2016
The split of £924 millions across the different property types are:
- Detached £305 millions (32.96%)
- Terraced £178 millions (19.26%)
- Flat/Maisonette £166 millions (17.93%)
- Semi-Detached £157 millions (17.01%)
- Other £119 millions (12.84%)
Woking Property Market at Postcode Level
| Postcode |
Coverage Area |
School |
Local Authority Area |
| GU21 |
Woking, Knaphill, St. John's, Horsell, Goldsworth Park |
Details |
Woking |
| GU22 |
Woking, Pyrford, Hook Heath, Mayford, Old Woking |
Details |
Woking |
| GU24 |
Bisley, Pirbright, Chobham, Knaphill, Brookwood, West End |
Details |
Woking, Surrey Heath, Guildford |
| KT14 |
Byfleet, West Byfleet |
Details |
Woking, Elmbridge, Runnymede |
| KT15 |
Addlestone, New Haw, Woodham |
Details |
Runnymede, Woking |
Month-wise Break-up of Total Sales
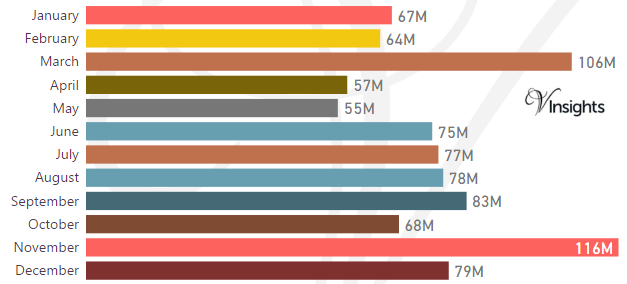
Some of the insights based on the £924 millions month-wise break-down :
Stamp Duty Hike Impact
- March had property sale spike of £106 millions compared to £64 millions in Feb and then sales sharply drop
- The impetus for it was to avoid the extra 3% in Stamp Duty Tax applicable on buying an additional home, being applicable from April 1 2016
Brexit Impact
- Brexit took place on 23rd June 2016.
- Year on Year growth has been 3.3% in 2016 over 2015
- Brexit coupled with Stamp Duty Hike had no negative impact on Woking Property Market in 2016
Total No Of Properties Sold By Property Type
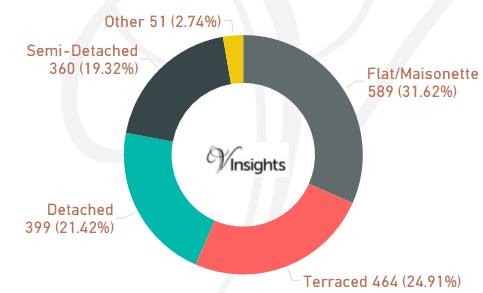
Woking had total property sales of 1,863. The split across the different property types are:
- Flat/Maisonette 589 (31.62%)
- Terraced 464 (24.91%)
- Detached 399 (21.42%)
- Semi-Detached 360 (19.32%)
- Other 51 (2.74%)
Average & Median Sales Price
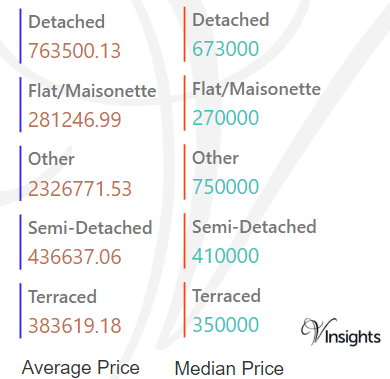
The average sales price in Woking was £496 K and for different property types it was:
- Detached £764 K
- Semi-Detached £437 K
- Terraced £384 K
- Flat/Maisonette £281 K
- Other it is £ 2.3 millions
Similarly median sales price in Woking was £370 K and for different property types are:
- Detached £673 K
- Semi-Detached £410 K
- Terraced £350 K
- Flat/Maisonette £270 K
- Other it is £750 K
New Vs Not New Property Statistics
By Sales Value the split is as follows:
- New Property contributed £55 millions (5.91%)
- Not New Property contributed £870 millions (94.09%)
By Total Number the split is as follows:
- New properties sold were 128 (6.87%)
- Not new property sold were 1,735 (93.13%)
All Surrey Posts

a8a34d06-924c-4c37-af69-a4749cce33b1|0|.0|27604f05-86ad-47ef-9e05-950bb762570c
Story Highlights
- Southampton had total property sales of £1.1 billion in 2016
- The total number of properties sold in 2016 was 4,096.
- The average sales price in Southampton was £268 K, whereas median was £193 K
- New Property sales were 7.59% by value, where as Not New Property contributed 92.41%
- Stamp duty changes caused monthly spike in March
- Southampton had growth of 11.5% in 2016 over 2015
Southampton has unitary authority status in South East England.
Total Sales By Property Type
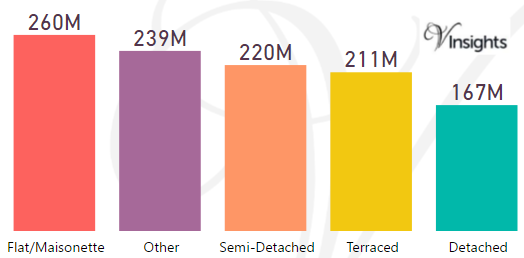
Southampton had total property sales of £1.1 billion which was % of the total South East property Market in 2016.
The split of £1.1 billion in Southampton across the different property types are:
- Flat/Maisonette £260 millions (23.71%)
- Semi-Detached £220 millions (20.07%)
- Terraced £211 millions (19.2%)
- Detached £167 millions (15.24%)
- Other £239 millions (21.78%)
Year on Year Comparison : Compared to Southampton Property Market 2015 in 2016
- All the property types sales have shown growth except Flat/Maisonette and Detached.
Southampton Property Market at Postcode Level
| Postcode |
Coverage Area |
School |
Local Authority Area |
| SO14 |
City Centre, St. Mary's, Newtown, Nicholstown, Ocean Village, Chapel, Eastern Docks, Bevois Valley |
Details |
Southampton |
| SO15 |
Shirley, Freemantle, Banister Park, Millbrook, Redbridge |
Details |
Southampton |
| SO16 |
Bassett, Lordswood, Redbridge, Rownhams, Nursling, Chilworth |
Details |
Southampton |
| SO17 |
Highfield, Portswood, St Denys, Swaythling |
Details |
Southampton |
| SO18 |
Bitterne, Bitterne Park, Harefield, Townhill Park, Chartwell Green, Southampton Airport |
Details |
Southampton |
| SO19 |
Sholing, Thornhill, Woolston, Weston |
Details |
Southampton |
Month-wise Break-up of Total Sales
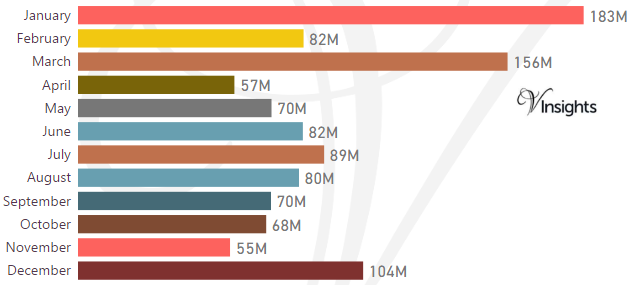
Some of the insights based on the £1.1 billion month-wise break-down :
Stamp Duty Hike Impact
- March had property sale spike of £156 millions compared to £82 millions in Feb
- The impetus for it was to avoid the extra 3% in Stamp Duty Tax applicable on buying an additional home, being applicable from April 1 2016
Brexit Impact
- Brexit took place on 23rd June 2016.
- Year on Year growth (compared to 2015) has been 11.5% in 2016
- Brexit coupled with Stamp Duty Hike did not had negative impact on Southampton Property Market in 2016
Total No Of Properties Sold By Property Type
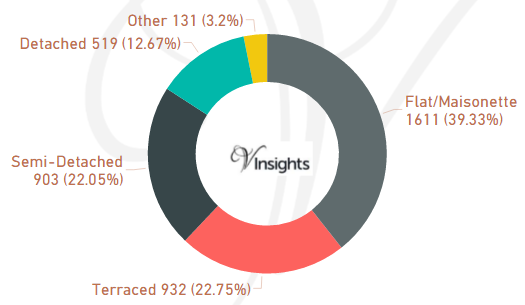 Southampton had total property sales of 4,096. The split across different property types are:
- Terraced 932 (22.75%)
- Semi-Detached 903 (22.05%)
- Flat/Maisonette 1,611 (39.33%)
- Detached 519 (12.67%)
- Other 131 (3.2%)
Year on Year Comparison : Compared to Southampton Property Market 2015 in 2016
- Total number of property sales in 2016 has decreased by 6.9%.
- All property types have shown decline in number of properties sold except property type Other.
- Other has shown growth of 44%
Average & Median Sales Price
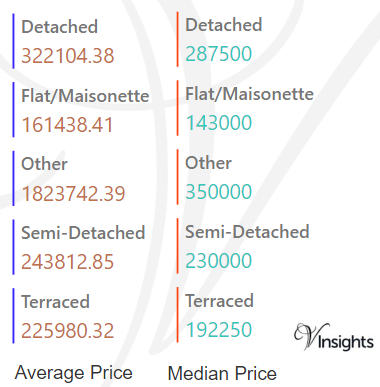
The average sales price in Southampton was £268 K. For the different property types it was
- Detached at £322 K
- Semi-Detached at £244 K
- Terraced at £226 K
- Flat/Maisonette at £161 K
- Other it is at £1.8 millions
Similarly median sales price in Southampton was £193 K. For different property types it was
- Detached at £288 K
- Semi-Detached at £230 K
- Terraced at £192 K
- Flat/Maisonette at £143 K
- Other it is at £350 K
Year on Year Comparison : Compared to Southampton Property Market 2015 in 2016
- The average and median property prices have gone up across all property types.
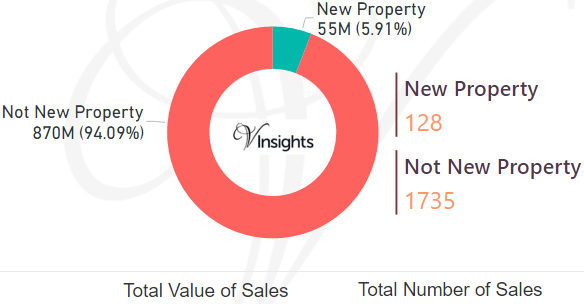
New Vs Not New Property Statistics
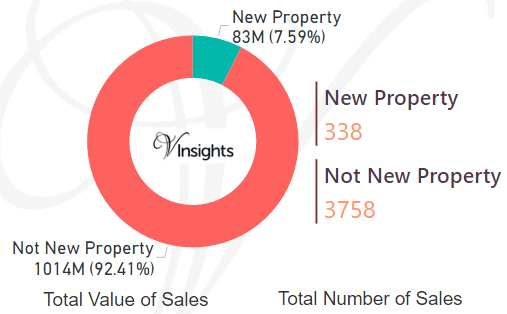
By Sales Value the split is as follows:
- New Property contributed £83 millions (7.59%)
- Not New Property contributed £1.01 billion (92.41%)
By Total Number the split is as follows:
- New properties sold were 338 (8.25%)
- Not new property sold were 3,758 (91.75%)
Year on Year Comparison : Compared to Southampton Property Market 2015 in 2016
- New property market share in property market has gone down
All South East England Posts
76b62730-f4d1-4d09-8fec-2c15610fab17|0|.0|27604f05-86ad-47ef-9e05-950bb762570c
Story Highlights
- Portsmouth had total property sales of £972 millions in 2016
- The year-on-year growth compared to 2015 was 3.4%
- The total number of properties sold in 2016 was 3,921
- The average sales price in Portsmouth was £248 K, whereas the median was £187 K
- New Property sales were 4.98% by value, whereas Not New Property contributed 95.02%
- Stamp duty hike caused monthly spike in March
Portsmouth has unitary authority status in South East England.
Total Sales By Property Type
 Portsmouth had total property sales of £972 millions which was 1.57% of the total South East property Market in 2016.
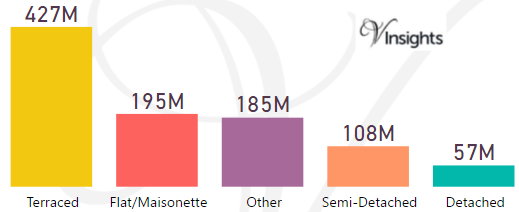
The split of £972 millions in Portsmouth across the different property types are:
- Terraced £427 millions (43.98%)
- Flat/Maisonette £195 millions (20.03%)
- Semi-Detached £108 millions (11.14%)
- Detached £57 millions (5.85%)
- Other £185 millions (19%)
Year on Year Comparison : Compared to Portsmouth Property Market 2015 in 2016
- All the property types sales have shown growth except Other.
Oxford Property Market at Postcode Level
| Postcode |
Coverage Area |
School |
Local Authority Area |
| PO1 |
Portsmouth, Fratton, Old Portsmouth, Portsea, Landport |
Details |
Portsmouth |
| PO2 |
Portsmouth, Hilsea, North End, Tipner, Stamshaw |
Details |
Portsmouth |
| PO3 |
Portsmouth, Hilsea, Baffins, Copnor, Anchorage Park |
Details |
Portsmouth |
| PO4 |
Southsea, Milton, Eastney |
Details |
Portsmouth |
| PO5 |
Southsea |
Details |
Portsmouth |
| PO6 |
Cosham, Drayton, Farlington |
Details |
Portsmouth |
Month-wise Break-up of Total Sales
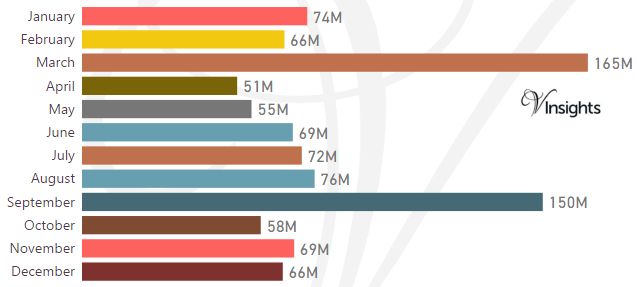
Some of the insights based on the £972 millions month-wise break-down :
Stamp Duty Hike Impact
- March had property sale spike of £165 millions compared to £66 millions in Feb
- The impetus for it was to avoid the extra 3% in Stamp Duty Tax applicable on buying an additional home, being applicable from April 1 2016
Brexit Impact
- Brexit took place on 23rd June 2016.
- Year on Year growth (compared to 2015) has been 3.4% in 2016 despite Brexit
- Brexit coupled with Stamp Duty Hike did not have negative impact on Portsmouth Property Market in 2016
Total No Of Properties Sold By Property Type
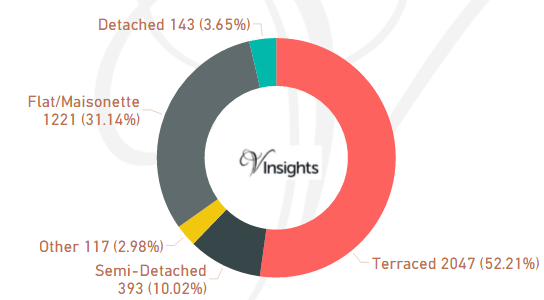
Portsmouth had total property sales of 3,921. The split across different property types are:
- Terraced 2,047 (52.21%)
- Semi-Detached 393 (10.02%)
- Flat/Maisonette 1,221 (31.14%)
- Detached 143 (3.65%)
- Other 117 (2.98%)
Year on Year Comparison : Compared to Portsmouth Property Market 2015 in 2016
- Total number of property sales in 2016 has decreased by %.
- All property types have shown growth in number of properties sold except property type Detached, Terraced.
- Other has shown growth of 105.26%
Average & Median Sales Price
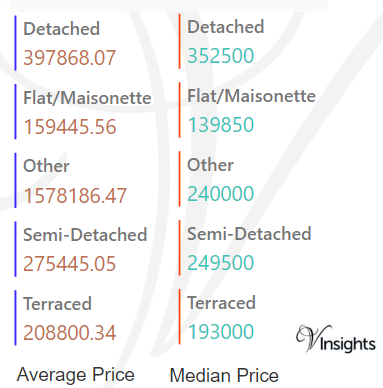
The average sales price in Portsmouth was £248 K. For the different property types it was
- Detached at £398 K
- Semi-Detached at £275 K
- Terraced at £209 K
- Flat/Maisonette at £159 K
- Other it is at £1.6 millions
Similarly median sales price in Portsmouth was £187 K. For different property types it was
- Detached at £353 K
- Semi-Detached at £250 K
- Terraced at £193 K
- Flat/Maisonette at £140 K
- Other it is at £240 K
Year on Year Comparison : Compared to Portsmouth Property Market 2015 in 2016
- The average and median property prices have gone up except for property type Other.
- Other had massive decline in average and median property price
New Vs Not New Property Statistics
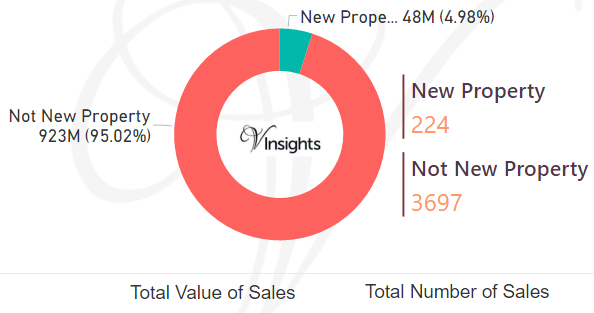
By Sales Value the split is as follows:
- New Property contributed £48 millions (4.98%)
- Not New Property contributed £923 millions (95.02%)
By Total Number the split is as follows:
- New properties sold were 224 (5.71%)
- Not new property sold were 3,697 (94.29%)
Year on Year Comparison : Compared to Portsmouth Property Market 2015 in 2016
- New property market share in property market has gone up
All South East England Posts
6d40522b-0c25-49e3-ae5c-c357ac5434ac|0|.0|27604f05-86ad-47ef-9e05-950bb762570c
Story Highlights
- Guildford had total property sales of £1.2 billions in 2016
- The total number of properties sold in 2016 was 2200
- The average sales price was £558 K, whereas the median was £418 K
- New Property sales were 5.52% by value, whereas Not New Property contributed 94.48%
- Stamp duty changes caused monthly spike in March
- Brexit coupled with Stamp Duty have led to stagnation of Guild Property Market over 2015
Guildford is one of the districts of Surrey.
Total Sales By Property Type
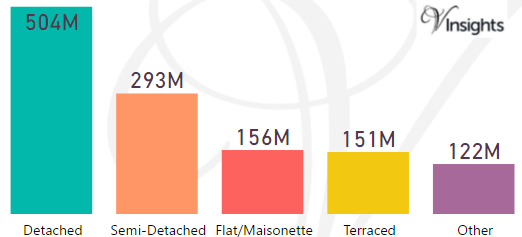
Guildford had total property sales of £1.2 billions which was 11.44% of the total Surrey Property Market 2016
The split of £1.2 billions across the different property types are:
- Detached £504 millions (41.06%)
- Semi-Detached £293 millions (23.91%)
- Flat/Maisonette £156 millions (12.73%)
- Terraced £151 millions (12.33%)
- Other £122 millions (9.96%)
Guildford Property Market at Postcode Level
| Postcode |
Coverage Area |
School |
Local Authority Area |
| GU1 |
Guildford Town Centre, Slyfield, Merrow |
Details |
Guildford |
| GU2 |
Guildford Park, Onslow Village, Park Barn, University of Surrey |
Details |
Guildford |
| GU3 |
Normandy, Puttenham, Worplesdon, Christmas Pie, Flexford |
Details |
Guildford |
| GU4 |
Burpham, Chilworth, Jacobs Well, Shalford |
Details |
Guildford |
| GU5 |
Albury, Bramley, Shere |
Details |
Guildford, Waverley |
| GU10 |
Bentley, Frensham, Churt, Crondall, Tongham, Ewshot, Seale, Tilford, Wrecclesham |
Details |
Waverley, East Hampshire, Guildford, Hart |
| GU12 |
Aldershot, Ash, Ash Green, Ash Vale |
Details |
Rushmoor, Guildford |
| GU23 |
Send, Ripley, Ockham, Wisley |
Details |
Guildford |
| GU24 |
Bisley, Pirbright, Chobham, Knaphill, Brookwood, West End |
Details |
Woking, Surrey Heath, Guildford |
| KT11 |
Cobham, Stoke d'Abernon, Downside, Hatchford, parts of Wisley, Ockham and Hersham |
Details |
Elmbridge, Guildford, Mole Valley |
| KT23 |
Great Bookham, Little Bookham |
Details |
Mole Valley, Guildford |
| KT24 |
West Horsley, East Horsley, Effingham |
Details |
Guildford, Mole Valley |
| RH5 |
Abinger, Capel, Westhumble, Mickleham, Ockley, Holmbury St Mary |
Details |
Mole Valley, Guildford |
Month-wise Break-up of Total Sales
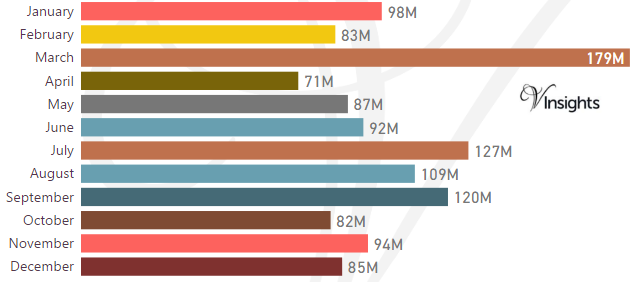
Some of the insights based on the £1.2 billions month-wise break-down :
Stamp Duty Hike Impact
- March had property sale spike of £179 millions compared to £83 millions in Feb and then sales sharply drop
- The impetus for it was to avoid the extra 3% in Stamp Duty Tax applicable on buying an additional home, being applicable from April 1 2016
Brexit Impact
- Brexit took place on 23rd June 2016.
- Year on Year decline has been 0.65% in 2016 over 2015
- Brexit coupled with Stamp Duty Hike did not impact Guildford Property Market in 2016
Total No Of Properties Sold By Property Type
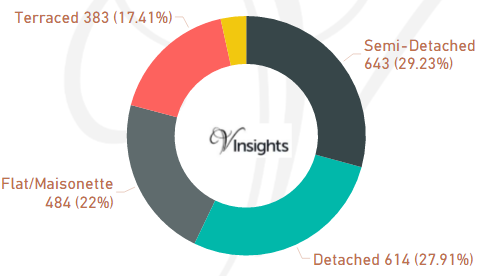
Guildford total no property sales was 2200 . The split across the different property types are:
- Semi-Detached 643 (29.23%)
- Detached 614 (27.91%)
- Flat/Maisonette 484 (22%)
- Terraced 383 (17.41%)
- Other 76 (3.45%)
Average & Median Sales Price
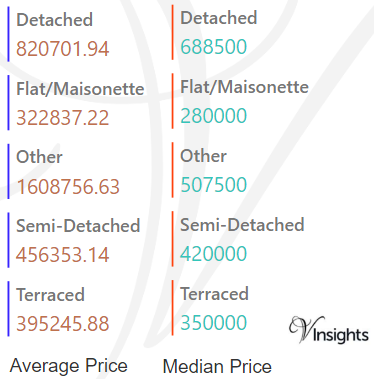
The average sales price in Guildford was £558 K and for different property types it was:
- Detached £821 K
- Semi-Detached £456 K
- Terraced £395 K
- Flat/Maisonette £323 K
- Other it is £ 1.6 millions
Similarly median sales price in Guildford was £418 K and for different property types are:
- Detached £689 K
- Semi-Detached £420 K
- Terraced £350 K
- Flat/Maisonette £280 K
- Other it is £508 K
New Vs Not New Property Statistics
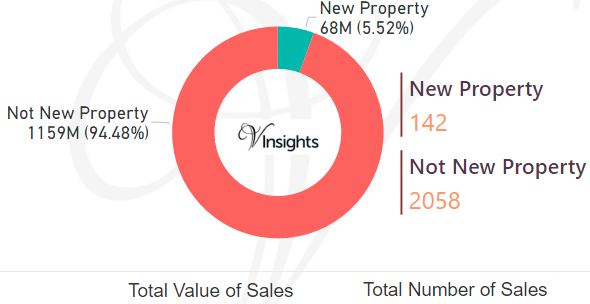
By Sales Value the split is as follows:
- New Property contributed £68 millions (5.52%)
- Not New Property contributed £1.2 billions (94.48%)
By Total Number the split is as follows:
- New properties sold were 142 (6.45%)
- Not new property sold were 2,058 (93.55%)
All Surrey Posts
9feaf23e-8d64-46c4-b364-3847e93ae7ad|0|.0|27604f05-86ad-47ef-9e05-950bb762570c
Story Highlights
- Reigate and Banstead had total property sales of £1.3 billions in 2016
- The total number of properties sold in 2016 was 20,347
- The average sales price was £464 K, whereas the median was £385 K
- New Property sales were 6.49% by value, whereas Not New Property contributed 93.51%
- Stamp duty changes caused monthly spike in March
- Brexit coupled with Stamp Duty changes had negative impact, there was decline of 3.3%
Reigate and Banstead is one of the districts of Surrey.
Total Sales By Property Type

Reigate and Banstead had total property sales of £1.3 billions which was 11.87% of the total Surrey Property Market 2016
The split of £1.3 billions across the different property types are:
- Detached £512 millions (40.22%)
- Semi-Detached £313 millions (24.6%)
- Flat/Maisonette £227 millions (17.79%)
- Terraced £178 millions (13.95%)
- Other £44 millions (3.44%)
Reigate and Banstead Property Market at Postcode Level
| Postcode |
Coverage Area |
School |
Local Authority Area |
| CR5 |
Coulsdon, Old Coulsdon, Chipstead, Hooley, Netherne-on-the-Hill, part of Woodmansterne, Clockhouse |
Details |
Croydon, Reigate and Banstead, Sutton |
| KT17 |
Epsom, Ewell, Stoneleigh |
Details |
Epsom and Ewell, Reigate and Banstead, Sutton |
| KT18 |
Epsom, Tattenham Corner, Headley, Langley Vale |
Details |
Epsom and Ewell, Mole Valley, Reigate and Banstead |
| KT20 |
Tadworth, Kingswood, Lower Kingswood, Walton-on-the-Hill, Burgh Heath, Mogador, Box Hill |
Details |
Reigate and Banstead, Mole Valley |
| RH1 |
Redhill, Merstham, Earlswood, South Earlswood, Whitebushes, Salfords,Nutfield Marsh,
South Nutfield, Bletchingley, Outwood |
Details |
Reigate and Banstead, Tandridge |
| RH2 |
Reigate, Woodhatch, South Park, Skimmington,
Leigh, Dawes Green, Bunce Common, Shellwood Cross,
Nalderswood, Sidlow, Irons Bottom |
Details |
Reigate and Banstead,
Mole Valley |
| RH6 |
Gatwick Airport,Horley, Burstow |
Details |
Reigate and Banstead, Crawley, Mole Valley, Tandridge |
| SM2 |
Belmont, South Sutton, South Cheam, East Ewell |
Details |
Epsom and Ewell, Reigate and Banstead, Sutton |
| SM7 |
Banstead, Woodmansterne, Nork, Little Woodcote |
Details |
Reigate and Banstead, Sutton |
Month-wise Break-up of Total Sales
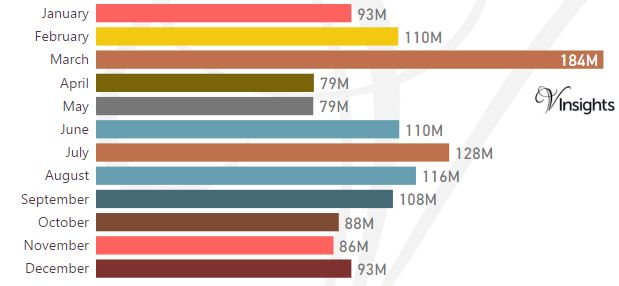
Some of the insights based on the £1.3 billions month-wise break-down :
Stamp Duty Hike Impact
- March had property sale spike of £184 millions compared to £110 millions in Feb and then sales sharply drop
- The impetus for it was to avoid the extra 3% in Stamp Duty Tax applicable on buying an additional home, being applicable from April 1 2016
Brexit Impact
- Brexit took place on 23rd June 2016.
- Year on Year decline has been 3.3% in 2016 over 2015
- Brexit coupled with Stamp Duty Hike did not impact Reigate and Banstead Property Market in 2016
Total No Of Properties Sold By Property Type
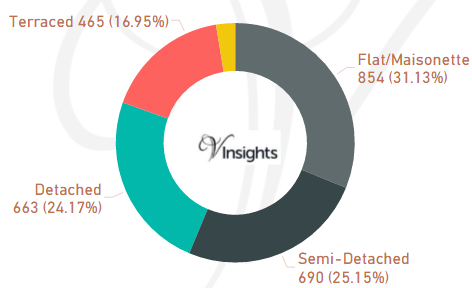
Reigate and Banstead had total property sales of 20347. The split across the different property types are:
- Flat/Maisonette 854 (31.13%)
- Semi-Detached 690 (25.15%)
- Detached 663 (24.17%)
- Terraced 465 (16.95%)
- Other 746 (3,67%)
Average & Median Sales Price
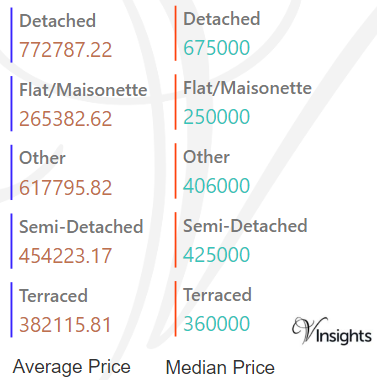
The average sales price in Reigate and Banstead was £464 K and for different property types it was:
- Detached £773 K
- Semi-Detached £454 K
- Terraced £382 K
- Flat/Maisonette £265 K
- Other it is £ 618 K
Similarly median sales price in Reigate and Banstead was £385 K and for different property types are:
- Detached £675 K
- Semi-Detached £425 K
- Terraced £360 K
- Flat/Maisonette £250 K
- Other it is £406 K
New Vs Not New Property Statistics
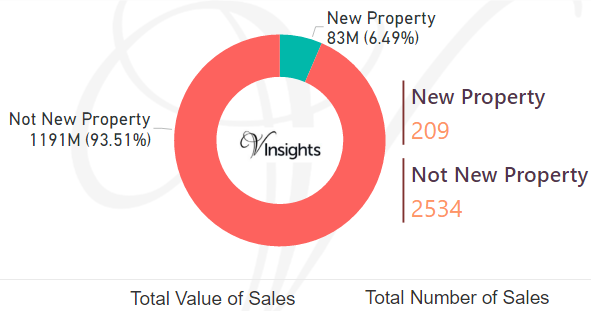
By Sales Value the split is as follows:
- New Property contributed £83 millions (6.49%)
- Not New Property contributed £1.2 billions (93.51%)
By Total Number the split is as follows:
- New properties sold were 209 (7.62%)
- Not new property sold were 2,534 (92.38%)
All Surrey Posts
c429bb79-8e14-4449-a614-ece1bf699c0f|0|.0|27604f05-86ad-47ef-9e05-950bb762570c